
Building upon SONAR intermodal and dry van contract rate data already available in the platform, as of today, intermodal savings rates are now included in SONAR, as a national average, for 63 individual lanes, and two indices.
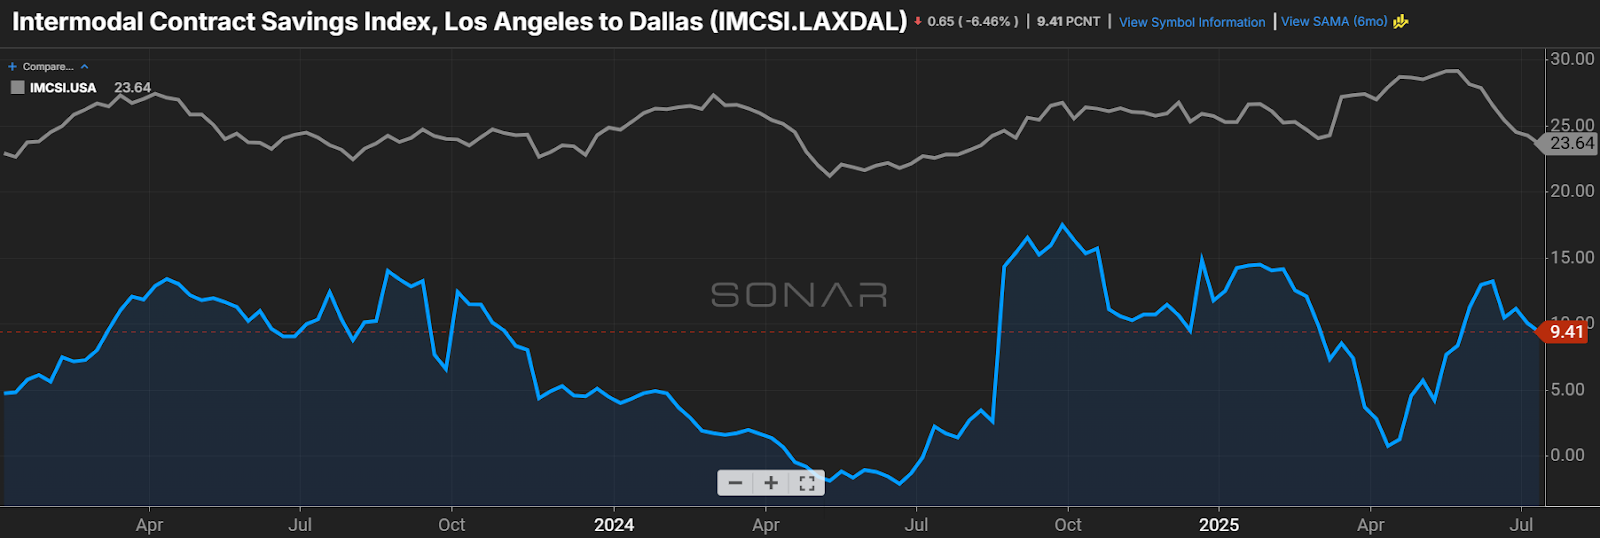
The LA to Dallas lane is competitive between truckload and intermodal with a 9% average intermodal savings rate. That’s below the national average of 23%. (Chart: SONAR)
The intermodal savings rate is the percent savings that a shipper can expect to realize by using domestic rail intermodal rather than truckload. It is the calculated percent difference between rates that include fuel surcharges for both modes. The inclusivity of fuel surcharges is important because the greater fuel efficiency of intermodal is a significant component of the overall savings versus truckload.
The new dataset primarily targets shippers that move freight in dense corridors and/or longer haul lanes where rail intermodal could potentially be a viable option over truckload.
The 63 lanes chosen for the index are those with sufficient intermodal density to make intermodal a viable option for most shippers that can tolerate “truckload plus a day” service levels. The individual lanes were also selected on the basis of those where sufficient intermodal rate data is available.
The Transcontinental Index displays the average intermodal savings of five dense intermodal lanes outbound from Los Angeles. The objective is to give importers a quick read on changes in rates to move goods to consumption centers after they are transloaded from international containers into 53’ domestic containers. Meanwhile, the Local East Index displays the average savings of nine lanes in the eastern one-third of the US. That grouping of lanes is intended to represent those that are highly competitive with dry van, and therefore, more influenced by truckload market conditions. Truckload contracts are often repriced more frequently than intermodal contracts, so a tightening in market conditions could cause the savings rate to rise, at least temporarily, all else being equal.
For additional detail, see the Intermodal Savings Index Knowledge Center Article.
Supply Chain AI Symposium
Past the hype. Join operators, founders, and enterprise leaders figuring out how to deploy AI in supply chain.
Future of Rail Symposium
Reshoring is rewriting freight demand. Join shippers, rail executives, and government officials to shape the next decade.
F3: Future of Freight Festival
Industry-defining keynotes, rapid-fire technology demos, and industry leaders networking in experiences across Chattanooga - plus the inaugural F3 Awards Dinner featuring the FreightTech and Shipper of Choice reveals.
Past the hype. Join operators, founders, and enterprise leaders figuring out how to deploy AI in supply chain.
The Old Post • Chicago, IL Register NowReshoring is rewriting freight demand. Join shippers, rail executives, and government officials to shape the next decade.
The Signal at Chattanooga Choo Choo • Chattanooga TN Register NowIndustry-defining keynotes, rapid-fire technology demos, and industry leaders networking in experiences across Chattanooga - plus the inaugural F3 Awards Dinner featuring the FreightTech and Shipper of Choice reveals.
The Signal at Chattanooga Choo Choo • Chattanooga, TN Register Now