
The split between the world’s two largest container-shipping trade routes has grown even more acute as this year comes to a close.
The cost to transport eastbound boxes across the Pacific from Asia to the U.S., as tracked by the Freightos Baltic Daily Index, has continued to slump, whereas the price to ship westbound boxes via the Indian Ocean from Asia to Northern Europe has continued to rise.
The price to ship a 40-foot-equivalent unit (FEU) container on the China-North Europe route (SONAR: FBXD.CNER) is up 30% year-on-year.
The price from China to North America West Coast (SONAR: FBXD.CNAW) is down 20% over the same period.
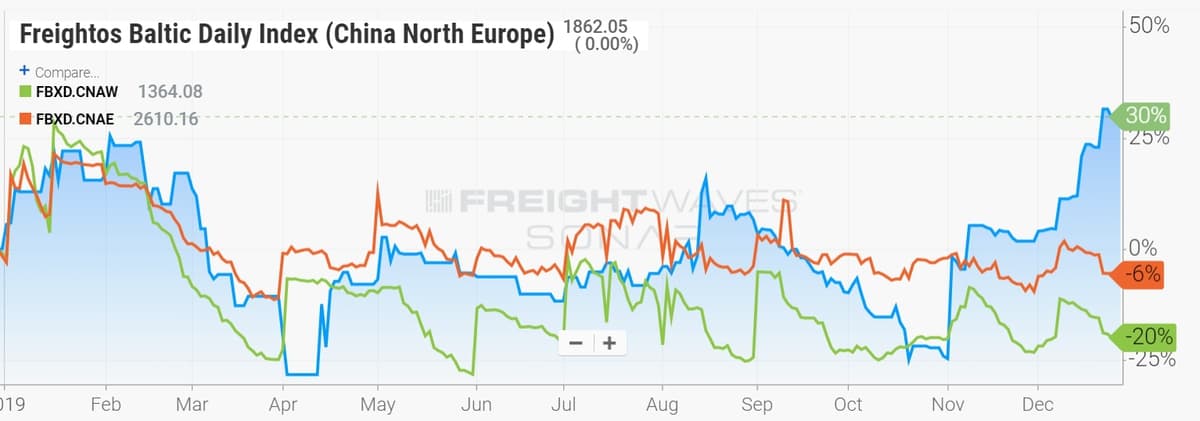
In terms of U.S. imports, the pendulum continues to swing more towards the East Coast at the expense of the West Coast. Container rates from China via the Panama Canal to the U.S. East Coast are down by just 6%, less than a third of the decline in rates to the West Coast over the same period.
IMO 2020 surcharges holding to Europe, not U.S.
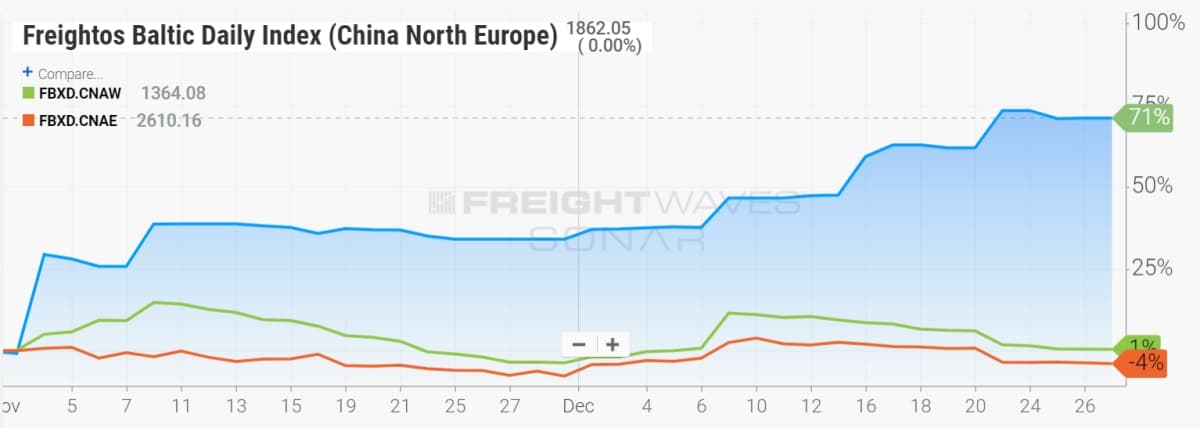
The disparity between the two main container routes has accelerated over the past two months. Since Nov. 1, China-North Europe rates are up 71%, whereas China-U.S. rates are generally flat.
The lack of change in U.S.-bound rates is important given that the world’s largest container lines instituted fuel surcharges on Dec. 1 in an attempt to pass along the costs of the IMO 2020 regulation. That rule mandates that as of Jan. 1, any vessel without an exhaust-gas scrubber must switch from cheap 3.5% sulfur fuel to more expensive 0.1-0.5% sulfur fuel. If the added cost increase is not fully incorporated into freight rates, it will be extremely problematic for container lines.
The “negative comp” effect
What seems like a simple trend story from the numbers — Asia-Europe is up, Asia-U.S. is down — is actually more nuanced.
The threat of tariffs due to the policies of U.S. President Donald Trump spurred U.S. importers to bring more cargo in ahead of time, which led to an increase in rates in the second half of 2018 and the first few months of 2019.
Consequently, the year-on-year rate decline seen today may not necessarily be due to lower-than-average demand, but rather, to one-off rate strength a year ago that makes today look weak in comparison, i.e., the “negative comp” effect.
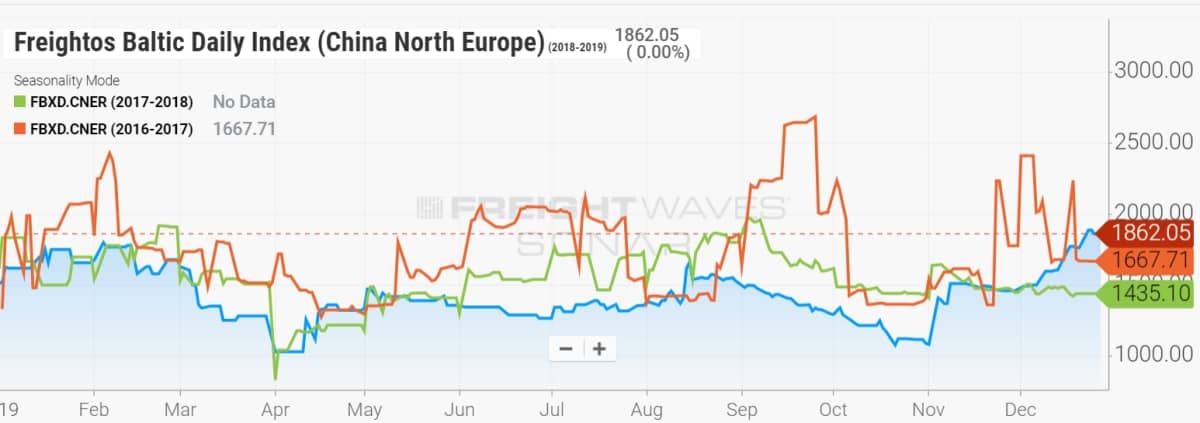
Trans-Pacific rates began climbing in August 2018, at least in part due to the tariff threat. SONAR data on the past three years’ rates on the trans-Pacific route to the West Coast shows that 2019 is roughly in line with 2017. Last year was the outlier to the upside.

The three-year pattern in the China-to-North Europe route is entirely different. Rates were strongest in 2017, fell back last year, and were even lower for most of this year. Only at the very end of the year, at a time when IMO 2020 surcharges have been applied, have Asia-Europe rates exceeded levels seen in 2017 and 2018. More FreightWaves/American Shipper articles by Greg Miller
Editor’s note: Freightos has a business agreement with FreightWaves that includes editorial coverage.