

Chart of the Week: Outbound Tender Rejection Index – Northeastern Region, West Coast SONAR: OTRI.URNE, OTRI.URWT
The current U.S. truckload market has opened the year with a ’90s hip-hop scene-style battle between the coasts, except this battle is for truckload capacity and not lyrical dominance. The West Coast regional tender rejection rates (OTRI.URWT) have plummeted to their lowest point since June 2020 as carriers rush to Southern California to take advantage of the trucking trifecta of elevated rates, miles and volumes — pushing the Northeastern rejection rates to their highest point since September.
Tender rejection rates measure the rate at which carriers accept their electronically submitted load requests from their contracted shippers. In 2019, a year of ample capacity, the national tender rejection rate averaged just over 6%. Over the past year that number has averaged over 20%. In short, rejection rates measure carrier willingness and/or availability to cover existing customers’ loads and both have been lacking for about 18 months.

The Western region covers all of the states of California, Nevada and Arizona, with the highest percentage of loads originating in and around Los Angeles. The Northeastern region covers all the states north and east of the Virginias.
Over the past two weeks, rejection rates have increased from just over 19% to 22.4% out of the Northeast, while they have fallen from near 16% to 13.7% in the West.

Over that same period, spot rates from Elizabeth, New Jersey, to Dallas have increased 9 cents per mile or 4%, according to FreightWaves TRAC.

Moving in opposition, the rate from Los Angeles to Dallas has declined over 14 cents per mile, further illustrating the disparate capacity experiences between the coasts.
The rate for the Elizabeth to Dallas lane is significantly lower than the Los Angeles origin and may be playing a role in attracting carriers to what is normally a difficult market to reach while loaded.
The Los Angeles market has received a lot of attention over the past year while being fueled with consistently high freight volumes coming in off the ports. Carriers are largely aware they can get over double the rate they got prior to the pandemic and have priced themselves back into Southern California by keeping rates lower moving back into the area.
This can clearly be illustrated by looking at the spot rate for the return trip from Dallas to Los Angeles, which is currently averaging $1.40 per mile according to FreightWaves TRAC — 38% of the headhaul lane value.
The Northeast has not had the same level of rate inflation due to the fact that it is largely a destination point due to the high population density that fuels consumption. This region is also notoriously difficult to move out of once entered.
The majority of the outbound freight moves relatively short distances to other metropolitan areas in the region that are heavily trafficked, which reduces carrier efficiency. This is the polar opposite of the aggregate nature of the LA origin freight.
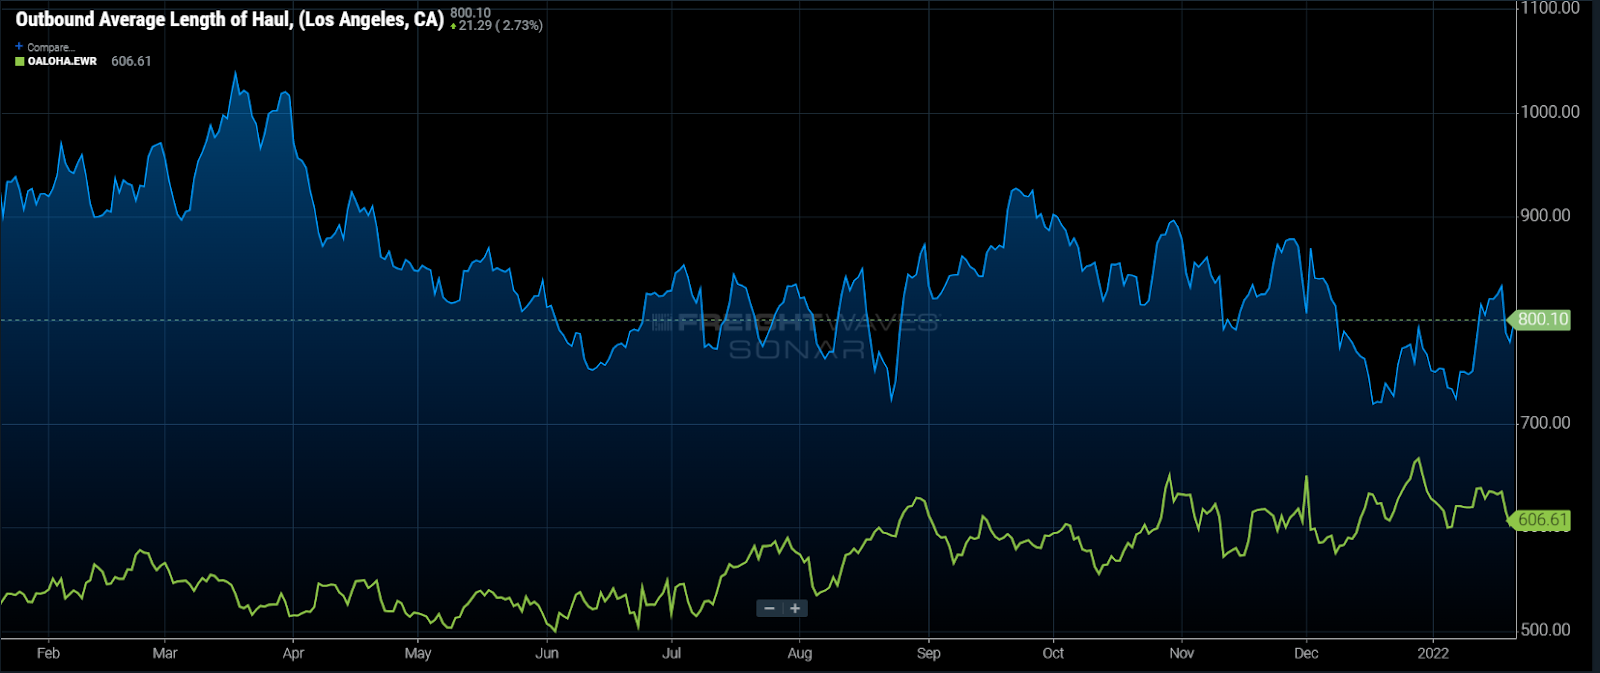
Times are changing as more longer-haul freight is appearing in the East, driving the average length of haul from the Elizabeth market about 17% higher over the past six months.

Import growth at the Port of New York and New Jersey has outpaced Los Angeles and Long Beach over the past year, though starting from a much smaller base. The number of shipments clearing customs in December at the Eastern port was 18% higher than the previous year, while Los Angeles and Long Beach grew at an 11% clip. It should be noted these are shipment counts not TEUs.
It is difficult to say how long this trend will last as carriers become more aware of the opportunities in the East. The natural flow of freight makes it much easier to cover Northeastern demand. As rates between the two coasts converge, rejection rates should fall as well. This may only lead to a reversing of trend on the West Coast, however, as demand still far exceeds the current capacity in total.
About the Chart of the Week
The FreightWaves Chart of the Week is a chart selection from SONAR that provides an interesting data point to describe the state of the freight markets. A chart is chosen from thousands of potential charts on SONAR to help participants visualize the freight market in real time. Each week a Market Expert will post a chart, along with commentary, live on the front page. After that, the Chart of the Week will be archived on FreightWaves.com for future reference.
SONAR aggregates data from hundreds of sources, presenting the data in charts and maps and providing commentary on what freight market experts want to know about the industry in real time.
The FreightWaves data science and product teams are releasing new data sets each week and enhancing the client experience.
To request a SONAR demo, click here.
Freight Fraud Symposium
Double brokering. AI deepfakes. Identity theft. Freight fraud is an existential threat to the industry. Get ahead of it.
Supply Chain AI Symposium
Past the hype. Join operators, founders, and enterprise leaders figuring out how to deploy AI in supply chain.
Future of Rail Symposium
Reshoring is rewriting freight demand. Join shippers, rail executives, and government officials to shape the next decade.
Double brokering. AI deepfakes. Identity theft. Freight fraud is an existential threat to the industry. Get ahead of it.
Rock & Roll Hall of Fame • Cleveland, OH Register NowPast the hype. Join operators, founders, and enterprise leaders figuring out how to deploy AI in supply chain.
The Old Post Office • Chicago, IL Register NowReshoring is rewriting freight demand. Join shippers, rail executives, and government officials to shape the next decade.
The Signal at Chattanooga Choo Choo • Chattanooga, TN Register Now