
The Cass Freight Shipments Index shows wider ranges with less predictability over the past six years
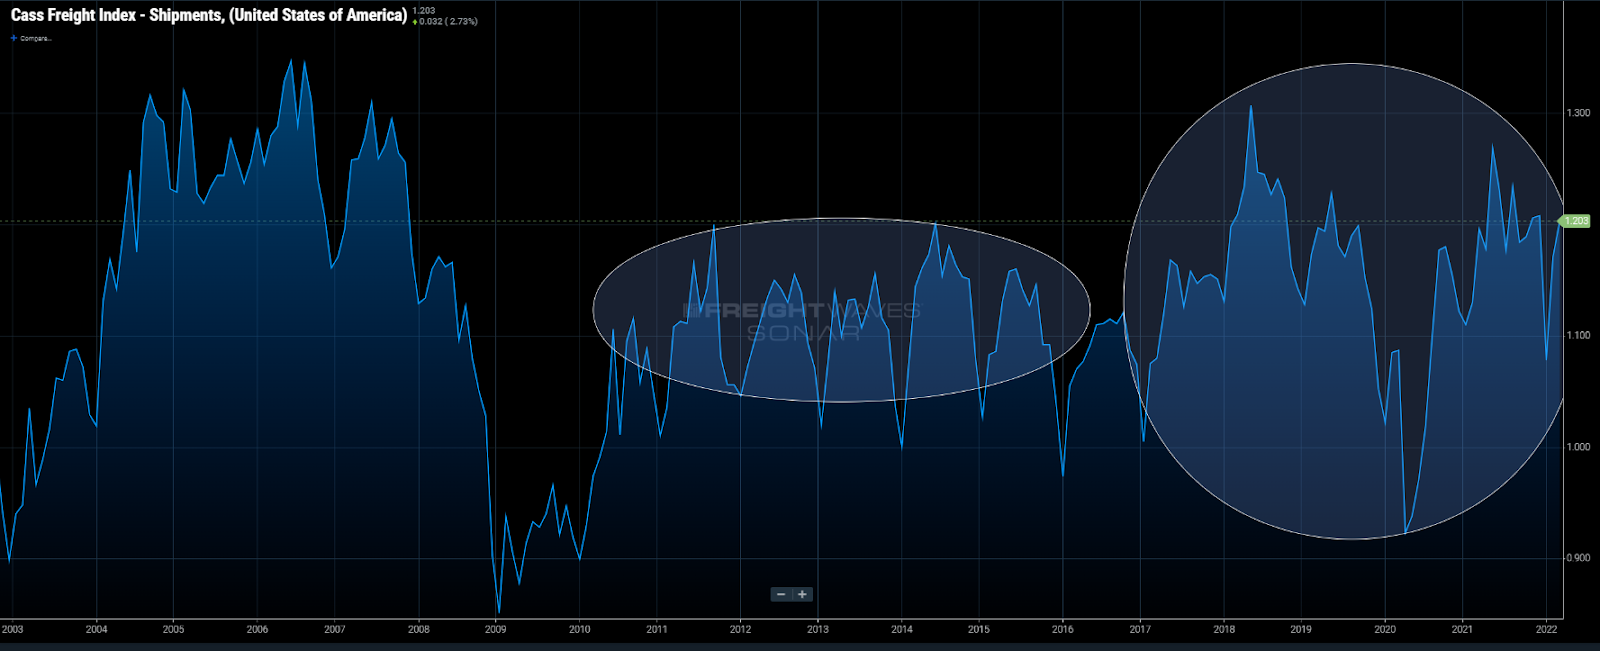
Chart of the Week: Cass Freight Shipments – USA SONAR: CFIS.USA
After enjoying one of the most stable stretches in modern history from 2010 to 2015, the freight market has been on a wild ride worthy of a theme park centerpiece. After six years of “anomalous” behavior, it is probably time to consider the “normal” five-year period in the first half of the 2010s the anomaly.
The Cass Freight Shipments Index, which has a base value of 1 starting in January 1990, stayed relatively stable, bouncing largely between values of 1 and 1.2 (20% difference) from mid-2010 to late 2015. More important than the range is the repetitive seasonal rhythm that resembles a healthy echocardiogram.
From 2016 to the present, it has moved between a high of 1.307 in May 2018 and low of 0.923 (41% difference) in April 2020, but the somewhat predictable seasonal pattern is largely absent during this period.
The Cass Freight Shipments Index combines mostly truckload, LTL and intermodal shipment volumes based on invoices it processes from its clients and is a solid aggregated measurement for shipping trends in the U.S. The website states that it is roughly 50% truckload and 25% LTL.
Many may still discount the events of the past six years as black swans that have low probabilities of recurring. While this may be true for the events individually, no one can ignore the fact that these types of pattern disruptors have become more prevalent and their impacts last well beyond the initial outset.
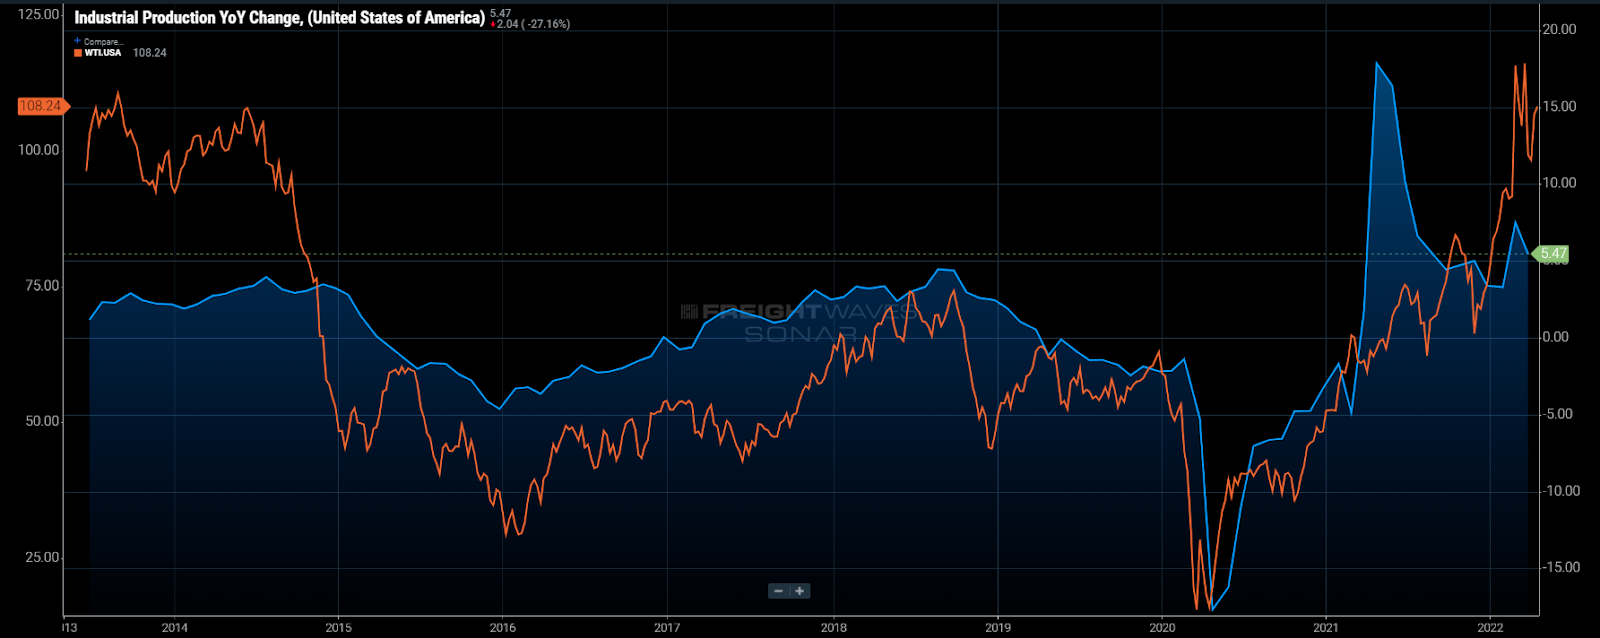
The COVID-19 pandemic has obviously been the most disruptive economic force in recent history and will leave a permanent mark on many supply chains. But the recent turbulent freight market cycle began in 2016 with an industrial recession, driven in part by the collapsing price of crude oil.
Freight demand softened in 2016, leading to an erosion of capacity that set up an extremely tight 2017-18 freight market after demand returned thanks to tax breaks, an active produce season and a few major landfalling hurricanes.

Spot rate growth during this period led to increased fleet expansion that drowned the market with capacity in 2019, which is illustrated in the increase and subsequent collapse of used Class 8 truck prices in 2018-19. Carrier failures rose to multiyear highs as a result. Many of the affected carriers, such as Celadon and LTL carrier New England Motor Freight, had a long history.
Many were arguing that the market was about to see another 2018 at the start of 2020 because of capacity erosion. The initial wave of the pandemic may have accelerated that situation as many companies braced for an economic downturn.
The driving force behind this volatility is the tight operating environment of most of the capacity in the U.S. Approximately 95% of the carriers run 20 or fewer trucks in their fleets. Each of these operators represents a competitive unit, and they are the most exposed when demand subsides.
The Truckload Carriers Association (TCA), which is mainly composed of small to midsize fleets, compiles benchmark operational metric data for its members. The data illustrates the differing experience between the large and small carriers.
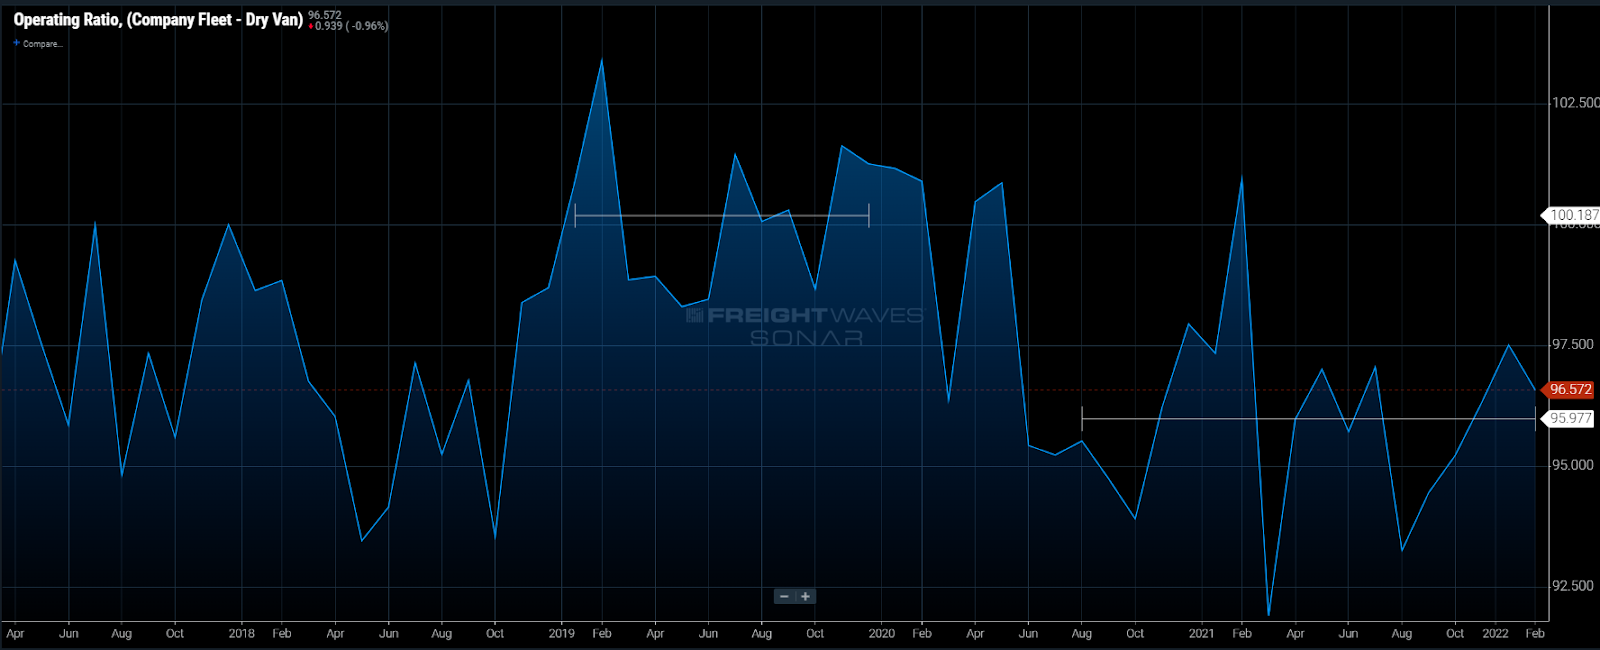
The operating ratio (OR) for TCA’s dry van carriers averaged over 100 in 2019, indicating that they essentially broke even that year in terms of operating. This value excludes taxes and financing costs, so in reality many showed a loss in total.
Since August 2020, their ORs have averaged just 4% better, or 96%, while larger fleets like Knight-Swift have enjoyed values below 80% — the reason being that most of the pandemic’s economic effects have benefited larger shippers that typically use larger carriers.
With the recent collapse in the truckload spot market, the smaller carriers are the first that will feel the pressure. They represent most of the competition in the domestic truckload market and rely heavily on transactional freight to support their networks. Shrinking demand will hit them hardest and lead to increasing exits faster than in previous years thanks to a higher cost burden.
Demand-side volatility is not new, but many have been lulled into a false sense of security in the post-recession era. Freight market activity is looking more like a cryptocurrency chart than a predictable echocardiogram, which is also historically more common. The recent black swan events only act as accelerants, not ignitors.
About the Chart of the Week
The FreightWaves Chart of the Week is a chart selection from SONAR that provides an interesting data point to describe the state of the freight markets. A chart is chosen from thousands of potential charts on SONAR to help participants visualize the freight market in real time. Each week a Market Expert will post a chart, along with commentary, live on the front page. After that, the Chart of the Week will be archived on FreightWaves.com for future reference.
SONAR aggregates data from hundreds of sources, presenting the data in charts and maps and providing commentary on what freight market experts want to know about the industry in real time.
The FreightWaves data science and product teams are releasing new datasets each week and enhancing the client experience.
To request a SONAR demo, click here.