


Chart of the Week: Diesel Truck Stop Price Per Gallon, Ultra-Low Sulfur Diesel Rack Price, Fuel Spread – USA SONAR: DTS.USA, ULSDR.USA, FUELS.USA
The retail price for diesel fuel has jumped 28% since Russia’s invasion of Ukraine, or roughly $1.12 a gallon. Fuel prices are higher than they were in 2009 when the DOE reported an average price of $4.72 that May. There are still questions about how long this will last, but there are both good and bad implications for carriers and the results vary wildly based on your buying power.
Diesel remains the primary source of fuel for Class 8 trucks and accounts for roughly 15%-25% of the total cost of operation. Larger fleets tend to have relationships with fuel providers and get fuel at or near the wholesale or rack price, represented in the blue line in the chart (ULSDR).
Smaller operations do not have the relationships or leverage most of the time to get their fuel at anything less than retail, which is represented by the green line in FreightWaves’ proprietary Diesel Truck Stop (DTS) price data — which produces a daily number versus the DOE weekly value. The lack of buying power puts smaller operators at a competitive disadvantage in regard to pricing, especially when rack prices drop rapidly as they did this week.
The orange line is the fuel spread or the retail price less the rack price. This number is only viable to carriers who can buy fuel based on rack price. When the spread is high, there is more opportunity for those carriers to net profit from their contracted accounts. When the spread moves lower quickly, carriers can lose money on fuel. The reason for this polarizing result is in the way fuel costs are passed along to customers.
In just about every rate agreement for anything that moves on less-than-truckload and full truckload, there is a surcharge table that explains either a percentage-of-total-cost or rate-per-mile accessorial fee depending on the weekly DOE reported average price of ultra-low sulfur diesel. This table is largely calculated based on the average fuel efficiency of the fleet, which tends to be somewhere between 6 and 6.5 miles per gallon and looks something like this for truckload:
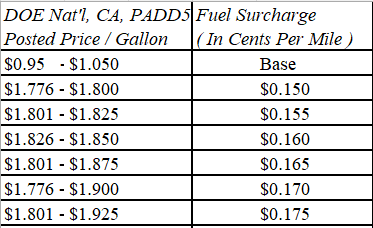
From March 1 to Wednesday, the rack price increased from $3 a gallon to $3.93 a gallon, while fuel surcharge tables were based on a retail price of $4.10 a gallon.
Using the example scale, carriers charged their customers roughly 39 cents a mile for fuel while their costs surged from 46 cents a mile to 60 cents a mile (31%) if we assume a 6.5-mpg average. In this example the carrier loses 14 cents per mile by the end of the week.
On the flip side, the carrier makes that money back if volumes are similar in following weeks as rack prices fell back and retail prices remained elevated. This level of volatility is not typical, but it can wreak havoc on bottom lines for carriers and shippers, and both entities cannot hedge away all risk.
As mentioned earlier, the smaller carriers and operators have to pass along the retail price and try to remain competitive. The good news is their clientele tends to be different than the enterprise fleets, favoring smaller shippers and more specialized freight. The bad news is they are at a marked disadvantage when they run up against the carriers with buying power. Some of this can be overcome with lower overhead costs and selective fueling.
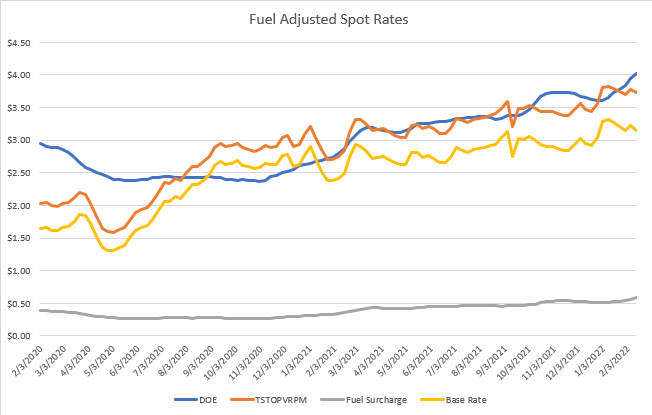
Fuel costs are more than likely already having an impact on keeping transportation costs high, though difficult to see. In the above chart, the yellow line represents the national average spot rate costs for van loads according to Truckstop.com, less the estimated fuel charges based on the surcharge table presented easier. The orange line is the all-in rate.
The takeaway here is the widening gap between these two lines, representing fuel costs potentially increasing as a percentage of the total — in this case from 12% to17% year-over-year. In other words, spot rates may be propped up a bit by rising fuel prices.
So far, it appears the recent weeks’ fuel cost fluctuations will be a wash for larger fleets in terms of hit to profitability, but rising fuel costs and the increasing volatility have long-run implications to inflationary pressure.
About the Chart of the Week
The FreightWaves Chart of the Week is a chart selection from SONAR that provides an interesting data point to describe the state of the freight markets. A chart is chosen from thousands of potential charts on SONAR to help participants visualize the freight market in real time. Each week a Market Expert will post a chart, along with commentary, live on the front page. After that, the Chart of the Week will be archived on FreightWaves.com for future reference.
SONAR aggregates data from hundreds of sources, presenting the data in charts and maps and providing commentary on what freight market experts want to know about the industry in real time.
The FreightWaves data science and product teams are releasing new data sets each week and enhancing the client experience.
To request a SONAR demo, click here.