

Chart of the Week: ACT Research Equipment Orders – Class 8 Trucks, Outbound Tender Reject Index – USA SONAR: ORDERS.CL8, OTRI.USA
Class 8 truck orders are trending lower as national tender rejection rates remain above 25% — a characteristic of an extremely tight freight market. At first glance, it appears that carriers have slowed their efforts adding capacity to the domestic trucking market, even though the data suggests that little has changed in terms of the aggregate need for adding more seated trucks.
Historically speaking, there is little data that would help explain why truck orders are declining in the current environment. The last large-scale capacity crunch that occurred just over two years ago had similar conditions for very different reasons but may offer some insight over what is about to happen next.
National capacity was extremely tight starting in the middle of 2017 and persisted into the back half of 2019. National rejection rates were not quite as high for as long as they have been, but Class 8 orders jumped beyond seasonal expectation in October of 2017, hitting over 28,000 orders versus 9,500 in October of 2016, according to ACT Research.
The current market is similar to the 2017-18 setup in the way that it followed what was considered by many to be a soft demand cycle for freight in 2016. The surprising resurgence of business investment and an active hurricane season pushed capacity to its limits and carriers invested in equipment a few months into the boom.
The same pattern emerged this year, though truck orders came with a little more hesitation. Carriers had just felt the brunt of an oversupplied market in 2019 and probably found it hard to believe an economy with a double-digit unemployment rate was going to sustain such an elevated demand.
Truck orders typically have a seasonality associated with them. On average, the typical peak time for ordering new equipment is around the first and last months of the year. The main reason for this is year-end reinvestment of excess gains after budgets are finalized — a business investment pattern observed in multiple industries.
Some out-of-cycle investment is considered if conditions are supportive. This can be seen in the orders data from the summer of 2018, when orders spiked near 50,000 units in August. Unfortunately for carriers, the market was already turning as tender rejections fell from 26% in late June to 17% through most of August. The current setup looks eerily similar to 2018 and suggests another round of orders later in the year.
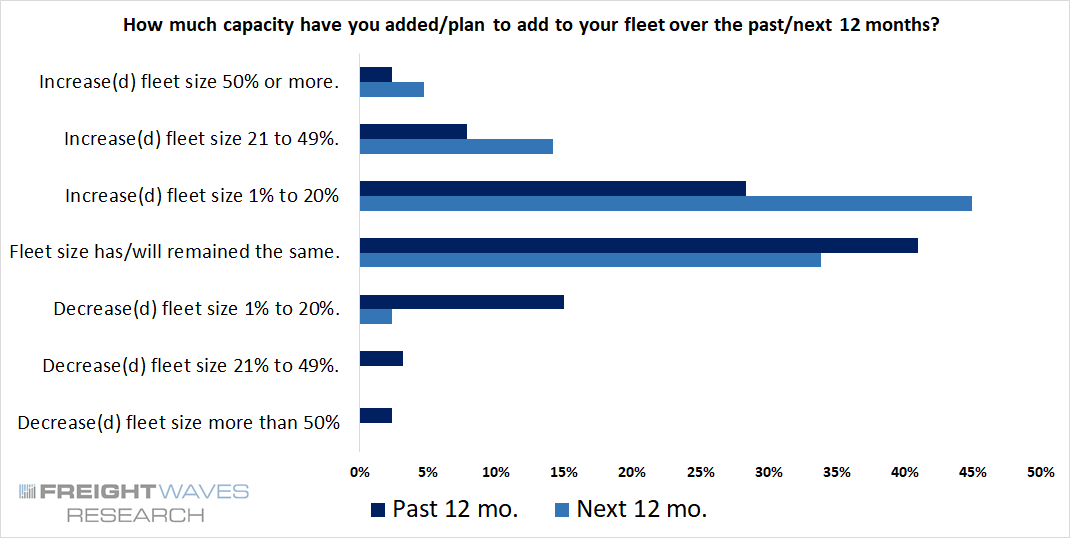
In a recent survey conducted by FreightWaves Research, over 65% of the 126 respondents said they plan to increase their fleet size over the next year, with 40% saying they have already added new equipment since the pandemic began. This data supports the secondary rush of orders theory, but is this the right move?
Looking at the lessons from the 2018 capacity and order data, this is not a good move in general. The capacity glut led to a surge of trucking company failures in 2019 and carrier profit margins compressed once again. But these two periods are not completely comparable.
The orders that have been placed will have longer fulfillment times, thanks to the production and supply chain bottlenecks that just about every OEM is facing.
Driver shortage is not just a generic phrase that describes how difficult it is to hire and keep drivers anymore. The impacts of shuttered driver schools will be felt well beyond 2021 and the stimulus bill may have helped keep the economy revving but it is also slowing people’s return to work — especially potential drivers. The new FMCSA Drug and Alcohol Clearinghouse is also a barrier in place that was not present in 2018.
The employment pressures should ease as the year progresses and the trucks will eventually get made. Will demand continue to support the new equipment or will the trucks arrive just in time to sit against the wall?
About the Chart of the Week
The FreightWaves Chart of the Week is a chart selection from SONAR that provides an interesting data point to describe the state of the freight markets. A chart is chosen from thousands of potential charts on SONAR to help participants visualize the freight market in real time. Each week a Market Expert will post a chart, along with commentary, live on the front page. After that, the Chart of the Week will be archived on FreightWaves.com for future reference.
SONAR aggregates data from hundreds of sources, presenting the data in charts and maps and providing commentary on what freight market experts want to know about the industry in real time.
The FreightWaves data science and product teams are releasing new data sets each week and enhancing the client experience.
To request a SONAR demo, click here.
Supply Chain AI Symposium
Past the hype. Join operators, founders, and enterprise leaders figuring out how to deploy AI in supply chain.
F3: Future of Freight Festival
Industry-defining keynotes, rapid-fire technology demos, and industry leaders networking in experiences across Chattanooga - plus the inaugural F3 Awards Dinner featuring the FreightTech and Shipper of Choice reveals.
Past the hype. Join operators, founders, and enterprise leaders figuring out how to deploy AI in supply chain.
The Old Post • Chicago, IL Register NowIndustry-defining keynotes, rapid-fire technology demos, and industry leaders networking in experiences across Chattanooga - plus the inaugural F3 Awards Dinner featuring the FreightTech and Shipper of Choice reveals.
The Signal at Chattanooga Choo Choo • Chattanooga, TN Register Now
Stephen+Webster
Get rid of E logs and pay all O T R truck drivers a minimum of $23.00 U A per hour plus $3.00 per hour into a medical plan and overtime after 10 hours per day and the truck driver shortage will be gone in 6 months. Force all receiver’s to provide overnight parking with electric plugs or pay $50. Per delivery into a parking fund.
Stephen Webster
Many people said with E-logs receiver’s would need to change or their would be a shortage of trucks in 5 years. It only took 3 years.
witt
Yup ! figured out that brokers and shippers want 30-40 % more trucks than they can fill. The conventual driver management is breaking down because it imposable to truck that way with ELD. All waiting for the O Bidden admin. to turn off the pipe lines and out law diesel trucks. Oh and these these truck are so reliable too, carriers darn near need 1 extra truck in 5 because of the down time.
Mike
I sit so much due to this ELD, I’m honestly too tired to work.