This week’s FreightWaves Supply Chain Pricing Power Index: 40 (Shippers)
Last week’s FreightWaves Supply Chain Pricing Power Index: 45 (Shippers)
Three-month FreightWaves Supply Chain Pricing Power Index Outlook: 40 (Shippers)
The FreightWaves Supply Chain Pricing Power Index uses the analytics and data in FreightWaves SONAR to analyze the market and estimate the negotiating power for rates between shippers and carriers.
This week’s Pricing Power Index is based on the following indicators:
Accepted volumes creep downward, widening the gap with year-ago levels
Like a tortoise, the current decline in freight demand is slow and steady. Excluding holiday-affected weeks, the Outbound Tender Volume Index (OTVI) is at its lowest level since early May. This decline isn’t likely to reverse anytime soon, as the peak season is still a month away from kicking off. To be sure, given retailers’ record levels of inventory, it would be unsurprising if 2022’s peak season was less “peaky” than usual.
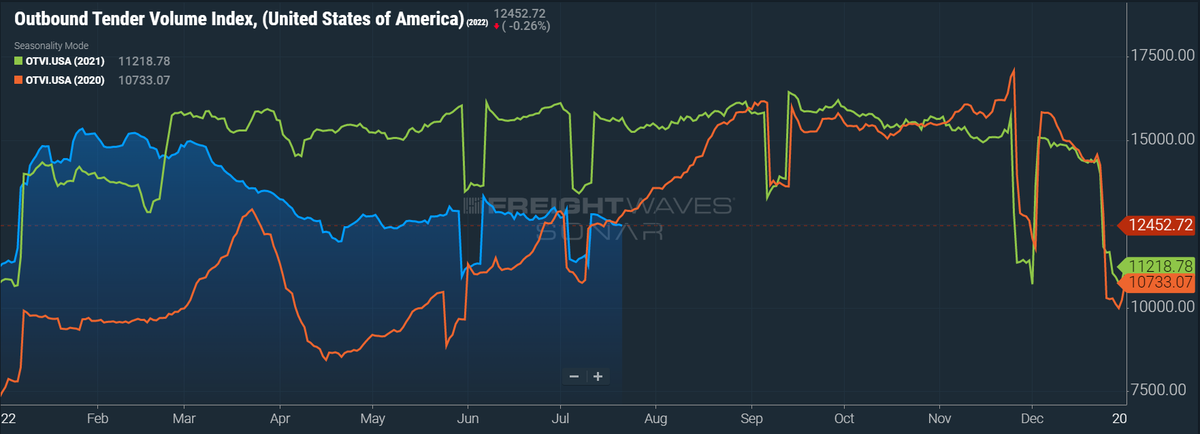
SONAR: OTVI.USA: 2022 (blue), 2021 (green) and 2020 (orange)
To learn more about FreightWaves SONAR, click here.
OTVI fell 2.05% on a week-over-week (w/w) basis as July is typically one of the softer months for freight demand. On a year-over-year (y/y) basis, OTVI is down 19.54%, although y/y comparisons can be colored by significant shifts in tender rejections. OTVI, which includes both accepted and rejected tenders, can be artificially inflated by an uptick in the Outbound Tender Reject Index (OTRI).
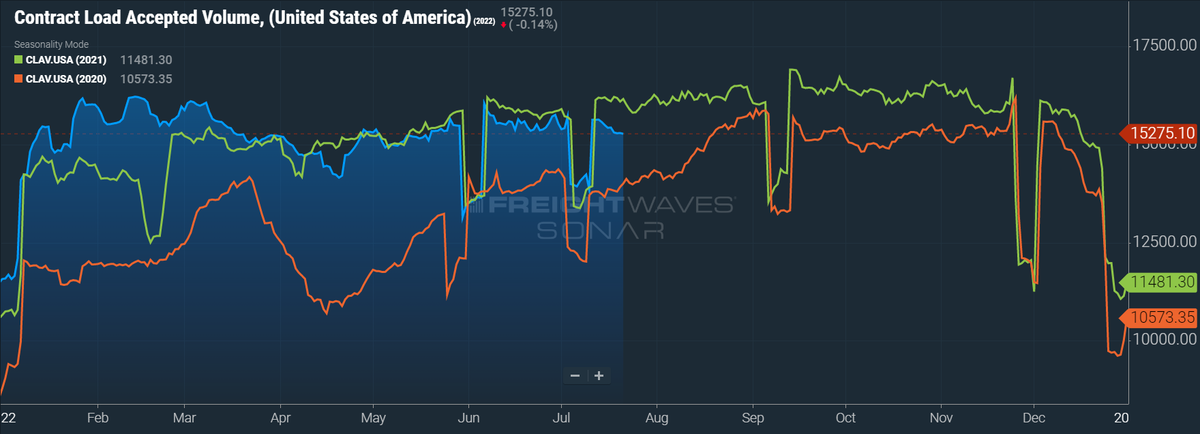
SONAR: CLAV.USA: 2022 (blue), 2021 (green) and 2020 (orange)
To learn more about FreightWaves SONAR, click here.
Contract Load Accepted Volumes (CLAV) is an index that measures accepted load volumes moving under contracted agreements. In short, it is similar to OTVI but without the rejected tenders. Looking at accepted tender volumes, we see not only a dip of 1.95% w/w but also a gap of 5.50% y/y. This y/y difference confirms that actual cracks in freight demand — and not merely OTRI’s y/y decline — are driving OTVI to lower levels.
Import volumes in June posted record numbers for the month, per data from the McCown Report. The level of TEUs at East Coast seaports grew at a faster rate than their West Coast counterparts, with y/y growth of 9.7% and 2.3%, respectively. Of course, this imbalance partially reflects the higher floor at West Coast ports, but the data does confirm that shippers are indeed rerouting many of their imports eastward. Compared to three years ago, before the pandemic, import volumes were up a respective 40.3% and 15.8% at East and West Coast container ports.
But shipments arriving at West Coast ports might have a difficult time reaching their final destination due to the ongoing AB5 protests at the Port of Oakland. Roughly 450 independent truckers marked their resolve to continue protesting until Californian owner-operators receive an exemption from the controversial law, which seeks to reclassify many of them as employees rather than independent contractors. On Wednesday, the port’s largest terminal operator decided to close operations as the protest effectively shut off access to the terminal gates.
On Tuesday, approximately 100 local members of the International Longshore and Warehouse Union (ILWU) refused to cross the protest’s picket line. This decision of solidarity could complicate the ongoing labor negotiations between the ILWU, whose leadership has come out in support of AB5, and the Pacific Maritime Association (PMA). Since the previous labor contract expired July 1, ILWU members are working at West Coast ports without a contract in place. Although both parties have stated they plan to avoid lockouts and slowdowns resulting from stalled negotiations, the possibility still looms.

SONAR: Outbound Tender Volume Index – Two-Week Change (OTVIF).
To learn more about FreightWaves SONAR, click here.
Of the 135 total markets, 56 reported weekly increases, with many of the w/w gains coming from smaller markets.
Freight demand in Ontario, California, the largest market by outbound volume, took a hit earlier this week. The market’s local OTVI is now down 4.72% w/w despite regional gains in reefer volume. This seasonal slowdown is even more pronounced in Atlanta, where freight demand is down 9.03% w/w. On a nationwide level, industrial production has begun to see some declines, which would not only affect volume in manufacturing hubs like Atlanta but also volume for LTL carriers.
By mode: Although down on a weekly basis, reefer volume has been quite stable and relatively strong throughout the week. Of course, given that mid-to-late summer is the beginning of the broad harvest season, this robustness is not entirely surprising. However, reefer’s weak performance in freight’s “produce season,” which begins in April for states like Texas and Florida, did send some alarming signals. Now, however, heavyweights like California are ramping up their produce shipments.
At present, the Reefer Outbound Tender Volume Index (ROTVI) is down a slim 0.59% w/w. Van volumes are a bit worse for wear, with the Van Outbound Tender Volume Index (VOTVI) down 1.23% w/w. Both indices are down significantly on a y/y basis — as VOTVI and ROTVI are down a respective 21.11% and 22.3% — but a large portion of this difference is due to declining tender rejections in both modes.
Rejection rates are limping along, hovering close to 7%
Since July, as has been stated, is typically a softer month for freight volume, rejection rates do tend to ease in this period. But with the economy potentially facing a recession, recent historical trends are not an infallible barometer for present-day movements. Even so, OTRI appears to be coasting just above 7% for now. As more data comes for Q3 contract rates, it is possible we could see further easing in tender rejections. On the flip side, however, a wave of carrier bankruptcies also could rapidly tighten capacity, driving up OTRI from its current floor.

SONAR: OTRI.USA: 2022 (blue), 2021 (orange) and 2020 (green)
To learn more about FreightWaves SONAR, click here.
Over the past two weeks, OTRI, which measures relative capacity in the market, fell to 7.05%, a change of 10 basis points (bps) from the week prior. OTRI is now 1,481 bps below year-ago levels.
While orders for new trailers fell to a year-to-date low, it does not necessarily signal a drop-off in carriers’ demand. In fact, it seems the opposite is true: Manufacturers are swamped with a hefty backlog of orders from previous months, many of which remain unfilled due to material shortages and supply chain disruptions. With the end of managing current fleet commitments, OEMs only partially opened their June orderboards, limiting the amount of new orders they accepted in the month.
Much of this demand for equipment — at least, the demand that will not soon result in canceled orders — likely is held by larger carriers. In a recent string of second-quarter earnings releases, many larger carriers exceeded expectations, but this performance is largely due to their relative insulation from the spot market. Regular readers of this column know well that spot rates and volumes have been on a protracted decline since early March.
Where does that leave smaller fleets, which comprise a vast majority of trucking companies in America? Not in an enviable position. Net motor carrier revocations rose to a decade-long high in May, showing small carriers were already unable to bear rising operational costs amid declining spot rates two months ago. And if we see a greater exodus of small carriers from the industry, it would have ripple effects for the broader economy. Most obviously, capacity would tighten and rates would rise, further aggravating inflationary pressures as higher transportation costs are passed onto the consumer.
But it is probable many independent drivers, who are also getting squeezed by AB5, will be absorbed by larger carriers as they become company truckers. As happens in every market since the Industrial Revolution, further consolidation of supply leads to consolidation of pricing power, assuming demand is not fully destroyed. With fewer competitors, large carriers will have greater freedom to set their rates higher. In the later stages of such an oligopoly, service will be allowed to deteriorate while rates inch ever upward. If this story sounds somewhat familiar, it is because it is playing out on America’s railroads.
Thankfully, trucking does not require such heavy investments in infrastructure as the rail and maritime lanes. The truckload market is incredibly cyclical, and we will probably see a return of independents even if they exit during the downturn. But the bedrock of independent owner-operators will slowly erode and we are unlikely to realize the consequences until it is too late.
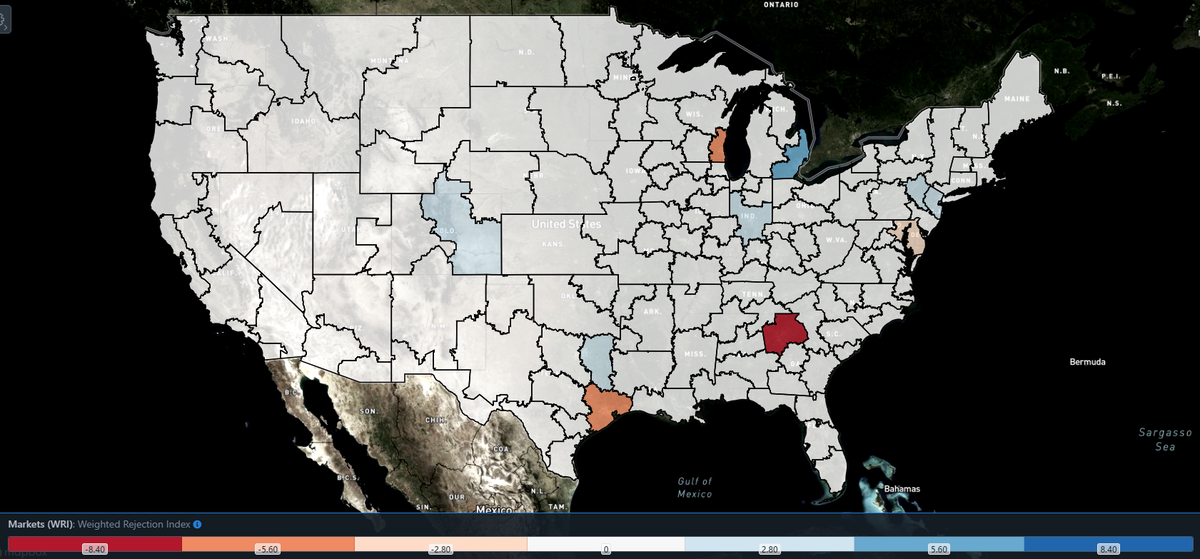
SONAR: WRI (color)
To learn more about FreightWaves SONAR, click here.
The map above shows the Weighted Rejection Index (WRI), the product of the Outbound Tender Reject Index — Weekly Change and Outbound Tender Market Share, as a way to prioritize rejection rate changes. As capacity is generally finding freight, a couple of regions this week posted blue markets, which are the ones to focus on.
Of the 135 markets, 68 reported higher rejection rates over the past week, though 28 of those reported increases of only 100 or fewer bps.
When it comes to tender rejections, Atlanta is certainly the main topic of discussion. In late June, the market’s OTRI quickly spiked by 558 bps over a 10-day period, rising from 7.42% to 13%. Since Atlanta is one of the largest markets by outbound volume, such violent swings are worthy of note, if not a headline. Then, just as suddenly as the surge arrived, it left in dramatic fashion. Atlanta’s OTRI is now down 277 bps to 5.83% — its lowest reading in a dataset that stretches back to 2017.

To learn more about FreightWaves SONAR, click here.
By mode: Flatbed rejection rates are on a similarly volatile downturn. Given that much of flatbeds’ freight comes from construction and the industrial sector, the present fall in the Flatbed Outbound Tender Reject Index (FOTRI) is concerning. Demand for residential construction has dropped off dramatically, as housing starts fell over 13% in the past two months.
Industrial production, while not on as steep a decline, is showing early signs of cooling. Notably, manufacturers are markedly pessimistic about their prospects improving over the next six months: A recent New York Fed survey shows future-looking sentiment among manufacturing firms is now more negative than positive. This negative index reading has only happened twice in the survey’s 12-year history — once after the Sept. 11, 2001, terrorist attacks and twice during the 2008 global recession. Consequently, FOTRI is down 366 bps w/w.
The decline in reefer rejections is not nearly as drastic, with the Reefer Outbound Tender Reject Index (ROTRI) falling 55 bps w/w. Dry van rejection rates, meanwhile, are on the rise: the Van Outbound Tender Reject Index (VOTRI) is up 11 bps w/w. This gain is not quite worthy of a ticker-tape parade, but good news is good news nonetheless.
Contract rates edge downward, foreshadowing further Q3 declines
Since the pandemic started, many shippers found their existing contracts unable to ensure carrier compliance. Supply and demand were especially volatile, and so spot rates, which are more sensitive to changing market conditions, handily outpaced contract rates. In response, shippers began to shorten their contract bid cycles from a yearly basis to a quarterly or even monthly one, so as to keep prices current and keep carriers moving their loads.
But the spot market’s sensitivity to a volatile market is a double-edged sword: As the market started to deteriorate in March, spot rates immediately followed suit. By the time Q2 renegotiations ended, contract rates already were set at a fairly high price, likely because shippers were wary of getting burned again and because the gravity of the market downturn was not fully known then. For large carriers especially (see above), the contract space was a safe haven from broader rate declines.
For Q3, I predicted shippers would exercise their increased pricing power to drive down contract rates, which recent survey results further supported. Since contract rates are reported on a two-week delay, it is still far too early to draw conclusions. But the current data suggests contract rates are due for a sizable decline throughout this quarter.
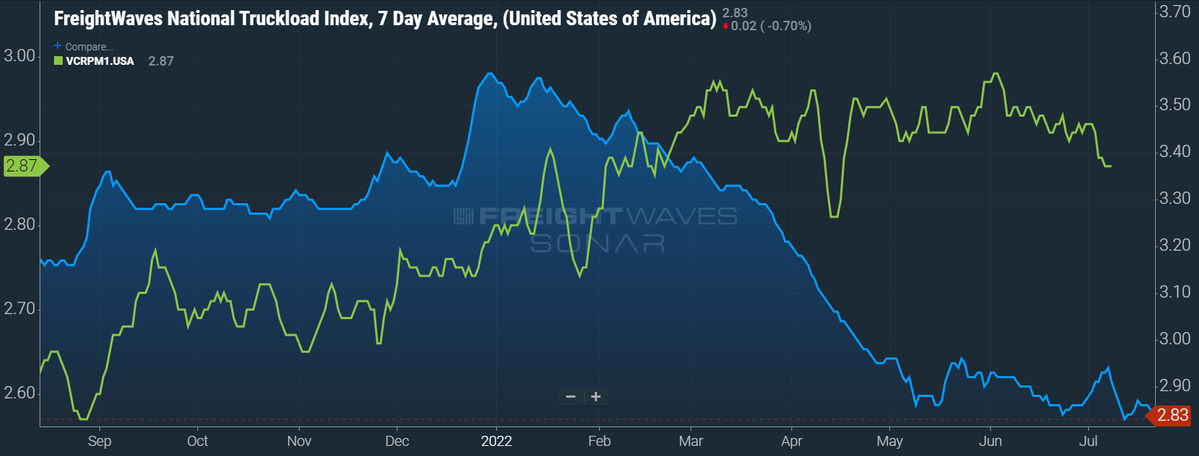
SONAR: National Truckload Index, 7-day average (blue; right axis) and dry van contract rate (green; left axis).
To learn more about FreightWaves SONAR, click here.
Contract rates, which are base linehaul rates, fell 5 cents per mile w/w to $2.87. The magnitude of this decline is not significant by itself, as contract rates often rise and fall by a couple of cents per mile. This decline, however, occurred over the Fourth of July holiday week. It is both a historical trend, as well as common sense, that rates increase during holidays: The ailing National Truckload Index (NTI), for comparison, rose 3 cents per mile w/w to $2.91 per mile over that same period, peaking at $2.94 on July 7.
I will repeat it is still far too early to draw any conclusions about contract rates’ trend for the coming months. But we do have a well-reasoned hypothesis supported both by preliminary rate data and opinions of shippers themselves. If contract rates are heading where I think they’re heading, large carriers will not find their Q3 earnings reports as favorable as they did in Q2.
Turning now to spot rates, the NTI had a relatively uninteresting week. After making and holding slight gains early in the week, the NTI has since slid 1 cent per mile w/w to $2.83. The NTIL, which is the linehaul rate that removes fuel from the all-in NTI, is actually up 1 cent per mile w/w at $1.98, showing the NTI’s movement is driven by falling prices of diesel fuel.

To learn more about FreightWaves SONAR, click here.
The chart above shows the spread between the NTIL and dry van contract rates. With the recent decline in contract rates, the spread is now narrowing. Even so, contract rates have quite a bit to fall before they catch up to decaying spot rates. While I do not foresee contract rates dropping below linehaul spot rates before Q1 2023 (at the earliest), shippers might be especially aggressive in their Q4 renegotiations. Since capacity is an ultimate concern during the holiday season, however, they might wait until the quieter months of January before fully baring their teeth.
To learn more about FreightWaves TRAC, click here.
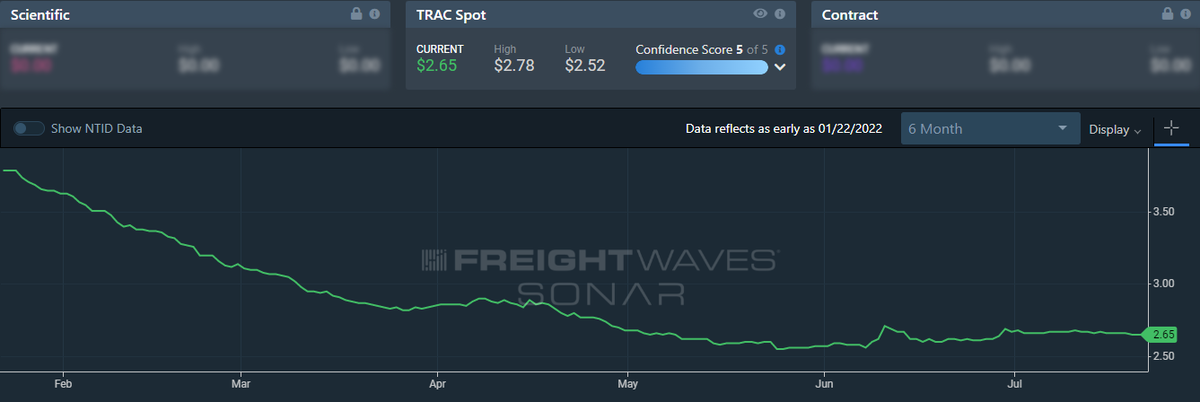
The FreightWaves TRAC spot rate from Los Angeles to Dallas, arguably one of the densest freight lanes in the country, finally declined after weeks of stagnation. Over the past week, the TRAC rate fell 2 cents per mile to $2.65. Compared to the NTID, or the National Truckload Index — Daily, rates from Los Angeles to Dallas are lower than the national average, but that was not the case at the start of the year. When carriers flooded Southern California back in January, they pushed down spot rates rapidly. Depending on how AB5 affects capacity, however, rates may yet go up in the not-so-distant future.
To learn more about FreightWaves TRAC, click here.
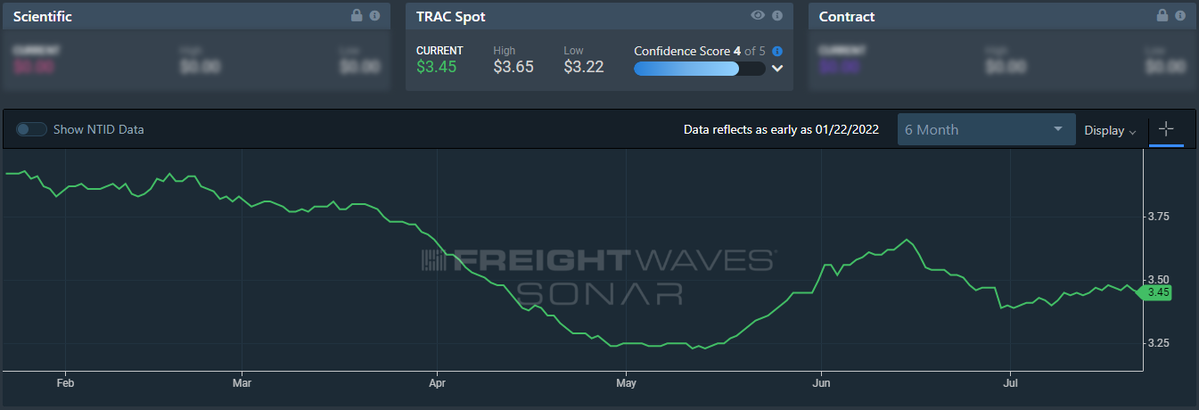
On the East Coast, especially out of Atlanta, rates are likewise declining but still beating the daily NTI. The FreightWaves TRAC rate from Atlanta to Philadelphia fell 2 cents per mile this week to reach $3.47. Now that diesel prices have stabilized in the Northeast and Philadelphia is posting higher volume, carriers are less reluctant to head north out of the busy Atlanta market.
For more information on the FreightWaves Passport, please contact Kevin Hill at khill@www.freightwaves.com, Tony Mulvey at tmulvey@www.freightwaves.com or Michael Rudolph at mrudolph@www.freightwaves.com.

Stephen Webster
Rates are the same as 2 yrs ago after higher fuel and toll costs on inbound loads from the U S . Many owners ops will be out of business by Dec or trucks parked again. We need min freight rates and min wage rates or truck lease ops will go to other types of work like in construction or medical cleanup