
Contract load volumes and rates are outperforming last year’s levels
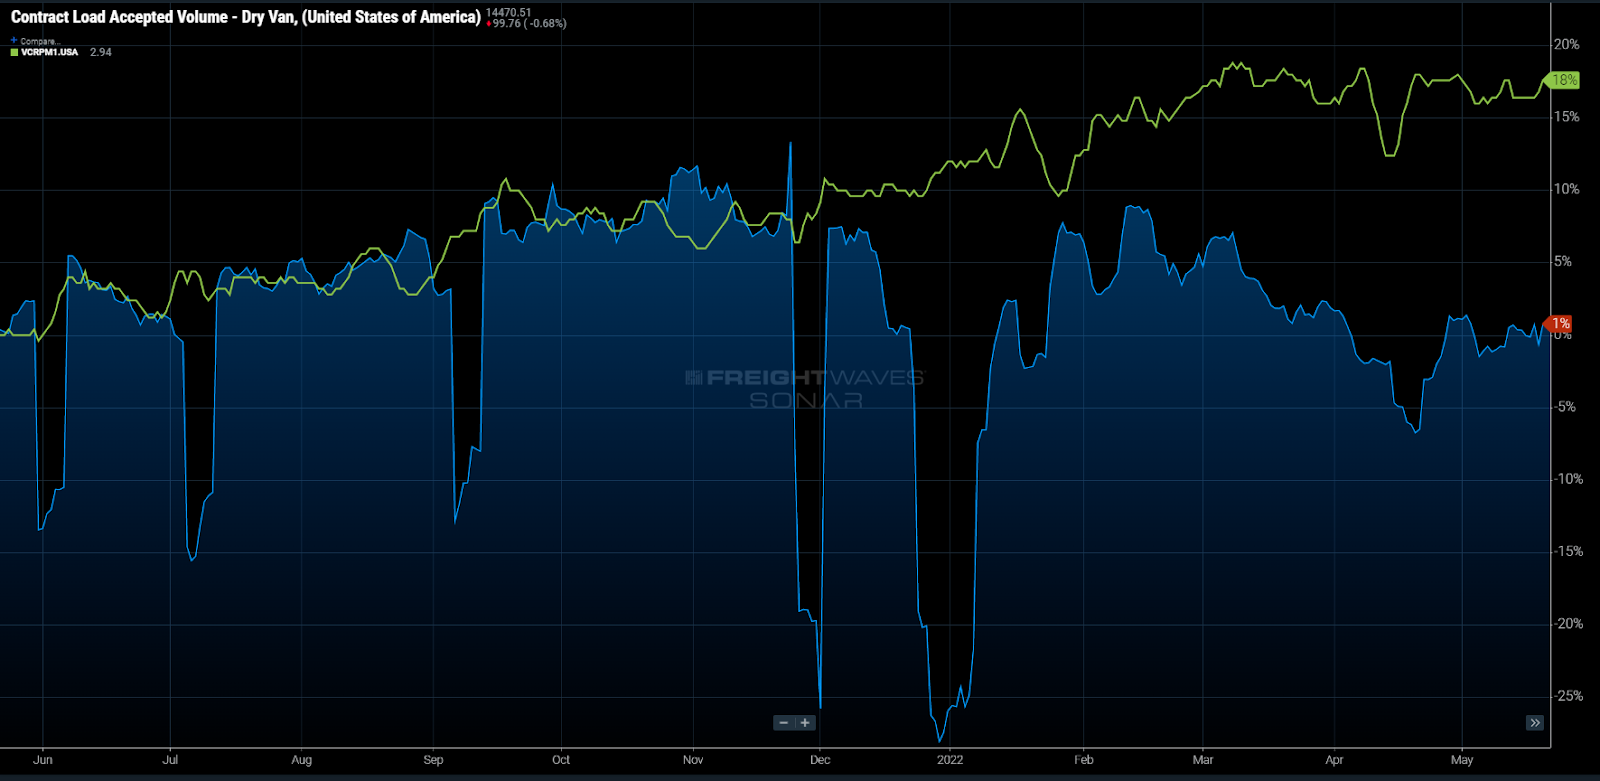
Chart of the Week: Contract Load Acceptance Volume, Contract Base Rate per Mile Initial Report, Dry Van – USA, SONAR: CLAVV.USA, VCRPM1.USA
Carriers that move mostly contracted freight (not the spot market) may be having a better year this year than through the first five months of 2021. According to FreightWaves’ proprietary contract rate per mile index, long-term rates for standard van freight have increased roughly 18% since this time last year, while accepted load volumes for van freight (CLAVV) are actually 1% higher. Does this mean we should cancel the alarm on the freight recession?
In previous articles, FreightWaves has mentioned that the freight market is slowing rapidly. This is largely due to the rapid deterioration of spot and tender rejection rates. In most instances, these are leading indicators for contracted freight rates and volumes, which account for the bulk of the freight moved domestically.
If you think about available trucking capacity as a cup and the demand for that capacity as the water, the cup was overflowing like a geyser from August of 2020 till March of this year. Currently, there is still an overflow, but it looks more like someone just forgot to turn the faucet off.
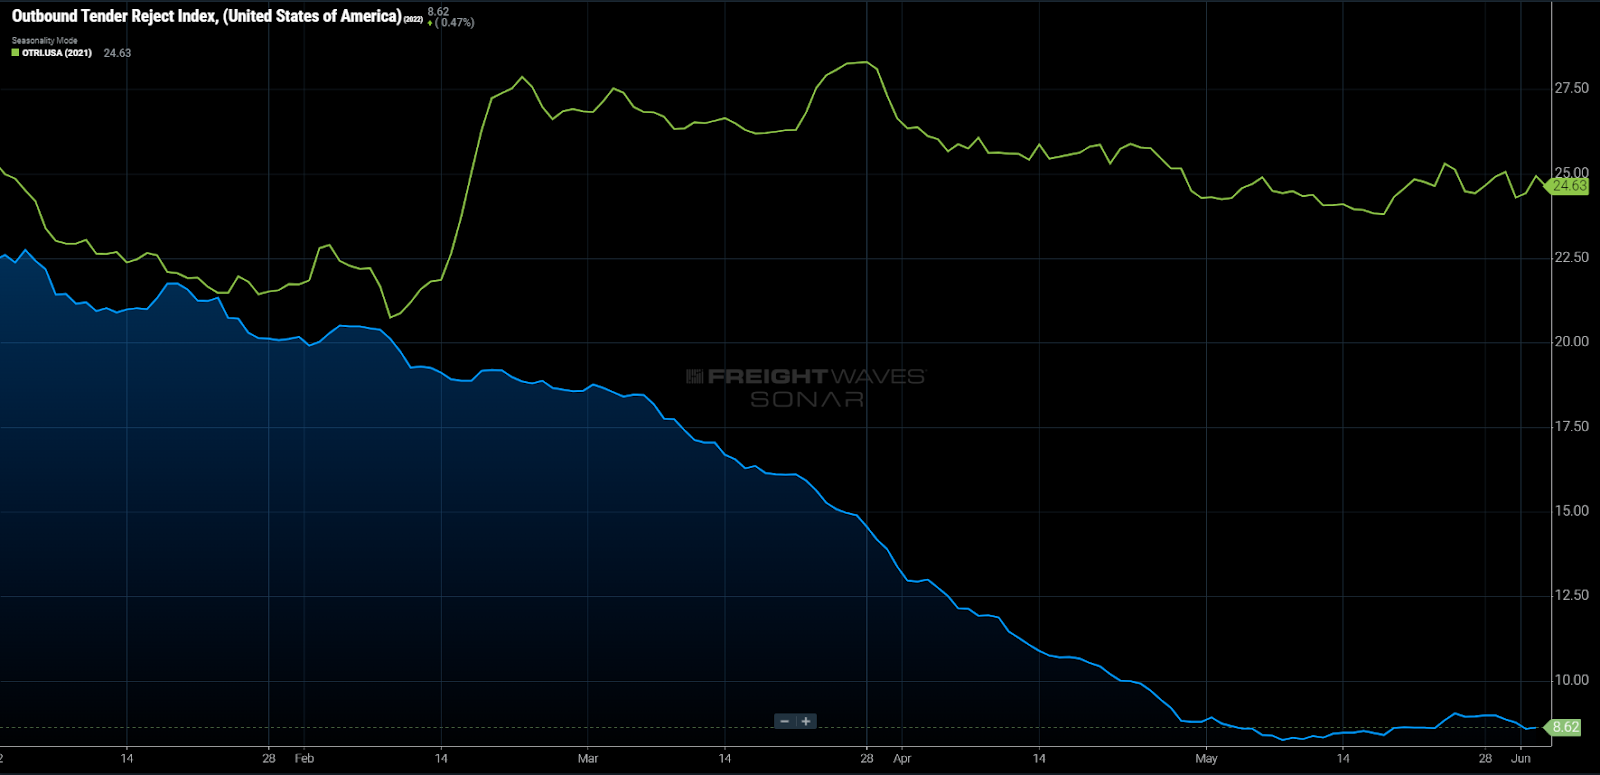
Tender rejection rates are essentially a measure of this overflow of truckload demand. The higher these rates go, the stronger the flow of water from the cup. National rejection rates (OTRI) averaged above 20% throughout 2021 and now they are just below 9%. So at what level do we start to see contract freight deterioration?
Larger fleets tend to be more heavily contracted than the smaller operations and reports have validated that they have not seen significant erosion in their business — something market reporter Todd Maiden wrote about in the middle of May.
The Contract Load Accepted Volumes Index for van loads (CLAVV) measures only accepted load volumes for contracted freight. This index did show some year-over-year declines in April, but a large portion of this was due to the timing of Easter and it has since recovered to break-even levels.
Even if contracted volumes were to drop into negative growth territory as they did in April, the freight is moving at a 10-15% higher base rate than last year. This hedges the carriers from any strong hits to revenue growth.
Fuel costs are also passed along much more efficiently in the contracted market due to the fact they are managed by fuel surcharge tables. These tables help carriers pass along any excessive fuel costs to their customers. This is much more difficult to manage in a deteriorating spot market, where carriers are openly bidding with all-inclusive rates to win the business.
Spot rates and rejection rates have stagnated over the past month, indicating we may have hit a floor for the moment. If this holds, the contract heavy carriers should report another strong quarter.
Essentially, demand has not yet eroded to the point where many large fleets have felt a strong hit to their bottom line. The near-term outlook appears to be relatively favorable thanks to a decent seasonal outlook and a still resilient consumer. It does not take an economist to know this level of inflation is unsustainable, however, and the signs are there for further demand side erosions in the long term. A dip in contract load acceptances will be the first sign.
About the Chart of the Week
The FreightWaves Chart of the Week is a chart selection from SONAR that provides an interesting data point to describe the state of the freight markets. A chart is chosen from thousands of potential charts on SONAR to help participants visualize the freight market in real time. Each week a Market Expert will post a chart, along with commentary, live on the front page. After that, the Chart of the Week will be archived on FreightWaves.com for future reference.
SONAR aggregates data from hundreds of sources, presenting the data in charts and maps and providing commentary on what freight market experts want to know about the industry in real time.
The FreightWaves data science and product teams are releasing new datasets each week and enhancing the client experience.
To request a SONAR demo, click here.
Freight Fraud Symposium
Double brokering. AI deepfakes. Identity theft. Freight fraud is an existential threat to the industry. Get ahead of it.
Supply Chain AI Symposium
Past the hype. Join operators, founders, and enterprise leaders figuring out how to deploy AI in supply chain.
Future of Rail Symposium
Reshoring is rewriting freight demand. Join shippers, rail executives, and government officials to shape the next decade.
Double brokering. AI deepfakes. Identity theft. Freight fraud is an existential threat to the industry. Get ahead of it.
Rock & Roll Hall of Fame • Cleveland, OH Register NowPast the hype. Join operators, founders, and enterprise leaders figuring out how to deploy AI in supply chain.
The Old Post Office • Chicago, IL Register NowReshoring is rewriting freight demand. Join shippers, rail executives, and government officials to shape the next decade.
The Signal at Chattanooga Choo Choo • Chattanooga, TN Register Now