
The Panama Canal debuted a $5-billion-plus set of larger locks in 2016, only months before a trade war broke out between the U.S. and China — the waterway’s two largest transit sources. The canal, which relies on water availability, suffered one its worst droughts ever in 2019. And then came the coronavirus. Carriers slashed Asia-East Coast services transiting the canal in the second quarter of 2020. In the third quarter, U.S. importers flocked to Asia-West Coast services boasting faster transit times.
And yet, despite all of this, the canal is not in crisis mode. Far from it. Overall cargo volumes are increasing as gains in some segments offset declines in others.
To see how the Panama Canal Authority (ACP) navigated COVID, drought and the trade war, FreightWaves analyzed transit statistics — including those not openly available to the public — and interviewed Silvia de Marucci, the executive manager of the ACP’s division of economic analysis and market research.
“We continue to grow,” affirmed De Marucci. “Even in a pandemic. And that is very reassuring.”
It’s also a very reassuring signal on U.S. consumer demand. Cargo volumes are now flooding into West Coast ports. But according to De Marucci, West Coast flows are not stealing volume away from the Asia-East Coast route. They’re in addition to rising volumes taking the longer route through the canal.
Container fallout from COVID
The ACP fiscal year runs from Oct. 1 to Sept. 30. The ACP reported earlier this month that FY 2020 oceangoing cargo mass totaled 255.77 million long tons (1 long ton = 2,240 pounds). That was up 1.1% year-on-year despite the pandemic.

Oceangoing traffic measured in Panama Canal Universal Measurement System (PC/UMS) tons — which assess capacity — rose 1.2% year-on-year to 474.46 million PC/UMS.
Looking only at the container sector, cargo slipped 1.5% to 56.14 million long tons. However, billed capacity reached an all-time high of 17 million twenty-foot equivalent units (TEUs). That was up 1.7% year-on-year and up 40% since FY 2015, the fiscal year prior to the opening of the larger locks.
“The coronavirus started affecting the Panama Canal in April,” De Marucci told FreightWaves. “Our April volumes started to fall, especially in containerized cargo and LNG [liquefied natural gas], passenger vessels [cruise ships] and vehicle carriers. Those four markets were hit the hardest.
“We probably saw a decline in containers of around 6% in April. Then around 12% in May and 13-16% in June. But after that, volumes began to grow and started to recover. We ended up very close to our budget,” she reported. She also pointed out that a very strong start of the fiscal year in late 2019 and early 2020 helped the final FY 2020 tally.
“The first half of the [fiscal] year was off the chart, which mitigated a lot of declines we saw in the next months. We ended up below our budget [for containers] but that’s just because we had really positive expectations. We’re not unhappy. Given the uncertainty and the lousy year, we did well.”
Boxes surge into West Coast
Asked about the surge of containers into the West Coast ports and whether this is coming at the expense of canal traffic, she maintained that it was not.

“We have seen the surge in the West Coast, but we haven’t seen a decline to the East Coast ports. As far as we’re concerned, the volumes are still moving through the Panama Canal, especially in September and this month. We’ve even seen extra loaders in addition to the regular rotations,” she reported. Extra loaders are extra voyages liner companies add to cover excess demand.
While the ACP did not provide FreightWaves with monthly container-only long-ton data (despite several requests), the cargo trend can be inferred by comparing monthly stats for the Panamax locks to stats for the larger Neopanamax locks that opened for business in May 2016.
Container ships accounted for 43% of Neopanamax locks transits in FY 2020, versus just 13% of Panamax locks transits. The smaller Panamax locks are much more focused on dry bulk (27% of transits in FY 2020) and small tankers (29% of transits) that predominantly carry refined products.
Monthly tonnage through the Neopanamax locks plunged in May and June, as would be expected given how liners “blanked” (canceled) sailings during this period. Volumes then rebounded, matching last year’s levels in August and actually topping last year’s levels in September. More positive evidence for containers: The Neopanamax cargo levels recovered in those months even as LNG volumes — which also use those locks — did not.

In contrast, the monthly tonnage via the Panamax locks hasn’t recovered. This implies that the container flows are doing better than dry and wet bulk in the most recent months.

Putting canal volumes in context
From a global trade perspective, the key Panama Canal metric is cargo tonnage, not ship capacity or the number of transits. Looking at this data over the long term puts the waterway’s role in context and clears up several misconceptions.
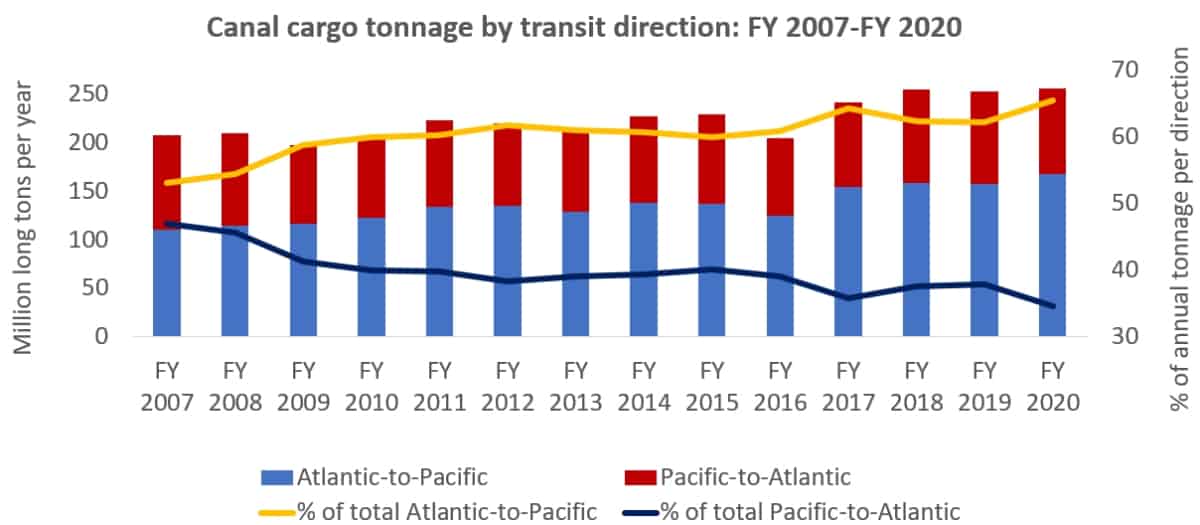
One misconception is that the most important ocean trade through the waterway is container cargo and another is that the most important direction of canal trade is from the Pacific to Atlantic. Wrong on both counts.
In FY 2020, 65% of the volume (or technically: cargo mass/weight) went from the Atlantic-to-Pacific. Back in FY 2007, volumes were much more balanced, at 53% Atlantic-to-Pacific, 47% Pacific-to-Atlantic.
The reason for the direction is that dry and liquid bulk represent a much higher percentage of total cargo than containerized volumes. Bulk volumes are fueled by dry cargo, led by soybeans shipped from the U.S. Gulf to Asia; gasoline and diesel going from the Gulf to the Pacific coast of South America, Mexico and the U.S. West Coast; and, since the opening of the Neopanamax locks, LNG and liquefied petroleum gas (LPG) from the U.S. to Asia.
In fact, container cargo tonnage accounted for just 22% of total transiting cargo tonnage in FY 2020, down from 29% in 2008 (there was a big interim dip in 2014-2015 caused by a combination of pre-locks-expansion container weakness and a major jump in non-containerized cargo due to bountiful U.S. crops).

Longer-term trends
One might assume that transiting container cargo would have increased over the past decade and a half, but it hasn’t.
FY 2020 container tonnage of 56.14 million long tons is down 7% versus the pre-financial-crisis FY 2008 total of 60.17 million long tons. Curiously, TEU capacity of transiting ships increased 36% over the same 13-year period.

The average mass per TEU changes over time. But the more likely driver of the disparity is more empty slots aboard transiting ships. For containers, Pacific-to-Atlantic volumes increasingly outpace those in the other direction (the reverse of the trend in overall canal volumes).
On a highly positive note, container cargo is way up following the launch of the Neopanamax locks.
The older locks allow passage of box ships with a maximum capacity of around 4,500 TEUs; the Neopanamax locks, up to around 15,000 TEUs. Given the rapidly escalating size of the world’s container ships over the past decade, Panama’s decision to build expanded locks was essential for it to remain relevant. Prior to the debut of the Neopanamax locks, Panama was losing traffic to the Suez Canal and other routes.
Total container cargo tonnage in FY 2020 is up a massive 44% versus FY 2015 (pre-locks-expansion). This has occurred despite a significant amount of cannibalization as container traffic has rapidly jumped ship from the Panamax to the Neopanamax locks.
Panamax vs. Neopanamax volumes
In FY 2020, 80% of container cargo tonnage transited the new locks. That was up from 64% in FY 2017, the first full fiscal year after the Neopanamax locks opened.

Looking at cargo tonnage for all ships by lock type underscores just how diverse the waterway’s cargo services are. Flows through the Neopanamax locks still only represented 36% of total cargo movements in FY 2020.

According to De Marucci, “When we planned this expansion, we had projections on how we wanted to grow and what we were expecting to happen. In terms of expectations, the Panamax locks are actually doing better than expected.
“We thought of the cannibalization of the Panamax [traffic] in favor of the Neopanamax, and that has happened to a large extent [in containers], but it has not destroyed the demand for the Panamax locks, which I think is very positive. Our Panamax locks are not unused. On the contrary. There is still strong traffic through them.
“In the Neopanamax locks, we have seen the growth of container vessels, which was what we expected. But we did not expect the [Neopanamax] interest from other segments to grow so quickly,” she said, referring to LPG and, before the coronavirus pullback, LNG.
Growth ahead and next steps
What happens with container volumes in the near term will likely hinge on U.S. federal stimulus, which could in turn hinge on November’s elections.
LNG transits depend upon U.S. Gulf exports to Asia. There’s hope that these volumes will recover this winter. But this hasn’t happened yet. According to data from Argus Media, monthly U.S. export volumes were in the range of 11-12 million cubic meters during the first quarter. In contrast, volumes are averaging around 5 million cubic meters per month since June. This month’s numbers remain very weak, at an estimated 4.2 million cubic meters.

“We’re still cautious on LNG but we do think this year [FY 2021] will be better than last year,” said De Marucci.
Meanwhile, LPG transits have remained strong throughout the crisis period and are expected to continue to perform well. “We see prices in the U.S. are very competitive for the Asian market. There has been high demand [for LPG] and we think that will probably continue into 2021,” she said.
In the bulk sector, the main negative in FY 2020 was a drop in coal. According to Marucci, “We don’t expect coal to be a major driver — it’s on the way out and being replaced by natural gas. But we do see potential growth for grain cargoes, depending on the negotiations between the U.S. and China.”
Already, U.S. soybean sales to China are accelerating. “They [the Chinese] have been buying and we have been seeing these shipments coming through the canal,” De Marucci said.
Lost soybean volumes have been the largest consequence of the U.S.-China trade war, she said. On the container side, “we haven’t seen much of any impact,” she asserted.
Nor did she report any material volume effects from the 2019 drought. “To be honest the number of ships that actually need a 50-foot draft is minimal,” she said.
The ACP is addressing the long-term issue of water resources by putting a water-management system project out for bid. With an estimated price tag of $2 billion, it will be far the largest infrastructure project for the canal since the Neopanamax locks.
Add everything up that the Panama Canal has faced over recent years and the curse “may you live in interesting times” comes to mind. Yet despite all the headwinds, De Marucci sounded upbeat. “We are in a good place right now,” she maintained. Click for more FreightWaves/American Shipper articles by Greg Miller
MORE ON CORONAVIRUS FALLOUT: U.S. import bonanza could extend into 2021 on ‘record’ restocking: see story here. What trade war? U.S. imports from China are booming: see story here. Need for speed driving ships toward West Coast ports: see story here.
