
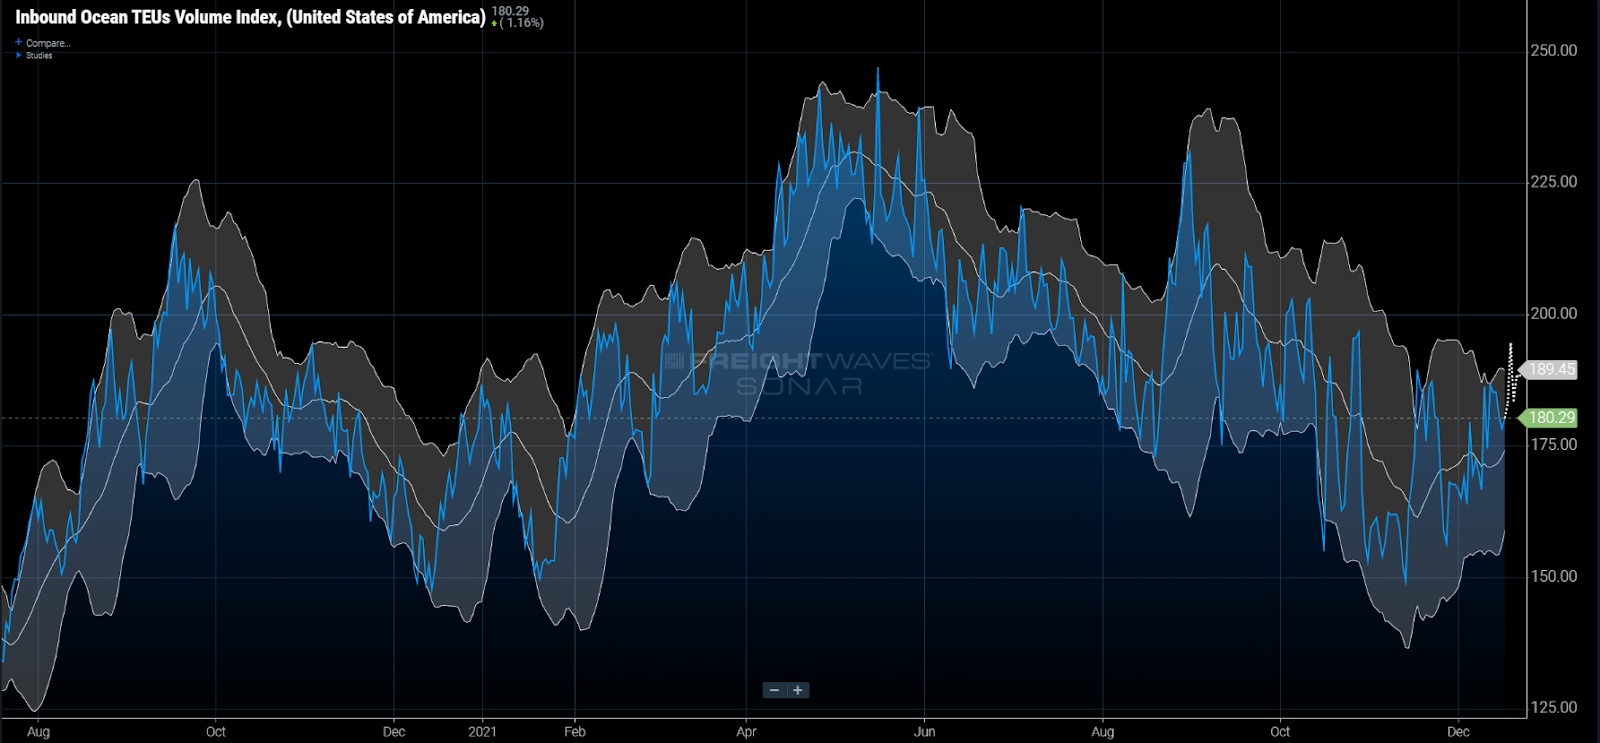
Chart of the Week: Inbound Ocean TEUs Volume Index – USA SONAR: IOTI.USA
The Inbound Ocean TEUs Volume Index (IOTI) measures bookings or shipping orders for twenty-foot equivalent units by estimated time of departure from the ports of origin on a daily basis. This index is a leading indicator of domestic shipping and warehousing activity. Over the past four months, the index’s high and low ranges have become much wider as importers struggle to navigate supply chain delays and ensure inventory will be available for future demand.
The IOTI is an index with a base value of 100 set to a start date of Jan. 1, 2019. The Dec. 17 value of 180 indicates that there were 80% more TEUs of freight being ordered to ship across the ocean into the U.S. on that date versus New Year’s Day of 2019.
Keep in mind that this is actually a busy time for international shipping as China and many other Asian countries do not celebrate the new year until several weeks later. The 80% increase is not in comparison to a holiday or period of subdued activity. The traditional low point of booking activity occurs around the Lunar New Year, which typically occurs in late January or early February.
To put this in perspective, the index fluctuated between a value of 70 and 130 throughout all of 2019. Since Aug. 30, the IOTI has hit a high of 230 and a low of 149. Just looking at a straight range is not a full explanation of how volatile ordering activity has become for importers.
Variance is a difficult measurement to explain concisely without some statistical education. It is far easier to explain visually. The lines and shading around the IOTI are Bollinger Bands. They are traditionally used in technical analysis for charting stock movements. The wider the band, the more volatile the movement.
The upper end of the band represents a value to standard deviations above the mean, while the lower end represents two standard deviations below the mean — in this case a 20-day moving average of the IOTI. All you need to know is that this range has expanded by approximately 250% since early August and has shrunk marginally in December.
The biggest question on any company’s executive team’s mind at this point is what does 2022 look like? Looking at the import behavior it is clear that no one has a good sense of that. In year’s past the aggregate ordering activity was a good predictor of upcoming demand as companies could rely on seasonal patterns and marketing efforts.

This past year, consumers shocked many by spending more than they did in the first quarter than in the second half of 2020. The industrial sector came roaring back this spring, which added to the backlog of orders. The services sector recovered off 2020 low points, which helped put more money in the system. Scarcity of resources fueled the increasing sense of urgency shippers felt to overorder to ensure inventory and products were available. It is difficult to apply any of this activity forward.
Inflation has not stunted the consumer yet, but it is an inevitability at this rate as it outpaces wage growth. “There is the possibility that demand wanes just enough to ease some of the pressure on prices,” according to FreightWaves Lead Economist Anthony Smith. This would mean a soft landing for this economic cycle.
The IOTI suggests companies are still undecided on what happens next. One thing that is clear is the fact that inventory management will continue to be one of the more challenging aspects of managing the supply chain in 2022, regardless of the economic direction.
About the Chart of the Week
The FreightWaves Chart of the Week is a chart selection from SONAR that provides an interesting data point to describe the state of the freight markets. A chart is chosen from thousands of potential charts on SONAR to help participants visualize the freight market in real time. Each week a Market Expert will post a chart, along with commentary, live on the front page. After that, the Chart of the Week will be archived on FreightWaves.com for future reference.
SONAR aggregates data from hundreds of sources, presenting the data in charts and maps and providing commentary on what freight market experts want to know about the industry in real time.
The FreightWaves data science and product teams are releasing new data sets each week and enhancing the client experience.
To request a SONAR demo, click here.
Supply Chain AI Symposium
Past the hype. Join operators, founders, and enterprise leaders figuring out how to deploy AI in supply chain.
F3: Future of Freight Festival
Industry-defining keynotes, rapid-fire technology demos, and industry leaders networking in experiences across Chattanooga - plus the inaugural F3 Awards Dinner featuring the FreightTech and Shipper of Choice reveals.
Past the hype. Join operators, founders, and enterprise leaders figuring out how to deploy AI in supply chain.
The Old Post • Chicago, IL Register NowIndustry-defining keynotes, rapid-fire technology demos, and industry leaders networking in experiences across Chattanooga - plus the inaugural F3 Awards Dinner featuring the FreightTech and Shipper of Choice reveals.
The Signal at Chattanooga Choo Choo • Chattanooga, TN Register Now