
Intermodal provides low-cost storage option for shippers

Chart of the Week: Loaded Rail Container Volume, Outbound Tender Volume Index – USA SONAR: ORAILL.USA, OTVI.USA
Time has been of the essence over the past year as demand for goods outstripped supply, forcing shippers to order more than they needed. Now that consumer demand is waning, companies find themselves with more inventory than they can handle. The national Outbound Tender Volume Index (OTVI) has dropped 12% over the past year and 14% over the past month while loaded intermodal volumes (ORAILL) are trending higher. Could shippers be using the bottlenecks around ports and railheads and a slower transit time from intermodal to decrease their inventory costs?
There is no denying that intermodal is not experiencing the same decline in demand as its truckload counterpart. Even though these two modes tend to move in relative sync with each other, that has not been the case for most of the past year.
Weekly loaded intermodal volumes dropped roughly 8% from May 23 to the end of August while trucking tender volumes were relatively flat. Although much of this decline in demand had to do with overall service, it did not necessarily have to do with the transportation on the rails.
In July, Union Pacific shut down service from Los Angeles to Chicago due to container congestion around the rail ramps and yards. Drayage service and equipment shortages were cited as driving factors. Many shippers shifted to truckload to get orders in a more timely manner. Inventory levels were still low relative to demand at this time.

In February, the Logistics Managers’ Index (LMI) reported record inventory growth. While there have not been many macroeconomic figures to support a severe dip in consumer demand just yet, it has been widely discussed that shippers have been ordering more than they need for the past several months thanks to uncertainty around production and capacity. The uptick in the LMI is indicative of strong demand side easing as there has been no real change in ordering behavior.

The cost of holding inventory has been on the rise as well, according to the LMI, with the inventory cost figure showing a value of 75 or higher (extreme expansion) since January of last year.
Ironically, the things that have hurt intermodal over the past year, congestion and slower service, are now becoming its biggest values. Intermodal containers are essentially movable storage as they can be easily loaded and offloaded from the rails or onto trucks. They can also serve as temporary storage without needing a warehouse.
The recent decline in truckload demand is more indicative of a decline in the sense of urgency for goods transportation as the upstream modes of maritime and rail transportation have not seen the same level of a slowdown.
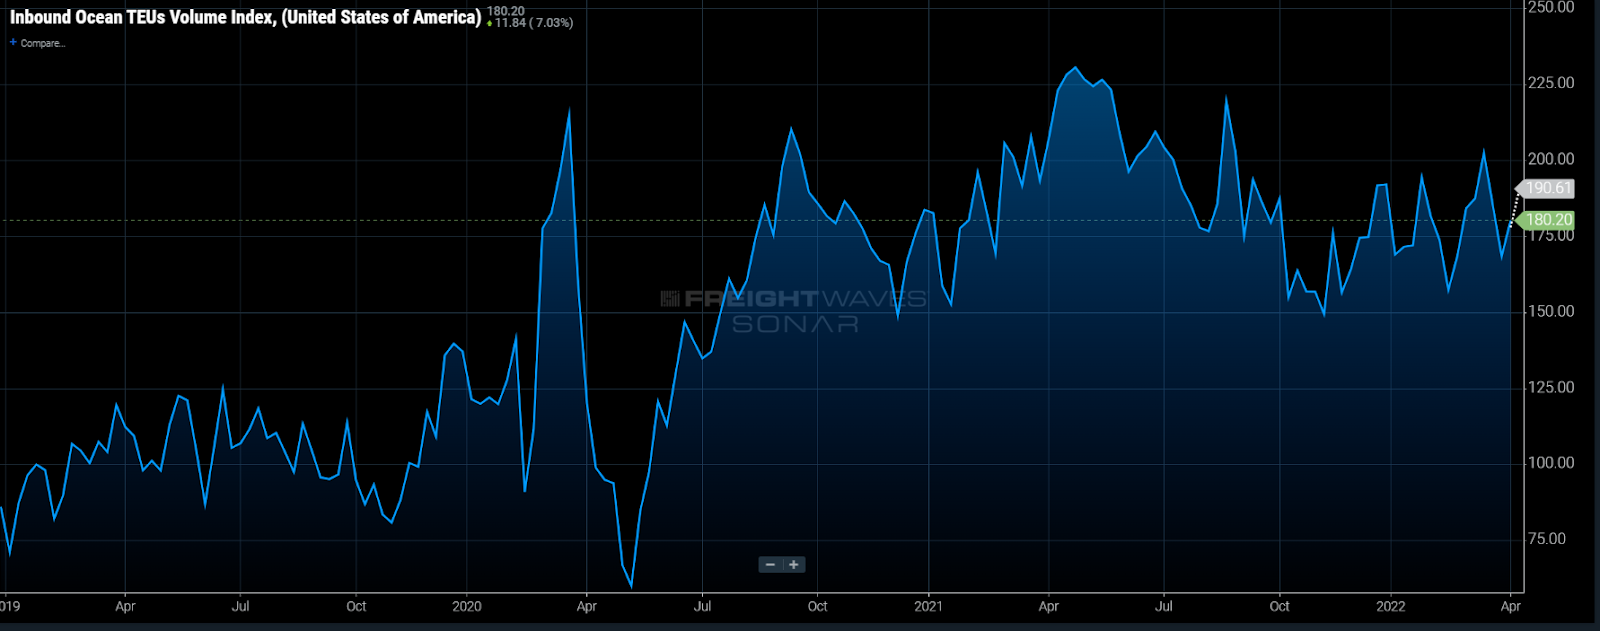
The Inbound Ocean TEUs Index that measures bookings of twenty-foot equivalent unit containers moving into the U.S. has not shown much indication of slowing. There are still many questions around China and its reliability in the wake of the zero-COVID policy, which puts the supply of goods in question.
Essentially, shippers are still not quite ready to relax on ordering for the future while current demand eases. Inventory management is the next big hurdle to overcome in the supply chain.
About the Chart of the Week
The FreightWaves Chart of the Week is a chart selection from SONAR that provides an interesting data point to describe the state of the freight markets. A chart is chosen from thousands of potential charts on SONAR to help participants visualize the freight market in real time. Each week a Market Expert will post a chart, along with commentary, live on the front page. After that, the Chart of the Week will be archived on FreightWaves.com for future reference.
SONAR aggregates data from hundreds of sources, presenting the data in charts and maps and providing commentary on what freight market experts want to know about the industry in real time.
The FreightWaves data science and product teams are releasing new datasets each week and enhancing the client experience.
To request a SONAR demo, click here.