
Freight demand plummets at fastest pace since December 2020
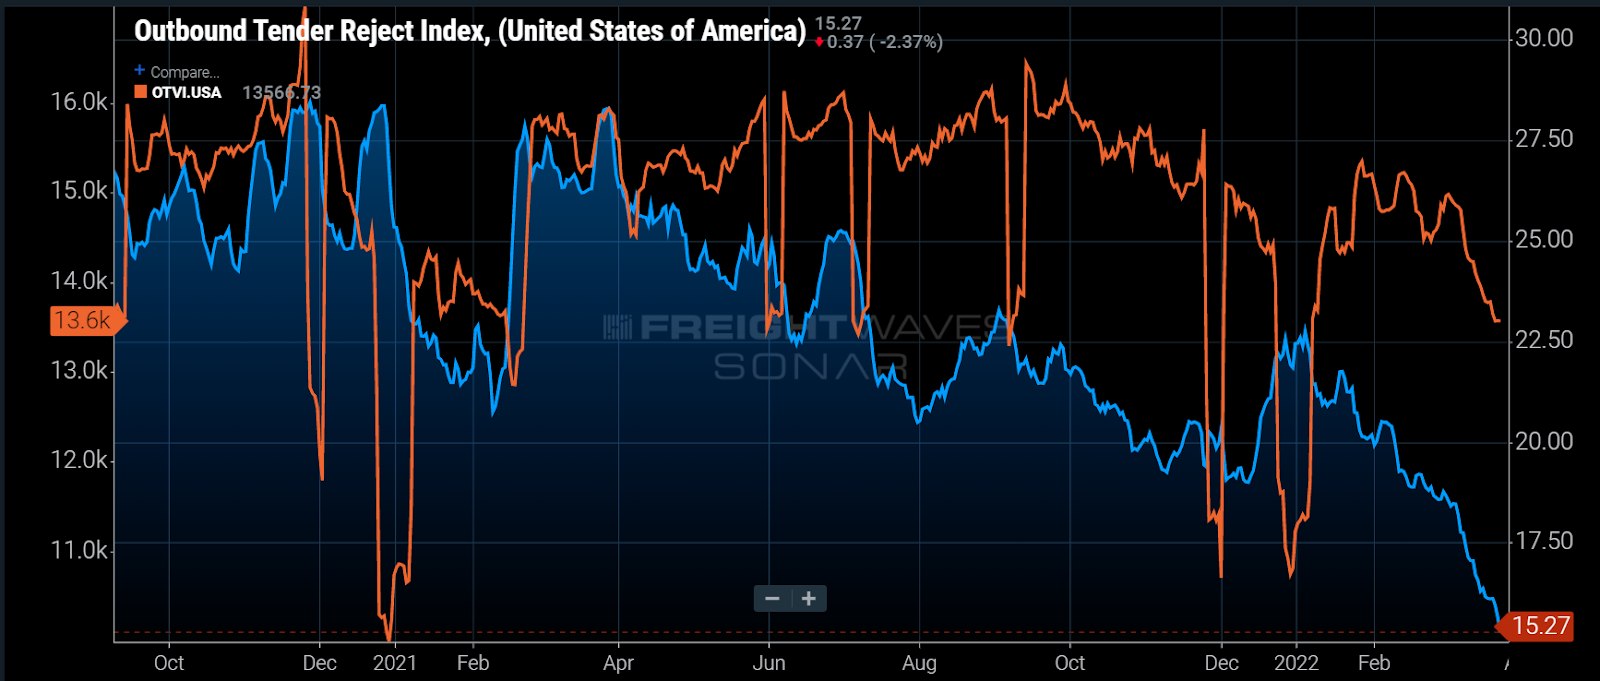
Chart of the Week: Outbound Tender Reject Index, Outbound Tender Volume Index – USA SONAR: OTRI.USA, OTVI.USA
National truckload tender volumes have fallen nearly 9.5% since March 3 while rejection rates have accelerated their decline to hit their lowest point since June 2020. FreightWaves CEO Craig Fuller wrote about how this is the start of another “bloody” cycle for truckload carriers but not everything will be the same as it was in 2019. While that piece focuses on the future, let’s make sure we fully understand the present and then see what may be different about this environment from the one three years ago.
The freight market is easing at its fastest pace since early 2021, which was a time when many shippers expected seasonal easing to return. What they got was an unexpectedly stimulated consumer and a winter weather event rivaling major hurricane-level infrastructure damage. While the latter is hardly predictable in the long run, the former can be vetted.
The macroeconomic environment is vastly different from what we saw in December 2020. The pandemic was still in full bloom, and another round of stimulus checks went out to a population that was still largely isolating from one another.
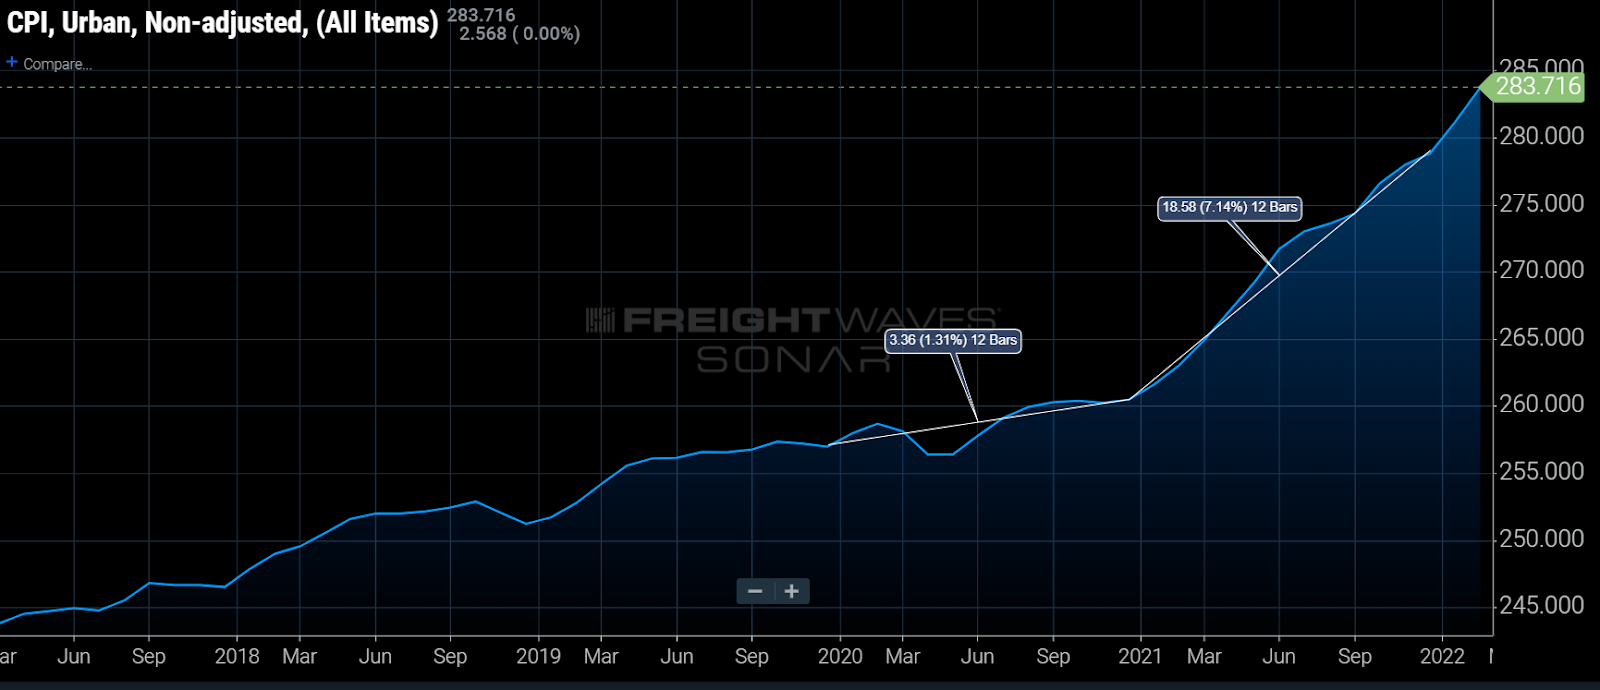
Inflation was below the 2%-3% Federal Reserve target, hovering around 1.3%. And while unemployment was still relatively high, sitting just below 7%, a large portion of those claims were being subsidized at higher-than-normal levels.
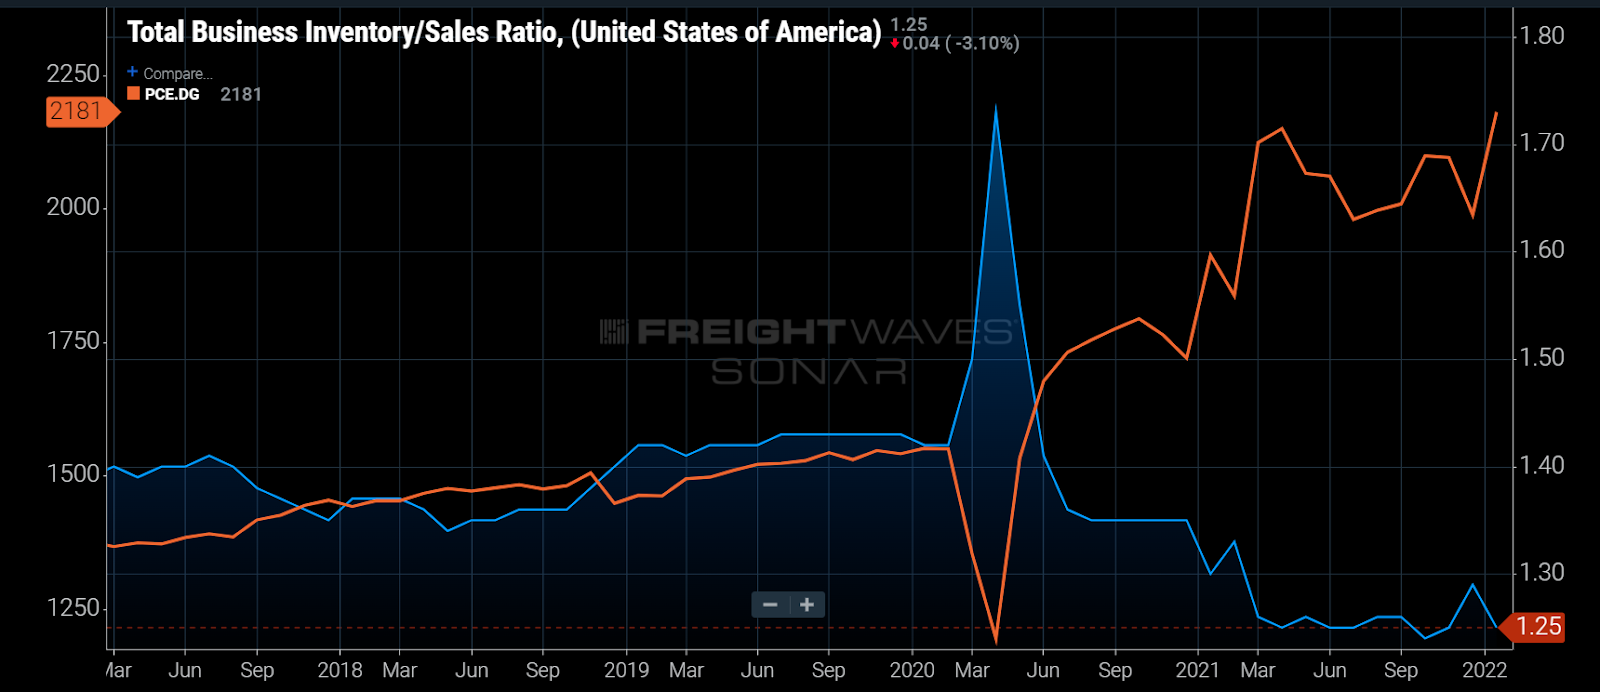
To sum it up, a large percentage of the population had more money and free time on their hands than they were accustomed to thanks to remote work, a lack of entertainment options and aggressive government spending. Consumer spending on durable goods increased over 10% from December to January and then took an additional 15% jump in March, further depleting inventories.
While consumer spending on durable goods remained elevated through January of this year — when the omicron variant was spiking in North America — more current data from the Logistics Manager’s Index suggests that in February shippers were able to grow inventories at the fastest pace since the index was created in 2016.
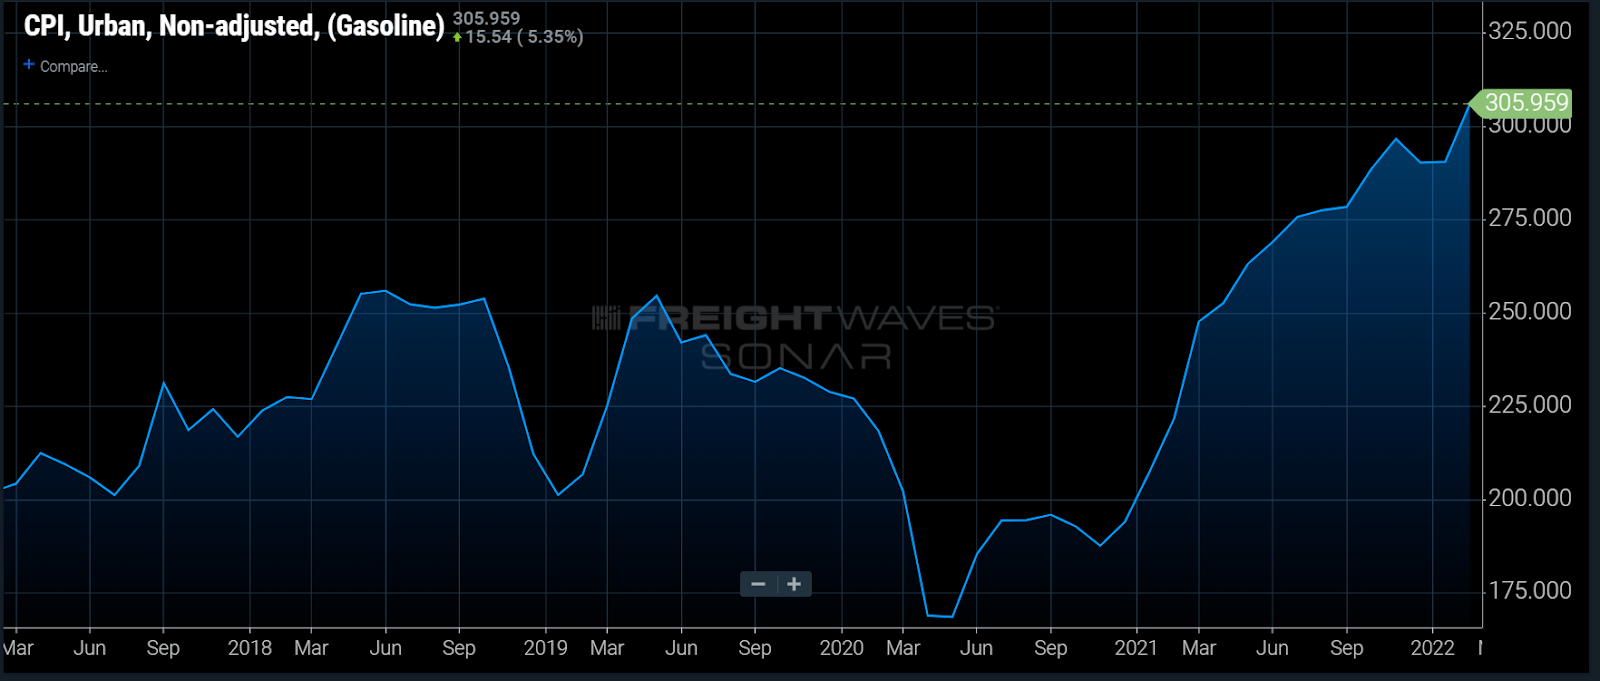
Though it is a little early to see the full impact of rising gas and food prices over the past few months, it is undeniably eroding consumers’ ability to spend on goods. While oil demand is ultimately a tailwind for the American economy, it takes time for it to show up in the aggregate figures. The near-term impacts to the consumer are felt immediately when prices spike as they have.

While the consumer economy is showing signs of eroding, which accounted for the gross majority of the pandemic-era freight boom, the industrial and construction sectors are hitting their stride. That is evident in the flatbed sector as both spot and tender rejection rates for this mode have been on the rise since November.
FreightWaves Chief Economist Anthony Smith theorizes on this past week’s Freightonomics that some of this activity could be due to a pull forward as companies try to get a head start on rising interest rates, which would explain the elevated construction and capital expenditure activity. The oil market makes the industrial side of this equation much more difficult to predict.
There is still a ways to go to get the market back to where it was in 2019, but the conditions of the past 18 months were always considered unsustainable and tender rejection rates above 20% simply cannot last. Supply or demand will inevitably move toward one another in a free market.
Supply chains remain in a state of disarray and the global geopolitical climate is unstable at best. 2019 was a far more stable environment, with the only real concern being trade relations with China. Those still exist but with a considerable number of other issues to deal with as well.
The market will soften, but how much and for how long are still in question. One thing that has become true over the past four years is the fact transportation capacity and prices have moved much more like a volatile commodity than the seasonal echocardiogram reading that existed for the seven years after the recession in 2009. The shippers, carriers and brokers who learn to accept and navigate the turbulence will have the greatest success.
About the Chart of the Week
The FreightWaves Chart of the Week is a chart selection from SONAR that provides an interesting data point to describe the state of the freight markets. A chart is chosen from thousands of potential charts on SONAR to help participants visualize the freight market in real time. Each week a Market Expert will post a chart, along with commentary, live on the front page. After that, the Chart of the Week will be archived on FreightWaves.com for future reference.
SONAR aggregates data from hundreds of sources, presenting the data in charts and maps and providing commentary on what freight market experts want to know about the industry in real time.
The FreightWaves data science and product teams are releasing new datasets each week and enhancing the client experience.
To request a SONAR demo, click here.
Freight Fraud Symposium
Double brokering. AI deepfakes. Identity theft. Freight fraud is an existential threat to the industry. Get ahead of it.
Supply Chain AI Symposium
Past the hype. Join operators, founders, and enterprise leaders figuring out how to deploy AI in supply chain.
Future of Rail Symposium
Reshoring is rewriting freight demand. Join shippers, rail executives, and government officials to shape the next decade.
Double brokering. AI deepfakes. Identity theft. Freight fraud is an existential threat to the industry. Get ahead of it.
Rock & Roll Hall of Fame • Cleveland, OH Register NowPast the hype. Join operators, founders, and enterprise leaders figuring out how to deploy AI in supply chain.
The Old Post Office • Chicago, IL Register NowReshoring is rewriting freight demand. Join shippers, rail executives, and government officials to shape the next decade.
The Signal at Chattanooga Choo Choo • Chattanooga, TN Register Now