
This week’s FreightWaves Supply Chain Pricing Power Index: 60 (Carriers)
Last week’s FreightWaves Supply Chain Pricing Power Index: 60 (Carriers)
Three-month FreightWaves Supply Chain Pricing Power Index Outlook: 50 (Carriers)
The FreightWaves Supply Chain Pricing Power Index uses the analytics and data in FreightWaves SONAR to analyze the market and estimate the negotiating power for rates between shippers and carriers.
The Pricing Power Index is based on the following indicators:
Tender volume ends March on a sour note
Following inflationary trends hitting consumers, such as rising prices of retail goods and soaring mortgage rates, freight demand is slowing down toward a grim outlook for the second quarter of 2022. The Outbound Tender Volume Index (OTVI) posted levels slightly below those of last week and remains far below year-ago levels.

SONAR: OTVI.USA: 2021-22 (blue), 2020-21 (green) and 2019-20 (orange)
To learn more about FreightWaves SONAR, click here.
OTVI declined by 1.81% over the past week and is down 14.6% on a year-over-year (y/y) basis. From the current economic perspective, there are few points of optimism for freight volume making a recovery in Q2 — which is not to say that there are none. The final weeks of tax season are upon us and refund checks will be in the mail over the coming weeks. Per the IRS, the average tax refund last year was $2,815.
Whether that money will be spent on retail goods or squirreled away into savings depends on consumers’ optimism or lack thereof. Although the Conference Board’s Consumer Confidence Index slightly rebounded in March from a dip in the month prior, its Expectation Index (which measures consumers’ short-term economic outlook) did fall. All told, spring retail sales are likely to suffer, though the decline could be softer than the worst fears of some.
Turning to accepted tender volumes, which is OTVI adjusted by the Outbound Tender Reject Index (OTRI), we see only minuscule growth by 0.72% y/y and 0.38% week-over-week (w/w). Given that OTVI can be inflated by a rising OTRI and that tender rejections in 2021 were far above those in the present year, March’s weakened OTVI had looked more favorable on a y/y basis when comparing accepted tender volumes. No more is that the case: Real freight demand is on a steady decline.

SONAR: Outbound Tender Volume Index – Weekly Change (OTVIW).
To learn more about FreightWaves SONAR, click here.
This week was another in which the largest markets saw either contraction or little growth, with most of the w/w increases coming from the smaller markets. Of the 135 total markets, only 58 reported weekly increases. Not only did Savannah, Georgia, see a 4.95% increase in outbound volume w/w, but it also posted month-over-month (m/m) growth for the 19th consecutive month. As a result of the swell in imports battering the Port of Savannah, the Georgia Ports Authority has moved to expedite over $538 million toward capacity expansion projects.
Tender volume is down by 6.47% w/w in the important market of Ontario, California, which handles freight from the ports of Los Angeles and Long Beach. Setting aside the larger trend of dampened freight volume, shippers are increasingly receiving their imports at seaports on the East and Gulf coasts, fearing the much-publicized congestion at their West Coast counterparts. A recently released report anticipates that in 2022, imports from Asia heading to the East Coast will rise 40% y/y and 56% over the average from 2020. Time will tell if these smaller East Coast seaports prove unable to supply the flood of fresh demand.
By mode: Unsurprisingly, both reefer and dry van volumes are down on a w/w basis, though reefer is performing slightly worse. As spring weather increasingly melts the winter thaw, shippers are relying less on temperature-controlled units. The Reefer Outbound Tender Volume Index (ROTVI) is down 3.83% this week and down 29.1% y/y, albeit against difficult comps from last year. The Van Outbound Tender Volume Index (VOTVI), meanwhile, posted moderate levels this week, down 2.35% w/w and 14.5% y/y.
Rejection rates remain in free fall with no floor approaching
OTRI continues to plummet, darting past 15% and sinking close to 13% this week. Coupled with rising operating expenses, this unseasonable depression in tender volume is leading carriers to hang on to their loads for dear life as few alternatives appear in the spot market.

SONAR: OTRI.USA: 2021-22 (blue), 2020-21 (green) and 2019-20 (orange)
To learn more about FreightWaves SONAR, click here.
Over the past week, OTRI, which measures relative capacity in the market, fell to 13.38%, a change of 189 basis points (bps) from the week prior. OTRI is now 1,326 bps below year-ago levels, welcome news to shippers but certainly unwelcome for carriers.
It can be easy to overlook the uniqueness of the trucking industry in America. Unlike other industries — for example, grocery, internet services and consumer electronics — the trucking industry is not dominated by a handful of heavyweights but is diversified among many small businesses. As of February 2021, out of all the carriers registered with the FMCSA, only 2.6% operated fleets with 20 or more trucking units; 91.5% had fleets of six or fewer trucks. This diversity leaves small carriers vulnerable to rapid shifts in freight demand, especially if they operate primarily in the spot market. Should tender rejections continue to fall, many of these carriers will buckle under an unbalanced account sheet and go bankrupt.

SONAR: WRI (color)
To learn more about FreightWaves SONAR, click here.
The map above shows the Weighted Rejection Index (WRI), the product of the Outbound Tender Reject Index — Weekly Change and Outbound Tender Market Share, as a way to prioritize rejection rate changes. As freight demand falls off in the largest markets, capacity is substantially looser across the board.
Of the 135 markets, a mere 19 reported higher rejection rates over the past week as carriers compete for loads among declining volume levels.
Back in February, Atlanta overtook Ontario, California, as the largest freight market by outbound volume. Over the past year, carriers had been flocking to the Los Angeles region, tempted by a hot spot market driven by ocean imports and sustained by congestion at the seaports. At the beginning of March, freight demand in Ontario plummeted while volumes in Atlanta rose, making for an awkward period of adjustment as carriers relocated to Atlanta. Since that move has been completed, however, freight demand has dropped in most major markets; as a result, capacity is now much looser in Atlanta.

To learn more about FreightWaves SONAR, click here.
By mode: Rejection rates fell across all modes this week, though flatbed rejections are still well above year-ago levels. The Flatbed Outbound Tender Reject Index (FOTRI) currently sits at 35.3%, 1,647 bps higher on a y/y basis. Despite mortgage interest rates reaching their highest level in almost four years, meager inventory levels and unabating demand signal that the housing boom has yet to subside. Therefore, flatbeds will continue to be in demand during the spring construction season.
Van rejection rates are driving the decline in the overall OTRI, as the Van Outbound Tender Reject Index (VOTRI) is now at 12.96%, 189 bps lower on a w/w basis. Capacity conditions in the reefer market continue to ease, as the Reefer Outbound Tender Reject Index (ROTRI) fell 386 bps to 22.19%.
Spot rates continue their decline, though contract rates linger near record highs
The spot rate data available in SONAR from Truckstop.com is updated every Tuesday with the previous week’s data.

SONAR: Truckstop.com’s national spot rate (blue, right axis) and dry van contract rate (green, left axis).
To learn more about FreightWaves SONAR, click here.
The Truckstop.com national spot rate, based on the top 100 lanes on Truckstop.com’s load board, continued to drop as capacity loosened across the markets. The national spot rate, after reaching an all-time high of $3.83 per mile in early January, now sits at just $3.34 a mile, which includes fuel surcharges and other accessorials.
Of the 102 lanes from Truckstop.com’s load board, 25 reported spot rate increases last week, down from 36 lanes the week prior. This decline in the average spot rate, coupled with the unstoppable rise in contract rates, is likely to help shift pricing power into shippers’ favor.
The week prior, contract rates set a new record high, though they have since fallen by a negligible amount. Contract rates, which are the base linehaul rate excluding fuel surcharges and other accessorials that are included in spot rates, fell by 2 cents per mile this week, as contract rates are now sitting at $2.94/mi.
FreightWaves’ Trusted Rate Assessment Consortium (TRAC) spot rate from Los Angeles to Dallas had yet to experience any correction whatsoever, as the downward spiral in rates continued uninterrupted since the beginning of 2022. This week, the rate rose 2 cents per mile to $2.85. Carriers and shippers alike might have been wondering where this lane’s floor for rates was, and since rates are finally leveling out, it might be here. There is still a chance for rates to fall even lower; an increase in rates, however, is not expected anytime soon.
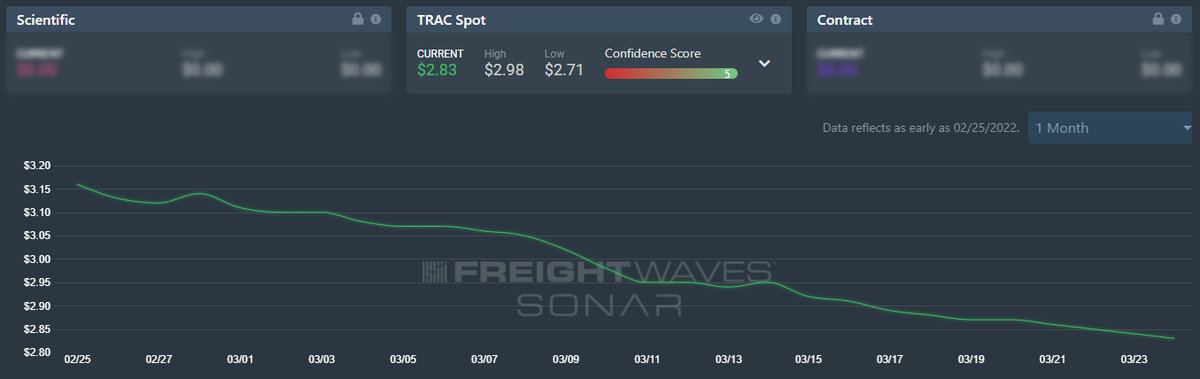
To learn more about FreightWaves TRAC, click here.
The FreightWaves TRAC spot rate from Atlanta to Philadelphia, on the other hand, did fall this week, responding to loosened capacity in the Atlanta region. The rate from Atlanta to Philadelphia now sits at $3.66 per mile, down 7 cents a mile from the previous week. Volume levels in Atlanta, which is currently the largest market by outbound volume, flattened out as they only declined by 0.12% over the past week.

To learn more about FreightWaves TRAC, click here.
With the above discussion on the small size (and thus heightened vulnerability) of most carriers in mind, the second quarter will likely usher in a wave of bankruptcies for trucking companies and financial hardships for brokerages. Unlike trends in the larger economic cycle, the boom-bust cycle in the truckload market typically follows a three-year pattern. The last bust for the trucking industry was, appropriately, three years ago in 2019. Many shippers, brokers and carriers expressed their concerns for the upcoming months in an article this week by Craig Fuller, FreightWaves’ founder and CEO: Why I believe a freight recession is imminent.
For more information on the FreightWaves Freight Intel Group, please contact Kevin Hill at khill@www.freightwaves.com or Tony Mulvey at tmulvey@www.freightwaves.com.