
Track all the ships in the world. What they’re carrying, where they’re loading, where they’re unloading. Create a near-real-time map of how all commodities and goods flow across the globe. This is the holy grail of ocean shipping data — one that companies such as Cargometrics, VesselsValue, Kpler, IHS Markit (NYSE: INFO) and others have pursued for years.
This data is more valuable than ever in the age of coronavirus — and now there’s a new source. One that’s actually free.
The new offering developed by International Monetary Fund (IMF) economists Diego Cerdeiro and Andras Komaromi and IMF data scientists Yang Liu and Mammon Saeed was announced in May and is now fully available to the public and updated weekly.
The IMF staff’s “nowcasting” research offers a 30,000-foot view of how COVID-19 has reshaped trade flows. If it works as intended, it will offer an early warning system to governments, and by extension, companies and investors.
Measuring fallout
The platform utilizes automatic identification system (AIS) shipping-position data collected by MarineTraffic. It assesses import and export vessel capacity measured in deadweight tons (DWT) by country and ship type. It then uses machine-learning algorithms to estimate metric tons of cargo carried.
The updated capacity and cargo tonnage numbers are available for download via UN Comtrade (see link for access).
To gauge coronavirus fallout, FreightWaves downloaded the year-to-date (YTD) export data for 2020 and the comparable period last year for tankers, dry bulk, containers and the overall global fleet.
Cargo volumes are highly seasonal, so FreightWaves looked at the numbers two ways: first, the change in daily volume versus the same day in 2019; and second, the change in YTD volume versus the same period the year before.
Global export effects
Global exports show two “valleys.” In the first quarter, a supply-side shock stemming from the initial outbreak in Wuhan, China, coinciding with seasonal dry bulk weakness. In the second quarter, a slide coinciding with the demand-side shock of consumer lockdowns in Europe and the U.S.

The year began on a positive note, with volume up by the mid-single digits. The post-Wuhan-lockdown bounce-back was strong. It was the Western lockdowns that hurt the most, bringing daily global exports down by the low double digits at the June nadir.
Daily export volumes recovered and were up 3% year-on-year as of the first week of August.
The change in YTD total volume may be a better indicator of performance for ship operators and ports. For the period Jan. 1-Aug. 5, total global exports were essentially flat versus the same period last year, down 1%.
The YTD total has stopped falling, has stabilized and is edging in a positive direction. Rebounding exports driven by the reopening of Western economies are on the verge of bringing the YTD total back into the black.
Tanker effects
Exports of crude, products and chemicals represent 21% of seaborne volumes YTD (through Aug. 5), according to the research dataset. Of all shipping categories, the tanker segment gets the most attention from investors.
The data shows a jump in exports in March, when talks between Saudi Arabia and Russia collapsed and producers opened their spigots. This is followed by a sharp fall in global tanker exports in the second quarter, as the OPEC+ coalition agreed to cut production, falling prices pared production among non-coalition nations and earlier export volumes remained tied up in floating storage.
The data then shows a sharp rebound in exports in July and early August, bringing year-on-year comparisons into positive territory as of this month (although the year-on-year percentage may be inflated by “easy comparables” versus seasonal weakness in 2019). From a YTD perspective, total volumes were still down 1.4% as of Aug. 5.

Container-shipping effects
Exports of containerized goods and general cargo represented 29% of estimated volumes through early August. Cornavirus has affected container exports even more heavily than tanker exports.
The IMF team’s data shows a more pronounced double-valley pattern for container exports than for any of the primary volume categories.
Container exports fell by almost 10% globally over the course of February as the virus shut down Chinese outbound cargoes. Volumes snapped back in March but slid all the way back down again through April and early May as import regions locked down and carriers canceled sailings (volume effects were felt in U.S. import ports later, in May and June, due to ocean transit times).
Global containerized export volumes had bounced back to January levels by late July and early August, but were still down 1.4% year-on-year as of Aug. 5 and down 3.8% YTD versus the same period in 2019.

US container strength
Container lines report depressed demand in South America but resurgent flows to other markets, particularly the Asia-U.S. West Coast market. The IMF team’s data confirms the strength of U.S.-China volumes.
Container volumes are difficult to judge year-on-year. First, the timing of Lunar New Year (LNY) varies. Second, U.S. tariffs affected 2018-19 numbers. To address these issues, the IMF staffers indexed 2020 daily volumes to the 2017-19 average, adjusted for Lunar New Year (see link to data here, including all of the raw data for the entire project; see easy-to-use UN Comtrade dashboard here).
This perspective shows a plunge of more than 25% in Chinese containerized exports in the wake of the Wuhan outbreak, but a drop in U.S. imports of only 10% (with a lag effect due to ocean transit times). American-bound boxes rebounded from that initial shock, then fell to 15% below average by June due to consumer lockdowns.

Trend lines for Chinese exports and U.S. imports have closely followed each other since early July. As of Aug. 5, U.S. box imports were 10% above average and Chinese exports 4% above average.
Dry bulk volumes
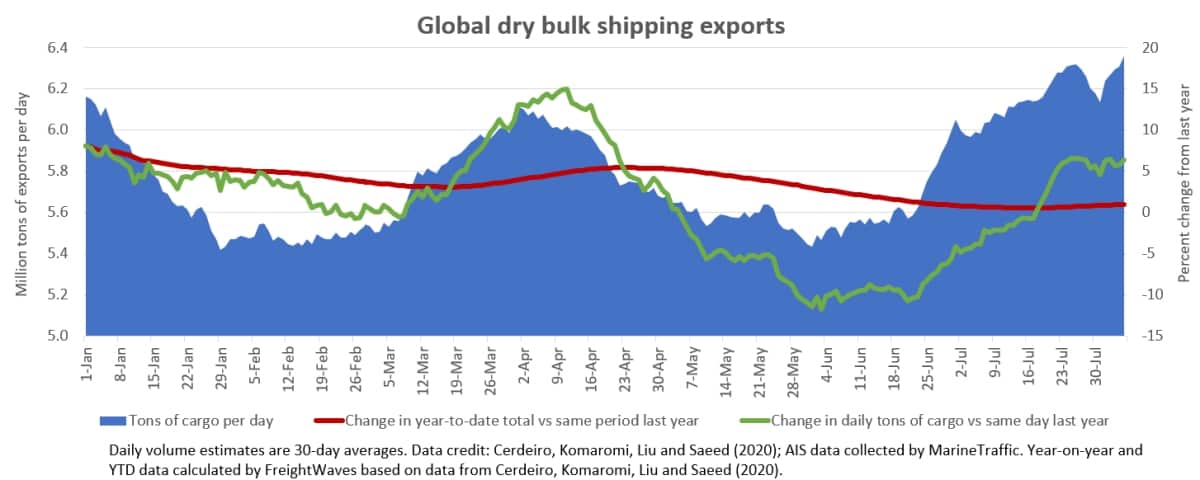
Dry bulk shipping — led by iron ore, coal and grains — is by far the world’s largest freight market by volume. It accounted for 44% of volumes in the IMF team’s YTD data.
Dry bulk exports rose off first-quarter lows in April, then sank, then came back up in recent months. More so than other sectors, dry bulk exports have been affected by seasonal and other non-coronavirus issues. The ebb and flow in the data is roughly in the same direction as spot rate trends. The data shows YTD cargo volume are essentially flat (up less than 1%).
Still ‘experimental’
The caveat to the new free product from the IMF team is that it is openly described as “experimental.” (See link for methodology.) There are ongoing refinements and all estimates are subject to change.
The authors’ disclaimer: “These estimates are not official IMF statistics and were not endorsed by the IMF or its executive board. These estimates were produced by staff in the context of [a] research project and should be interpreted accordingly.”
Indeed, industry insiders may look at the curve of the recent dry bulk and tanker volume gains in the datasets and deem them too steep in light of freight rates.
The tanker data loses quite a bit of its value due to its mixing of crude and product carriers into one category. And on the container side, use of AIS data is inherently questionable for cargo estimates: Unlike with laden bulk ships, it is very difficult to estimate how much cargo is aboard a container ship, while algorithms based on past utilization rates break down during one-off events like pandemics.
But despite its shortcomings, the new shipping data offering — so new it doesn’t even have a brand name — stands out.
Never before has this much ship-positioning data been available to the general public, amalgamated by ship type and country and easily downloadable … without a price tag attached. Click for more FreightWaves/American Shipper articles by Greg Miller
MORE ON OCEAN SHIPPING DATA: Using ship-tracking data to shine a light on clandestine crude shipping: see story here. Using container-ship ‘blank sailing’ data as an early warning system on global trade: see story here. An exclusive interview with Scott Borgerson on Cargometrics: see story here.