


The highlights from Friday’s SONAR reports. For more information on SONAR — the fastest freight-forecasting platform in the industry — or to request a demo, click here. Also, be sure to check out the latest SONAR update, TRAC — the freshest spot rate data in the industry.
Lanes to watch
By Zach Strickland, director, Freight Market Intelligence
MEMPHIS to KANSAS CITY
Overview: With the Headhaul Index increasing over 21% w/w, capacity is likely to tighten significantly in the days ahead.
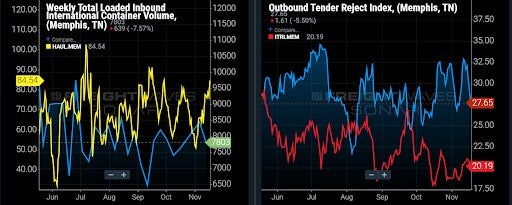
Highlights:
- Memphis outbound tender volumes are up 10% w/w, signaling that demand for outbound capacity is increasing.
- The Memphis Headhaul Index is up 21% w/w, signaling that the imbalance between inbound and outbound volumes is growing.
- Memphis outbound tender rejections are down 4.4% w/w, but that trend is likely to accelerate as demand for capacity increases.
What does this mean for you?
Brokers: It is likely that outbound tender rejections will continue to rise as the Headhaul Index surges 21% w/w. With a major 46% increase year-over-year (y/y0 in inbound international containers moving into Memphis via rail, this surge in outbound volumes is likely to continue, and is likely to stay strong during the remainder of 2021. With outbound tender volumes up 10% w/w, outbound tender rejections are very likely to move higher in the coming days and weeks.
Carriers: Stay firm on your rates as outbound tender rejections are likely to increase in the coming days, and that is likely to shift pricing power into your favor. With inbound international volumes seeing significant growth into Memphis, outbound volumes are likely to continue growing through the remainder of the year. Keep an eye on outbound tender rejections and use this index to confirm tightening conditions are indeed driving upward or downward pressure on rates.
Shippers: Your shipper cohorts in Memphis are still averaging 2.7 days in tender lead times. The Headhaul Index in Memphis is up 21% w/w, and outbound tender rejections likely to continue increasing in the coming days. It would be wise to keep your tender lead times between 3 and 4 days through the next couple of weeks to ensure you are able to secure capacity in the market.
HARRISBURG (Pennsylvania) to CHICAGO
Overview: Dry van spot rates in SONAR’s Market Dashboard highlight the cost advantage of domestic rail intermodal.
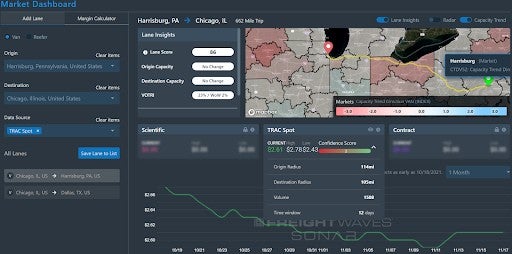
Highlights
- The new SONAR Market Dashboard tool shows an average dry van spot rate of $2.61/mile, including fuel, from Harrisburg to Chicago and $2.73/mile, including fuel, from nearby Chambersburg to Chicago.
- The intermodal spot rate from Chambersburg to Chicago is $2.05/mile, up 10% from the prior week, but it is still 25% below the dry van spot rate.
- The dry van tender rejection rate in the Harrisburg to Chicago lane is 22.09%, which is 279 basis points (bps) above the national van tender rejection rate, and represents an increase of 229 bps during the past two weeks.
What does this mean for you?
Brokers: Brokers could potentially minimize purchased transportation costs by brokering an intermodal load in the lane, but make sure that the load is less time-sensitive before going that route. When negotiating with highway carriers in the lane, stress that Chicago remains a Headhaul market.
Carriers: Chicago looks like a solid destination for dry van carriers given its Van Headhaul Index of 57, which means it should be easy for carriers to get reloaded. The Chicago van outbound tender rejection rate is 17.88%; that tender rejection rate is 142 bps below the national average, but it is still indicative of a tight market.
Shippers: For spot shippers with less time-sensitive loads (there are fewer of those this time of year), the savings associated with using domestic intermodal look attractive. Shippers with more time-sensitive loads may want to extend their lead times past the 3.2-day average for all outbound Harrisburg loads.
ONTARIO (California) to COLUMBUS (Ohio)
Overview: Ontario’s outbound rejection rates continue to spike leading into the holiday.
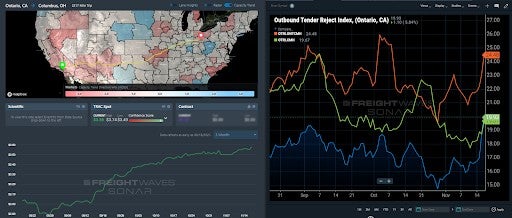
Highlights:
- Ontario’s outbound rejection rate has spiked to its highest point since July 4th with rejection rates to Columbus increasing above 24%.
- FreightWaves TRAC spot rates had leveled off in this lane until about a week ago; they have now increased about 3 cents per mile in the last day to $3.58 per mile.
- Columbus’ outbound rejection rate is back on the rise as well, climbing from under 18% to 19.67% in the past week.
What does this mean for you?
Brokers: Secure as much capacity out of Ontario as you can, making this origin one of the highest priorities over the next week. There are not a lot of drivers domiciled in Los Angeles for over the road fleets and capacity will be much less available in this region than others as carriers reposition for home time.
Carriers: Expect a lot more spot market activity out of Ontario over the next week. Accept all the loads you can into this market at this point as the rates will be trending higher than $3.58 per mile in this lane. Loads out of Columbus should be equally as easy to find.
Shippers: Hold non-essential freight until after Thanksgiving if possible. Rejection rates should ease at that point as they traditionally do, making the spot market moves less necessary. Conversely, if something needs to move, prioritize securing capacity in this lane now. Be prepared to pay a premium for it.
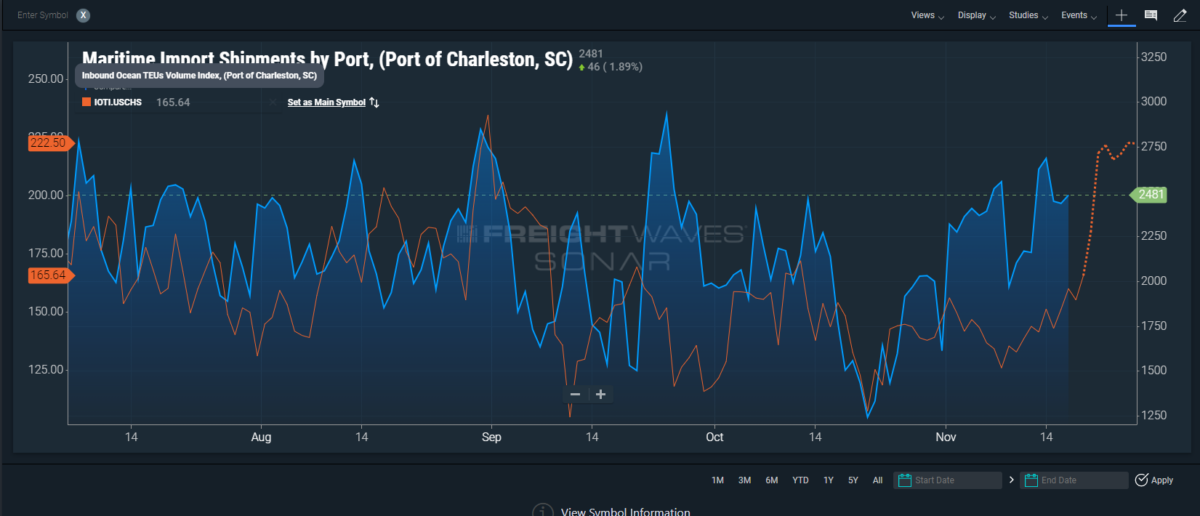
TRAC Market Dashboard: Charleston to Atlanta
By Richard Daigle, SONAR account executive
The Charleston to Atlanta lane has been volatile and most recently, has significantly tightened:
TRAC Market Dashboard shows spot rates the majority of spot rates for dry van ranging from $4.23 to $3.55, inclusive of fuel. The underlying market conditions have tightened significantly over the past few days, putting a lot of upward pressure on these rates. The Lane Score is currently 81, signalling that capacity is tight. Tender rejections are at 27% on this lane, and that is up 4% week over week. Expect spot rates to trend towards the higher end of the range shown in the TRAC Dashboard below.
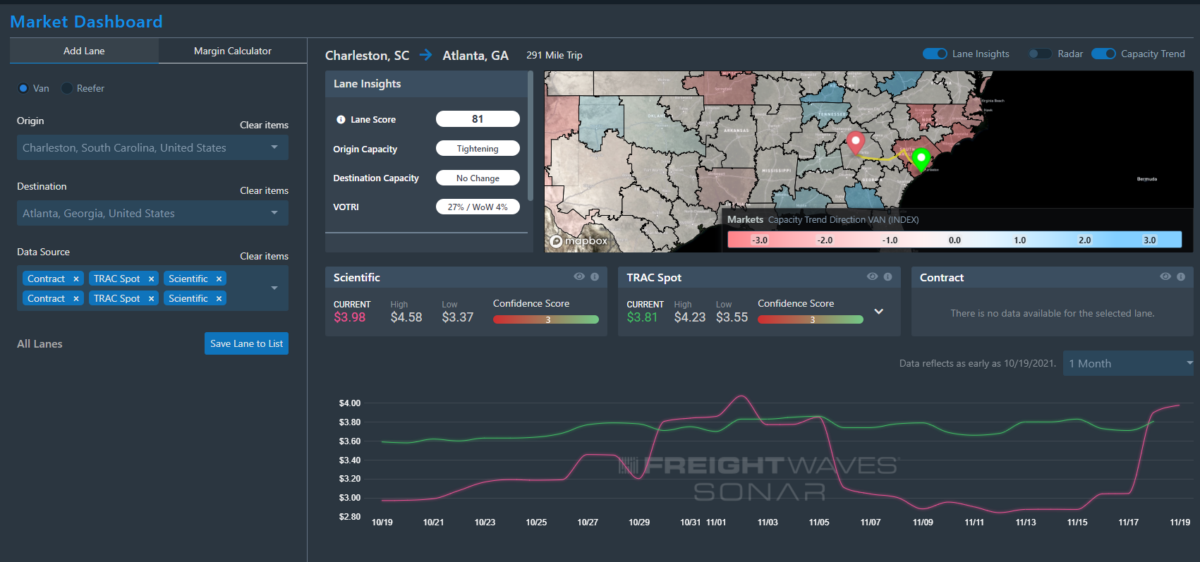
Looking forward, we see that there is a significant amount of import volume scheduled for the port of Charleston over the next month or so. Look for capacity to remain tight as import fueled demand remains high.
Watch: Retailers prep for peak season
Looking at trans-Pacific ocean rates
By Mike Baudendistel, Market Expert
Congestion at the Southern California ports has led to a reduction in container-ship arrivals in the region. As FreightWaves’ Greg Miller illustrates, the number of daily container-ship arrivals declined 10% during the first 17 days of November versus the average daily container-ship arrival volume in September.
That seems to be a market response to the congestion and, so far, that hasn’t been enough to alleviate any of the congestion in San Pedro Bay. This week, a record high of 86 container ships were waiting offshore, and the time it took to get a container ship from waiting offshore to berth was a whopping 18.4 days.
While still at highly elevated levels, eastbound trans-Pacific ocean rates (China to the U.S.) are down about 10%-16% in the past month.
This note originally appeared in The Stockout newsletter. Click here to subscribe.
Focus on … Inbound Ocean TEUs
By Zach Strickland
Inbound Ocean TEUs Volume (China to U.S.) vs. Van Outbound Tender Volumes (USA)
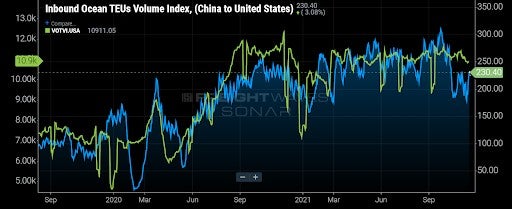
The Inbound Ocean TEUs Volume Index was created to give users a real-time view of container volumes moving between origins and destinations around the world. This index is a 10-day moving average, and measures the amount of twenty-foot equivalent units (TEUs) departing on vessels from origin on a given day.
Each granularity of this ticker is indexed to itself with a baseline of 100 on Jan. 1, 2019.
This index also includes a 7-day forward look (white dotted line) of confirmed TEU volumes that are expected to move based on their estimated time of departure.
Then, as the estimated times of departures for these TEU volumes become actual times of departure (when the vessel departs its berth at origin), they are included in the calculation for the index value on that specific day.
This can be one of the best ways to monitor containerized volumes that are on the water before they ever arrive at their anticipated destination.
Therefore, this index provides users with one of the industry’s best leading indicators for container volumes that will need surface-side transportation once they arrive.
Since TEU volumes from China to the U.S. comprise such a large amount of dry van truckload volumes once they arrive at their destination, the two indices hold a very tight correlation to one another, and can help provide guidance into anticipated surface-side transportation demand for the future.

Kristin Bader
I quit working at shoprite and now I make $65-85 per/h. How? I’m working online! My work didn’t exactly make me happy so I decided to take a chance on something new… after 4 years it was so hard to quit my day job but now I couldn’t be happier.
Here’s what I do…>>> http://www.EarnApp3.com