
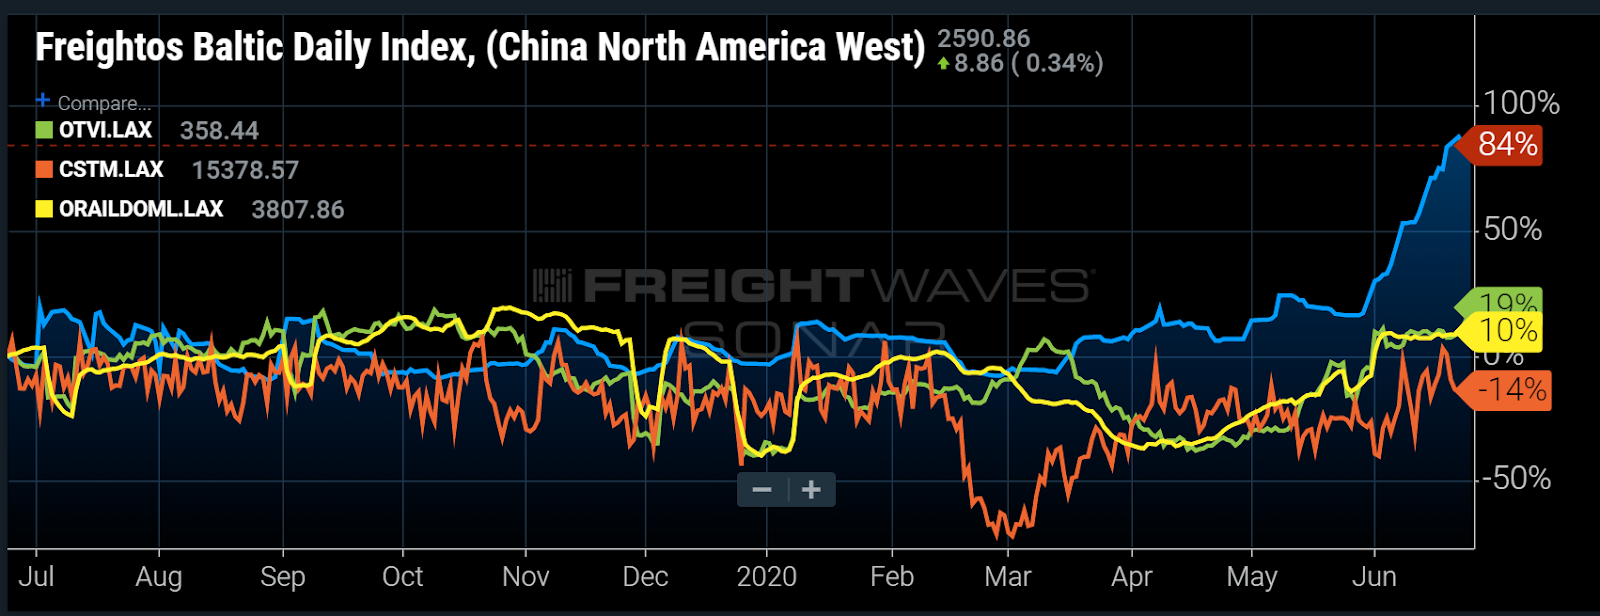
Chart of the Week: Freightos Baltic Daily Index – China to North America West, Outbound Tender Volume Index – Los Angeles, Customs Import Shipments – Los Angeles, Outbound Loaded Domestic Rail Containers – Los Angeles SONAR: FBXD.CNAW, OTVI.LAX, CSTM.LAX, ORAILDOML.LAX
Southern California has become a key entry point for freight entering the U.S. in the post-COVID-19 market. After a notable shift in shippers moving freight in through the eastern ports in late 2019, they have scrambled to recover lost time and manage inventories in what has become, to use a cliche, “the new normal.” According to the Freightos Baltic Index, Maritime spot rates have grown 84% from China to North America’s West Coast over the previous year as maritime carriers have cut capacity in anticipation of a decline in demand. Truckload volumes have grown 19% out of the Los Angeles market year-over-year (y/y), while domestic intermodal volumes have also increased 10% over the previous year.
Southern California has long been a bastion of freight in the U.S., originating over 7% of all for-hire truckload volumes over the past two years. For the rail sector it represents almost 20% of all intermodal volumes over the same time period. Interestingly enough, after the economy started recovering, all modes increased in market share out of the market.

The Los Angeles markets averaged originating 5.8% of the U.S. domestic freight through the first five months of the year. After the start of May they are averaging a 6.85% market share value according to the Outbound Tender Market Share Index (OTMS).
The significance of this for carriers is that it suggests shippers are now diverting from their pattern of late 2019 when they were pulling more freight into the country via ports closer to the population centers on the East Coast. They appear to have abandoned that practice for the moment in order to take advantage of a rate-suppressed truckload market and faster service.
For example, it adds seven to 10 days to move ships to the port of New York/New Jersey from the main ports in China, whereas a truck with a team of drivers can drive across the country in a few days. Excluding the variance in port congestion, trucks remain the faster mode of transporting freight across the country.
The increase in domestic intermodal volumes has been the real surprise, as the rail sector has dealt with significant volume declines as trucking rates have become much more competitive over the past year. Total U.S. loaded rail volumes have fallen 13% versus this time in 2019. Los Angeles’ domestic container volumes have risen 10%. International container volumes have fallen over 25% out of Los Angeles.
According to Mike Baudendistel on this week’s Freightonomics podcast, this is a signal that shippers are transloading more freight out of the 20- and 40-foot containers into the 48- and 53-foot units before moving across the country. This is a by-product of a shortage of containers in China and maritime shippers controlling their costs by keeping their equipment positioned closer to the ports.
The one concerning figure in all this is the customs number, which is the only negative figure in this week’s chart. Imports have recovered to an extent, but are still well below the previous year. This could be a product of limited capacity or lower demand or both. In any case, the implication is not great for the next few months if this number does not increase.
After looking at sites like Amazon and Wayfair, inventories are already showing signs of weakness. Delivery windows have expanded from days to months in some cases. If consumers cannot retrieve their goods in a short enough window, they may abandon the purchase. Eventually there is the looming economic situation where stimulus packages end and the expectation is that many will still be left without a job after the dust settles, meaning less disposable income.
So far the economy is showing signs of resilience. The housing and home improvement sectors remain strong, and consumer spending has seemingly shifted to other avenues as people adjust to the post-COVID-19 lifestyle. Macroeconomic figures have shown to be somewhat disconnected from the current state of the freight market, however, with shippers scrambling to adapt their supply chains and respond to a rapidly changing environment. Southern California has become a good area to watch for changing activity.
About the Chart of the Week
The FreightWaves Chart of the Week is a chart selection from SONAR that provides an interesting data point to describe the state of the freight markets. A chart is chosen from thousands of potential charts on SONAR to help participants visualize the freight market in real time. Each week a Market Expert will post a chart, along with commentary, live on the front page. After that, the Chart of the Week will be archived on FreightWaves.com for future reference.
SONAR aggregates data from hundreds of sources, presenting the data in charts and maps and providing commentary on what freight market experts want to know about the industry in real time.
The FreightWaves data science and product teams are releasing new data sets each week and enhancing the client experience.
To request a SONAR demo, click here.
Supply Chain AI Symposium
Past the hype. Join operators, founders, and enterprise leaders figuring out how to deploy AI in supply chain.
Future of Rail Symposium
Reshoring is rewriting freight demand. Join shippers, rail executives, and government officials to shape the next decade.
F3: Future of Freight Festival
Industry-defining keynotes, rapid-fire technology demos, and industry leaders networking in experiences across Chattanooga - plus the inaugural F3 Awards Dinner featuring the FreightTech and Shipper of Choice reveals.
Past the hype. Join operators, founders, and enterprise leaders figuring out how to deploy AI in supply chain.
The Old Post • Chicago, IL Register NowReshoring is rewriting freight demand. Join shippers, rail executives, and government officials to shape the next decade.
The Signal at Chattanooga Choo Choo • Chattanooga TN Register NowIndustry-defining keynotes, rapid-fire technology demos, and industry leaders networking in experiences across Chattanooga - plus the inaugural F3 Awards Dinner featuring the FreightTech and Shipper of Choice reveals.
The Signal at Chattanooga Choo Choo • Chattanooga, TN Register Now