
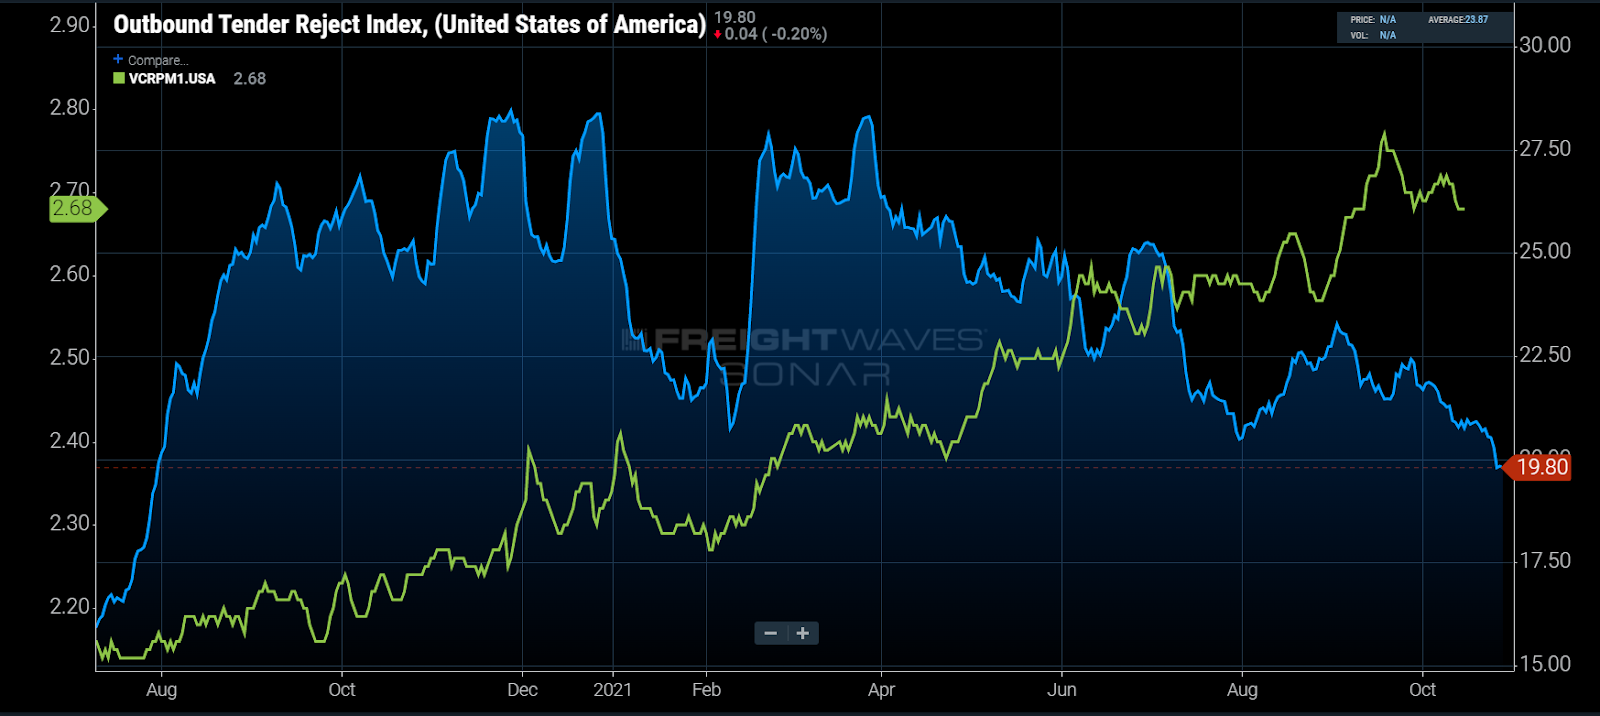
Chart of the Week: Outbound Tender Rejection Rate, Van Contract Rate Per Mile Initial Report – USA SONAR: OTRI.USA, VCRPM1.USA
The national Outbound Tender Rejection Index (OTRI), which measures carrier compliance for contracted moves, fell below 20% for the first time since July 31, 2020, this past week. This is somewhat unexpected considering trucking demand remains at all-time highs. Are contract increases gaining traction?
It has been hard to isolate the impact of contract rate increases on compliance over the past year as demand has sustained well beyond the national supply of capacity for so long. This is apparent, knowing the traditional pattern of carrier compliance. Typically, tight capacity conditions occur in relatively short bursts and are mostly seasonal.
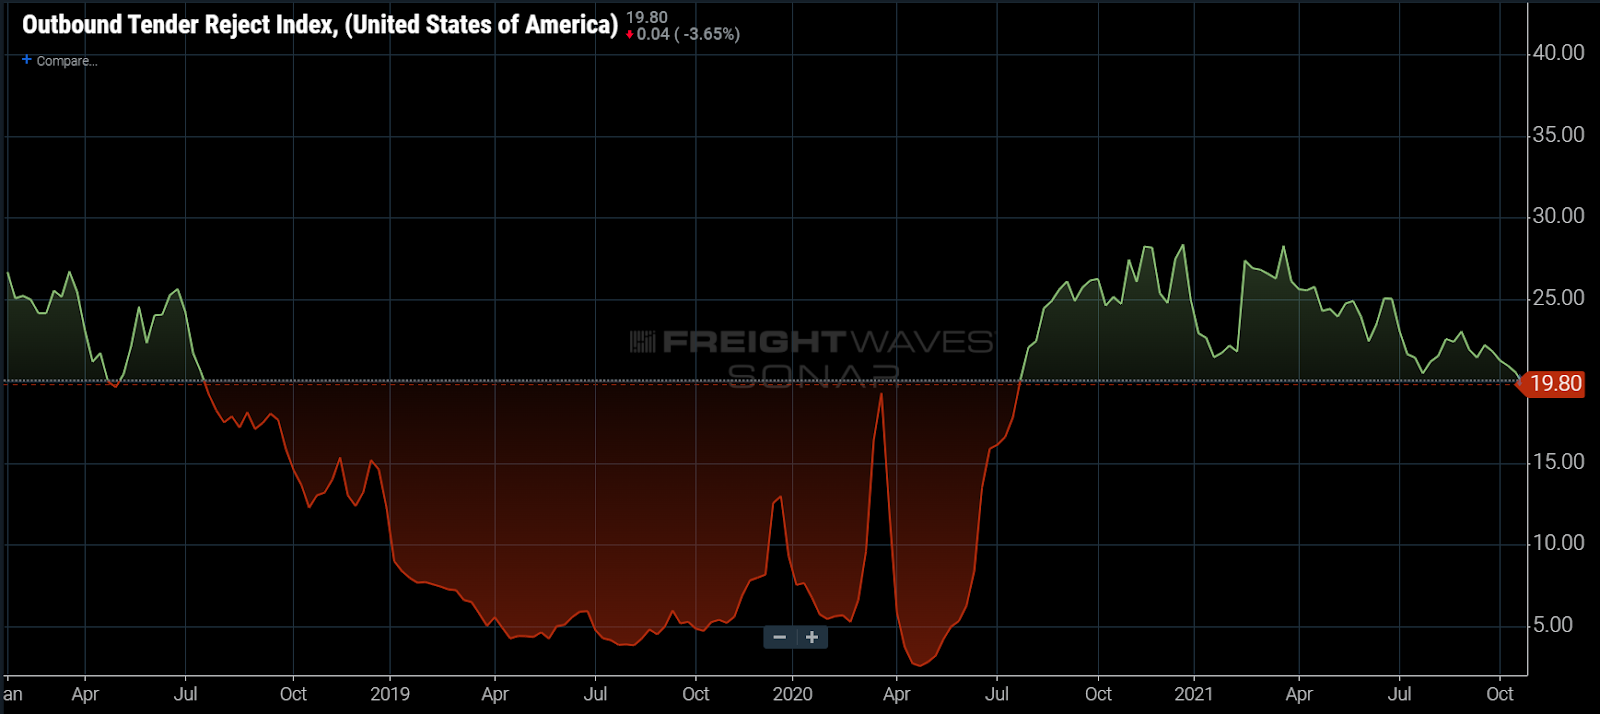
Pre-pandemic, a rejection rate above 20% was thought to be an extremely rare occurrence that was only likely to happen in extremely rare conditions like the ones seen in 2017-18, largely written off as an anomaly as capacity quickly grew in response, leading to an oversupplied 2019 market in which national rejection rates hovered around 5% most of the year.
Shipping demand has been at unprecedented levels over the past 15 months as consumer behavior has shifted, catching many companies off-guard. Capacity, among other supply chain limitations, has also helped to limit its own recovery as new truck orders fail to be fulfilled quickly enough. Many larger fleets like Schneider reported a contraction in equipment overall this past quarter.
Truck order fulfillment is not the only cause here as a challenged driver hiring market and inflated used equipment prices have pushed many carriers to sell unseated vehicles, helping to extend the cycle.
Rejection rates appeared to be on their way back down in January, prior to a string of winter weather events that seemingly shocked shippers into action, and rejection rates jumped from just above 20% back to around 27% in less than two weeks. An unexpected increase in consumer demand in January also contributed.
After the resurgence of shipping demand at the end of the first quarter, rejection rates started to slowly fall with intermittent spikes around holidays but never climbing back to their peak values. Contract rates, represented by the Van Contract Rate Index (VCRPM1) that is based on over $20 billion of annual invoice data, shows a rapid climb in long-term prices since that time period.
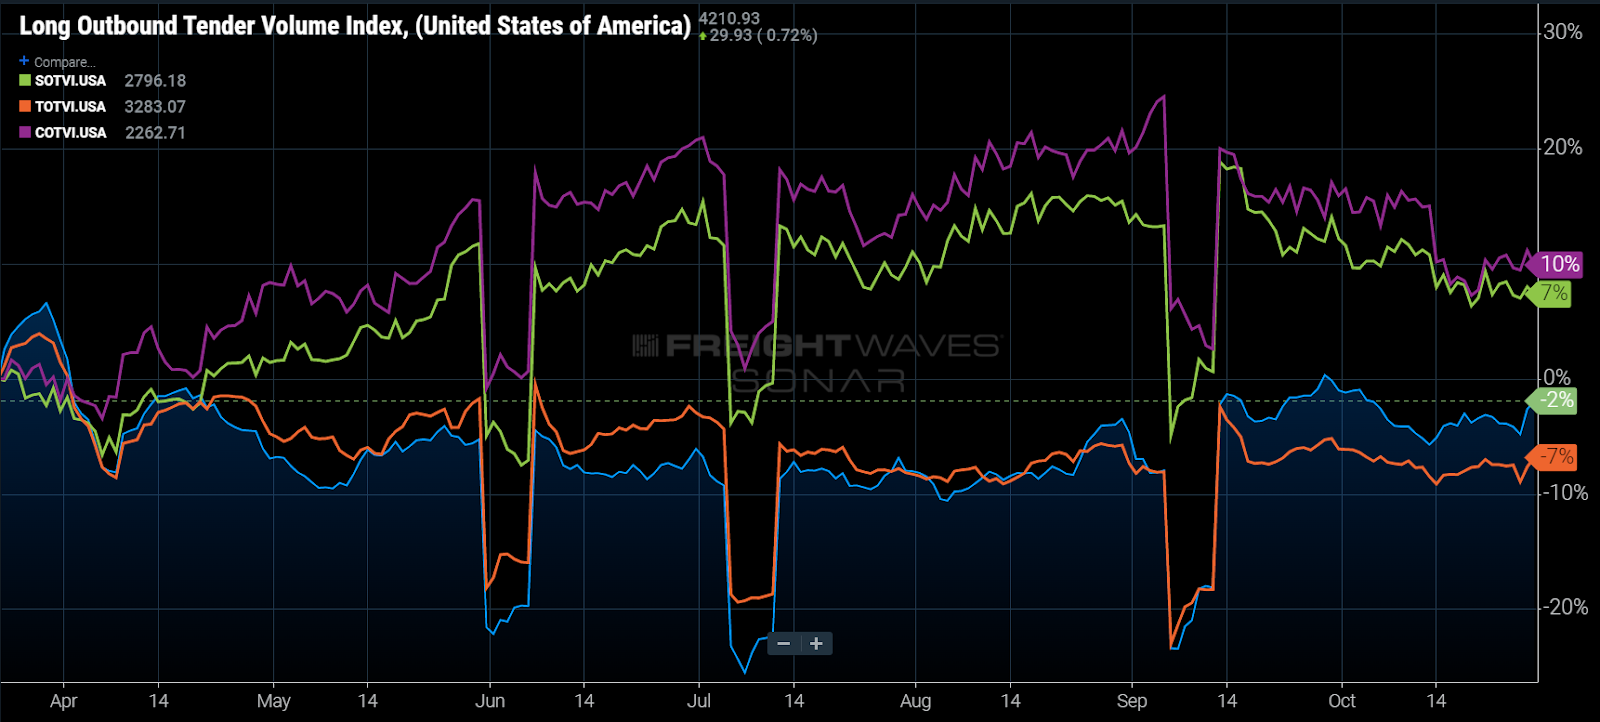
While contract rates were seemingly having an impact, another underlying pattern shift that was much more difficult to see was occurring. Loads moving less than 250 miles were increasing while the longer haul (more rejected) load tender volumes were falling. This made it appear the market was stabilizing faster than it actually was.
While short-haul volume growth is still apparent from a year-over-year perspective, that trend has reversed heading into November, meaning the post-Labor Day decline in aggregate rejections has more to do with compliance increasing in general due to factors other than length of haul.
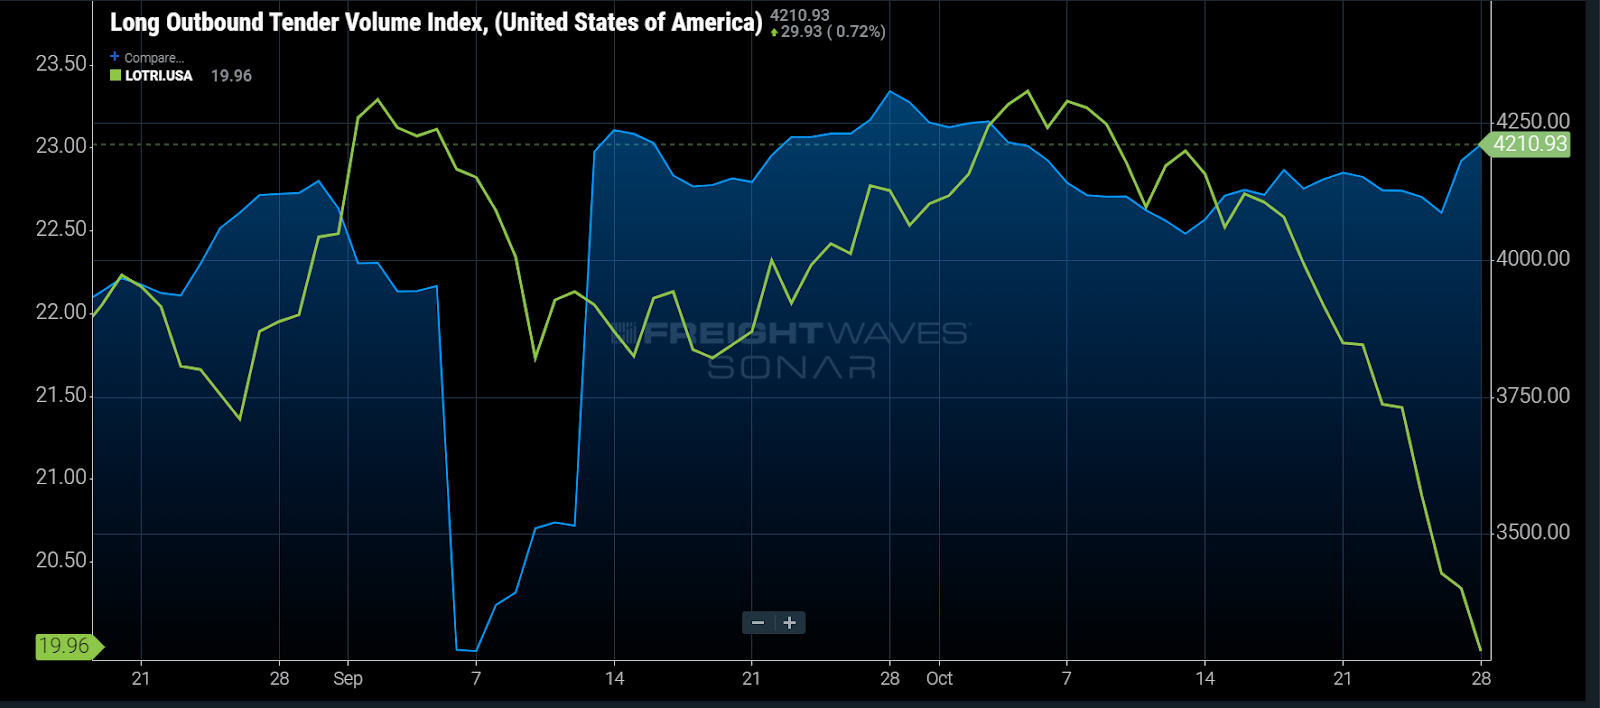
Accepted tender volumes (OTVI – (OTRI x OTVI)) have increased over 3% since Sept. 1, while total tender volumes (OTVI) have declined just over a percent. Accepted loads moving more than 800 miles have increased 10% over the same time period, accounting for a large portion of the upward move.
Basically, declining rejections in long-haul freight are contributing the most to the recent drop in rejection rates, which means those rates are much more attractive than they once were.
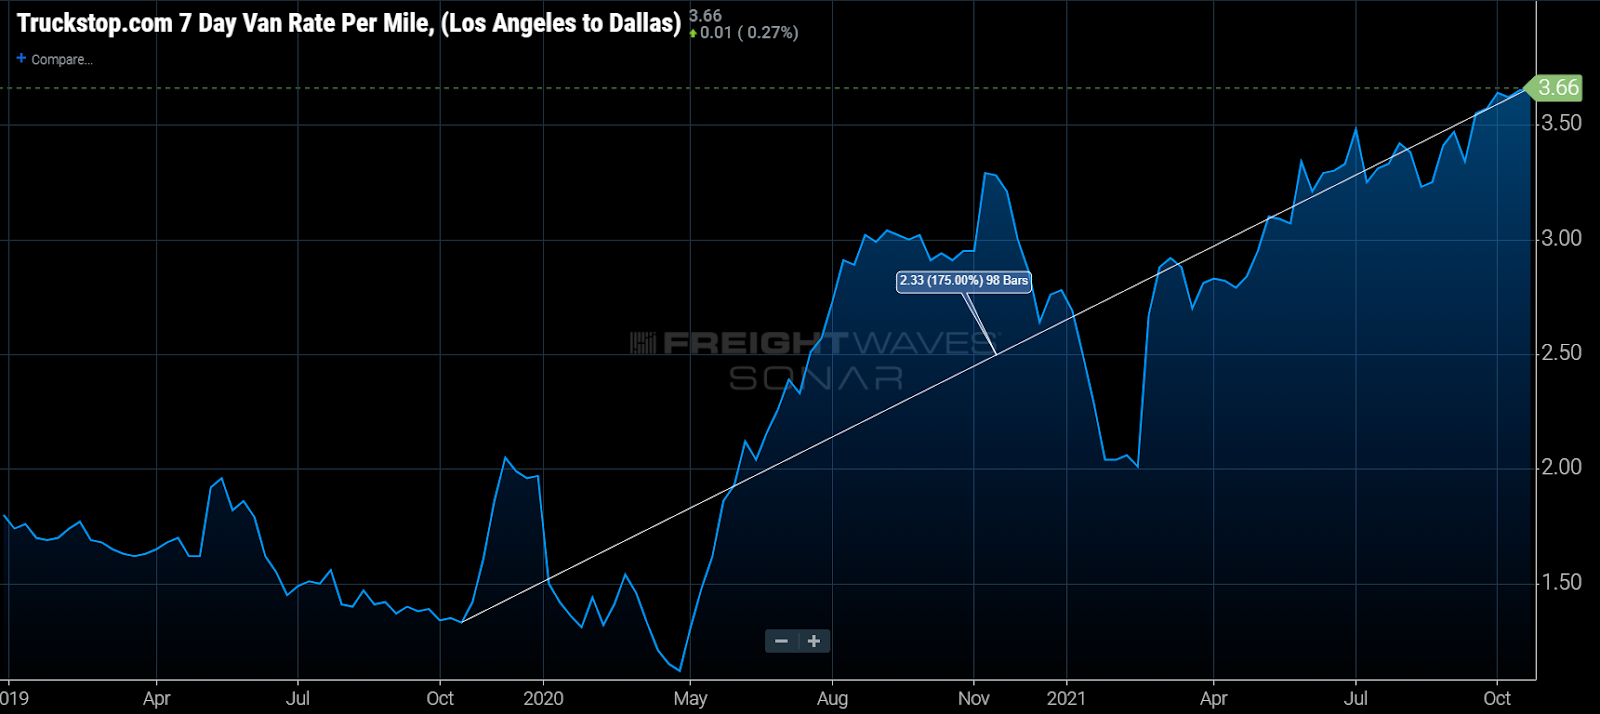
While the declining rejection rate may seem like good news to shippers, it is coming at severe cost. The Southern California markets of Los Angeles and Ontario account for nearly 9% of all long-haul tender volume in the U.S. at the moment. Spot rates from Los Angeles to Dallas are $3.66 per mile, which is 2.7x the rate at this point in 2019. If costs were neutral (they are not) then a carrier could drive a round trip and make more profit than it did going one way two years ago.
Assuming this origin has taken some of the largest rate increases in the country based on this data, it may be more shocking that rejection rates are still as high as they are.
About the Chart of the Week
The FreightWaves Chart of the Week is a chart selection from SONAR that provides an interesting data point to describe the state of the freight markets. A chart is chosen from thousands of potential charts on SONAR to help participants visualize the freight market in real time. Each week a Market Expert will post a chart, along with commentary, live on the front page. After that, the Chart of the Week will be archived on FreightWaves.com for future reference.
SONAR aggregates data from hundreds of sources, presenting the data in charts and maps and providing commentary on what freight market experts want to know about the industry in real time.
The FreightWaves data science and product teams are releasing new data sets each week and enhancing the client experience.
To request a SONAR demo, click here.
Supply Chain AI Symposium
Past the hype. Join operators, founders, and enterprise leaders figuring out how to deploy AI in supply chain.
F3: Future of Freight Festival
Industry-defining keynotes, rapid-fire technology demos, and industry leaders networking in experiences across Chattanooga - plus the inaugural F3 Awards Dinner featuring the FreightTech and Shipper of Choice reveals.
Past the hype. Join operators, founders, and enterprise leaders figuring out how to deploy AI in supply chain.
The Old Post • Chicago, IL Register NowIndustry-defining keynotes, rapid-fire technology demos, and industry leaders networking in experiences across Chattanooga - plus the inaugural F3 Awards Dinner featuring the FreightTech and Shipper of Choice reveals.
The Signal at Chattanooga Choo Choo • Chattanooga, TN Register Now