

Chart of the Week: Outbound Tender Rejection Index, Van Contract initial reporting average base rate per mile – USA SONAR: OTRI.USA, VCRPM1.USA
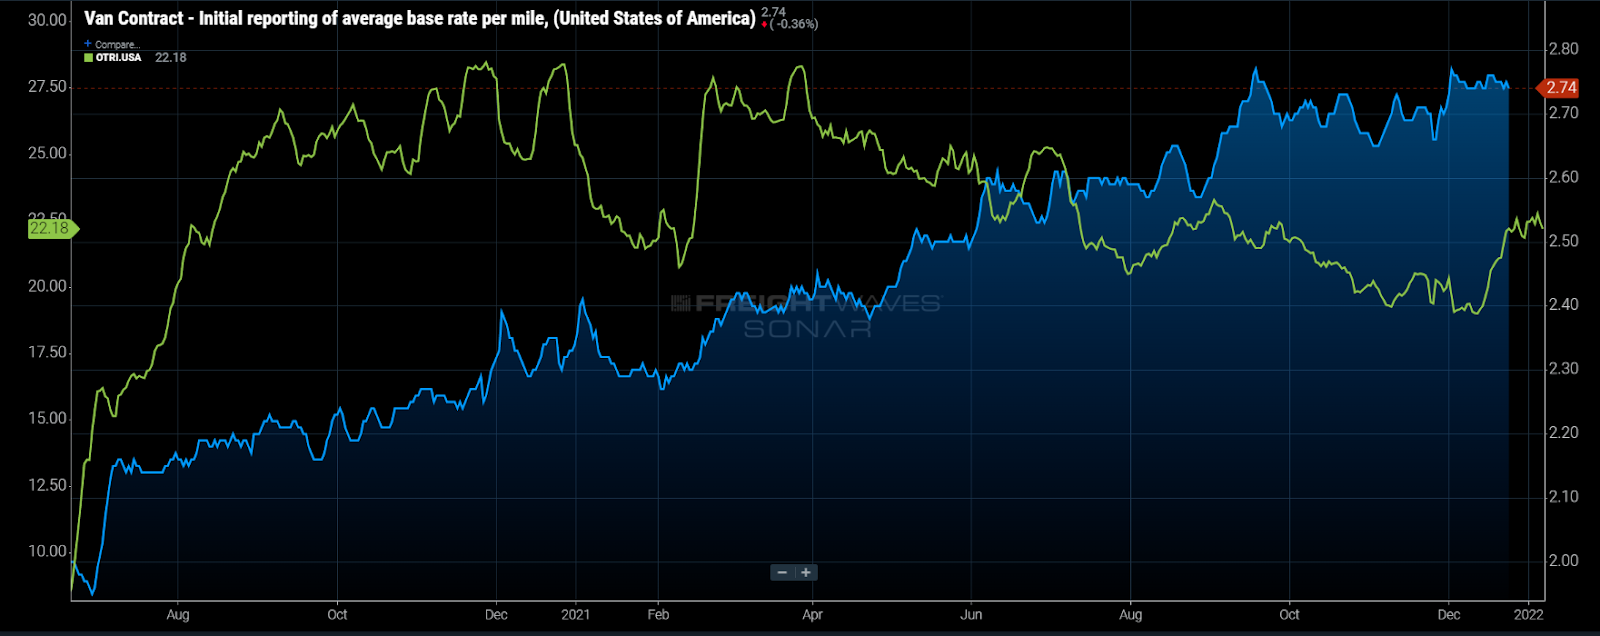
The national Outbound Tender Rejection Index (OTRI) that measures the percentage of electronic requests for truckload capacity from shippers that carriers rejected pushed back over 22% over the Christmas holiday period, despite the fact that contract rates have increased approximately 17% over last year. Simply put, these rejections cost a lot more than they did a year ago and it is unexpected to see them persist at this level this far beyond the holidays.
The OTRI is at its simplest form a measure of carrier compliance for contract or long-term rate agreements. When capacity is readily available as it was in 2019, rejection rates average around 6% for the year. Daily rejection rates averaged around 23% in 2021, an extremely tight year for trucking.
Prior to the Christmas holiday period, it seemed as though the truckload capacity situation was slowly improving as national rejection rates appeared to be on a downward trend, falling from over 23% around Labor Day to near 19% on Dec. 12 before rising seasonally. As of Thursday, however, the OTRI had only recovered 30 basis points off the Dec. 27 value to 22.18%, with higher values observed on Tuesday.
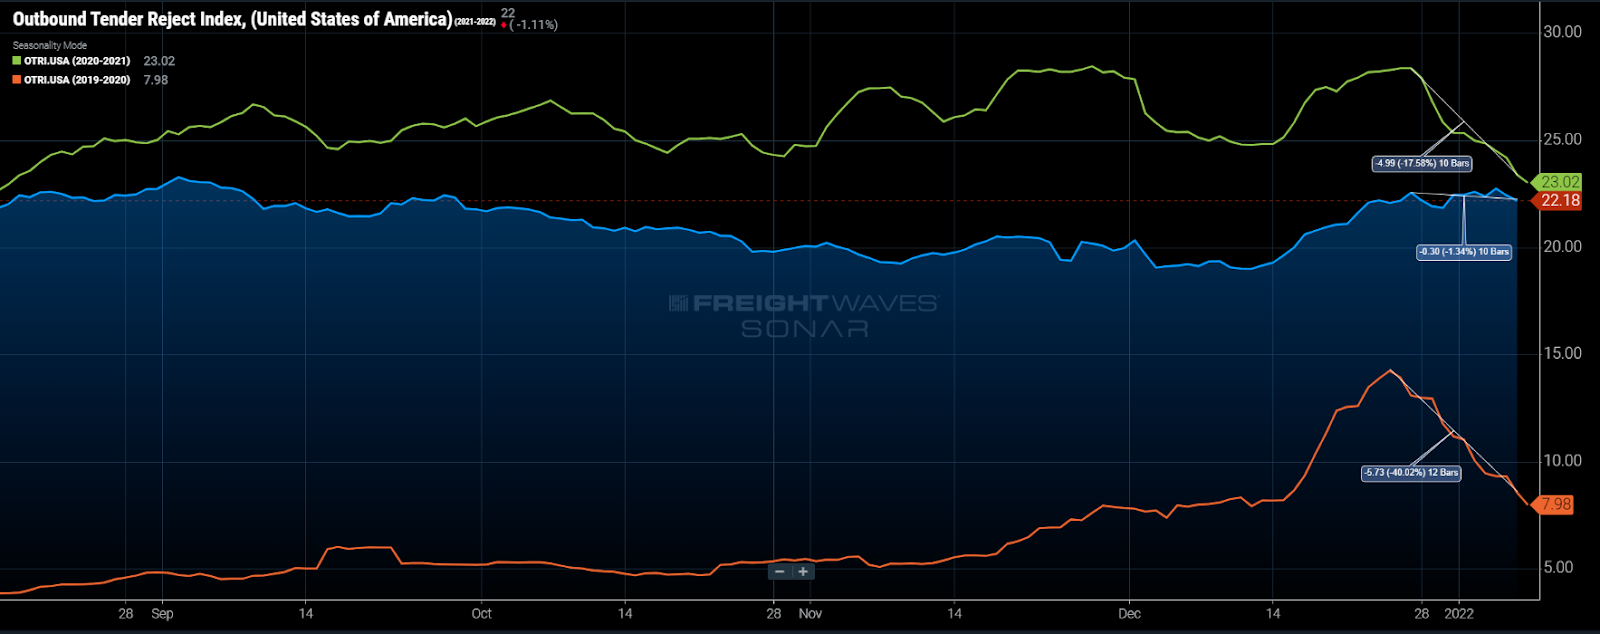
It is typical to see rejection rates rise heading into Christmas, but it has never remained elevated for this long after the holiday. It is typical to see peak holiday values around Dec. 25 and then a sharp decline that persists through the new year.
Last year the OTRI peaked on Dec. 27 at 28.4% before dropping roughly 5 percentage points to 23.41% on Jan. 6. The drop was just as strong in pre-pandemic 2019, though the OTRI was at a much lower level.
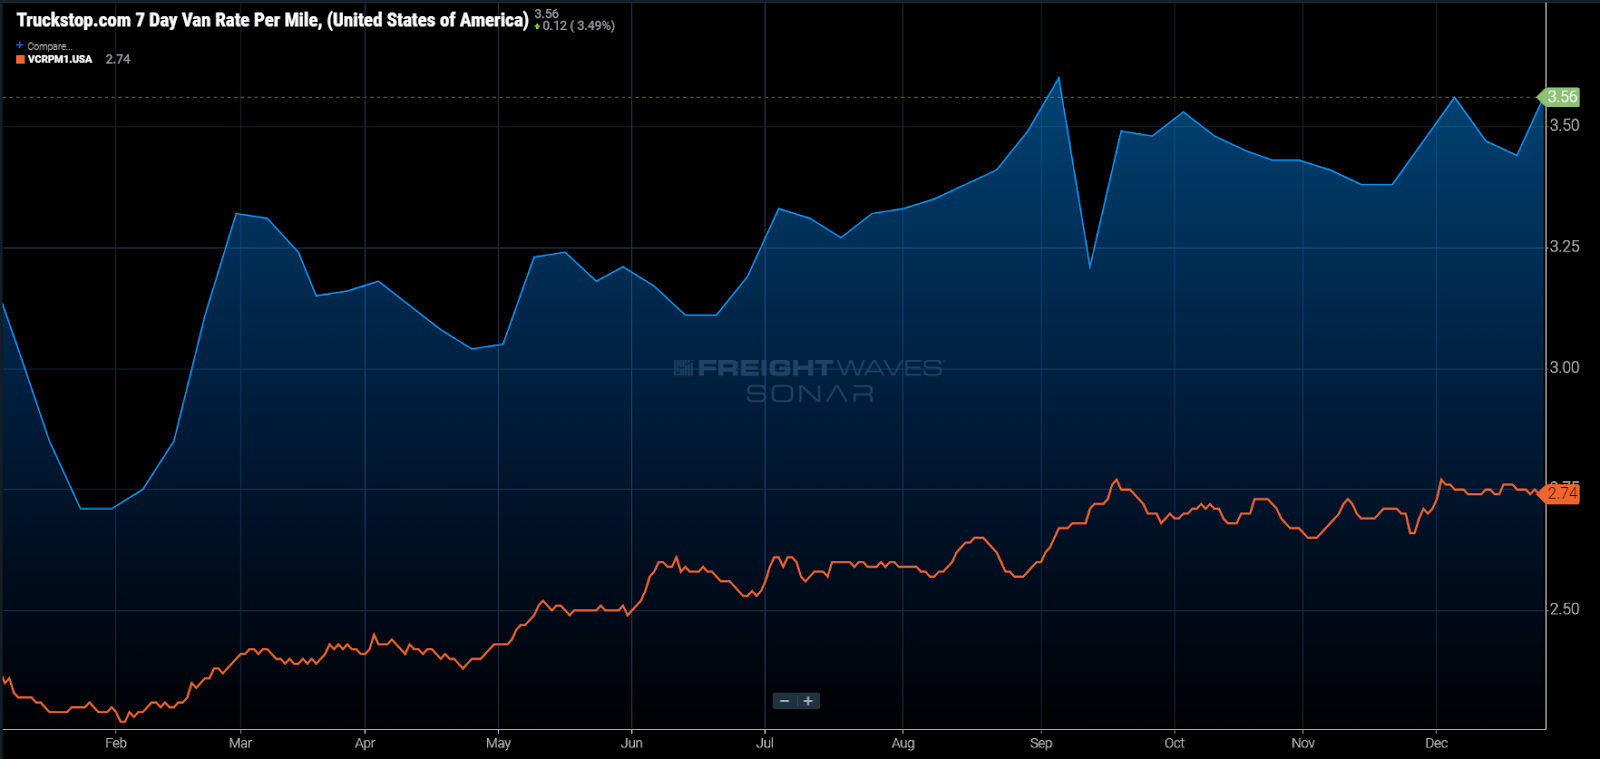
What isn’t clear when looking at the OTRI is the cost of the rejections now versus the previous two years. Looking at the FreightWaves contract rate index (VCRPM1) for van truckload moves — derived from $20 billion in annual spend over the past five years — the average cost per mile has increased an unprecedented 17% over the past year.
To put this in perspective, the index showed a 1% decline from December 2018 to 2019, a much softer year for trucking demand before the pandemic. Rates increased 15.5% during 2020. It is important to note that this data set excluded loads moving less than 250 miles, but it can still be influenced by changing lengths of haul as rates increase for shorter moves in general.
At a granular level, increasing contract rates improve carrier compliance and service as this reduces the chances of being outbid by other shippers either by contract or on the more transactional spot market. Carriers tend to favor their more consistent customers with long-term rate agreements even if the spot market offers higher rates.
The spike in truckload demand has left carriers underprepared and turned the spot market into a Wild West environment with shippers consistently offering rates 20-30% above contract just to secure capacity. So even though shippers are paying significantly more on their contracted freight, carriers are still unable to cover the persistent demand, which currently exceeds last year.
At this point, it would be fallacy to try and apply much history forward in the truckload market. It is clear that the economy and society are still in a transitional state, meaning that behavior patterns are still changing. The fact that carriers are still turning down 22% of their contracted loads as of Jan. 6 with such strong increases means that we cannot expect the typical January slowing and will have to continue to evaluate the freight market on a more regular basis.
About the Chart of the Week
The FreightWaves Chart of the Week is a chart selection from SONAR that provides an interesting data point to describe the state of the freight markets. A chart is chosen from thousands of potential charts on SONAR to help participants visualize the freight market in real time. Each week a Market Expert will post a chart, along with commentary, live on the front page. After that, the Chart of the Week will be archived on FreightWaves.com for future reference.
SONAR aggregates data from hundreds of sources, presenting the data in charts and maps and providing commentary on what freight market experts want to know about the industry in real time.
The FreightWaves data science and product teams are releasing new data sets each week and enhancing the client experience.
To request a SONAR demo, click here.