
Historic contract rate inflation will support a longer tail for efficient carriers
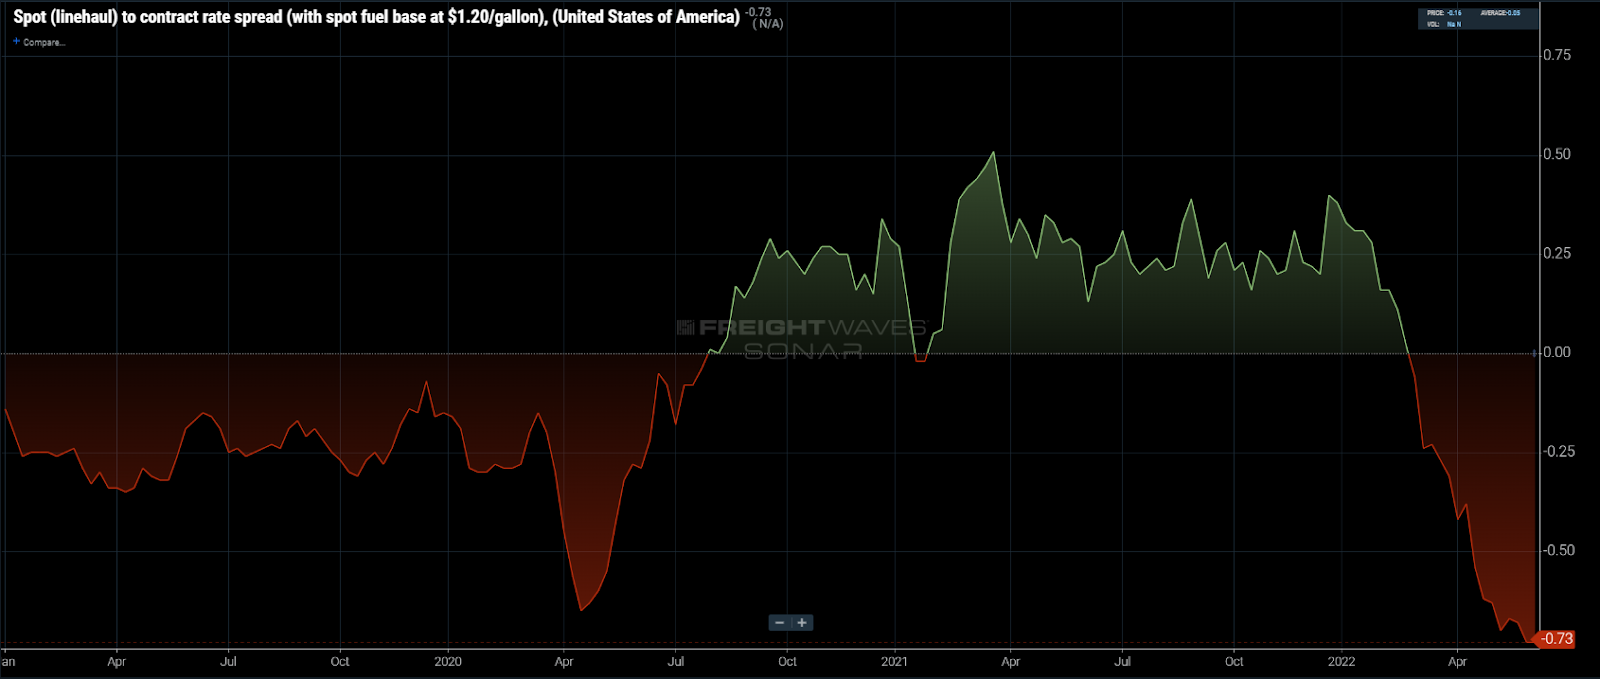
Chart of the Week: Spot to Contract Rate Spread (with spot fuel base at $1.20/gal) – USA SONAR: RATES12.USA
The spread between long-term contract truckload rates and spot rates has expanded beyond early pandemic amounts when demand for capacity dropped to its lowest level since the great recession in 2009. While this data point may paint a bleak picture for truckload carriers in general, this environment favors the ones that have focused on operational efficiency over pure growth in the past two years.
Contract rates for dry van have grown nearly 50% since July 2020, according to FreightWaves’ contract rate database built on approximately $100B worth of invoice data. The increase was attributed to shippers competing for priority with their carriers by bidding long-term rates higher on a faster cadence to avoid having to source capacity from daily spot market negotiations, which were as much as 20% above contract.
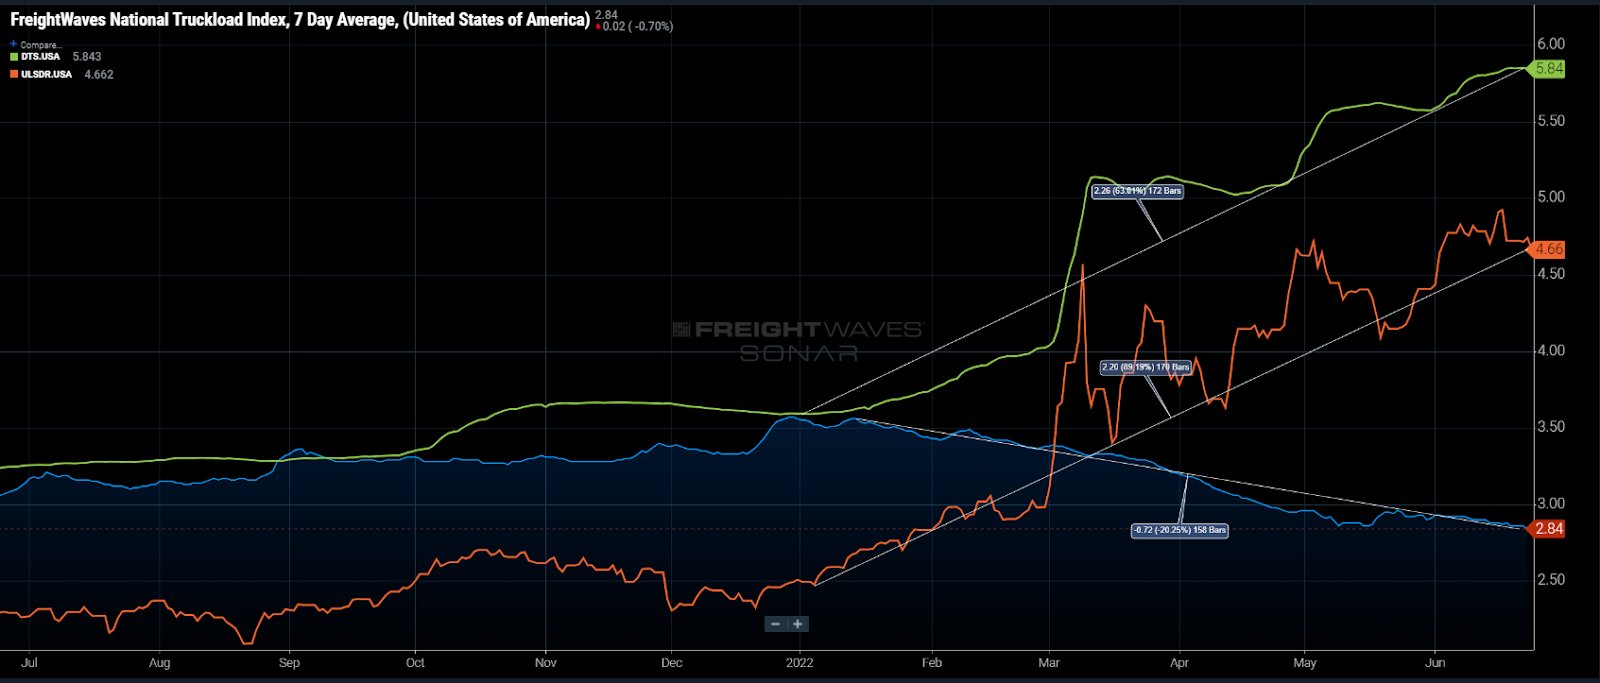
Truckload spot rates have plummeted 20% since early January, but that is not the full story. Spot rates include fuel costs, which have increased 60% to 90% over the same period of time. This means carrier margins have eroded much faster than the nominal rate implies, thanks to inflation in operating costs.
The takeaway from this is that the spot market has become a place of desperation for carriers to bid against each other for freight, while the contracted freight market is now an extremely profitable safe haven.
For now, contracted rates are still enjoying a nice padding of revenue over costs where carriers can still have room for inefficiency. Revenue cures just about any ill. Inevitably, contracts will go into a correction on some level. Carriers who have built their networks for the long run and can handle some decline in demand will have the best chances for success.
Operational efficiency is ingrained in the mindset of most carriers, but the recent market has eroded some of that mentality, especially for the ones that grew increasingly dependent on transactional spot freight.
Traditionally, carrier growth has centered around growing assets and attaining market share. Rarely does an environment like the pandemic era present itself where margin expansion is possible, thanks in large part to the fragmentation of for-hire carriers.
Many larger fleets sold their equipment for peak value and stockpiled cash for a rainy day. This was a good move, but it still doesn’t make the carrier resilient indefinitely. Targeted customer growth that maintains a balanced network and hedges carriers against too much exposure to a single industry or commodity remains the best strategy.
Carriers who invest in technology will also be better positioned as it allows them to automate processes that are freezing up human capital for more complex activity. It also gives them quick access to information so they can respond to changing conditions more quickly.
The bottom line is that fleets that built their business on operational efficiency with a long-run strategy in mind over the past two years are in an incredibly strong position compared to many other providers that chose revenue growth or fleet expansion as priorities.
Being a carrier is – and will continue to be – a game of endurance favoring the marathoner over the sprinter. While the past few years have brought out the sprinters, the next few will favor the carriers built for the long haul.
About the Chart of the Week
The FreightWaves Chart of the Week is a chart selection from SONAR that provides an interesting data point to describe the state of the freight markets. A chart is chosen from thousands of potential charts on SONAR to help participants visualize the freight market in real time. Each week a Market Expert will post a chart, along with commentary, live on the front page. After that, the Chart of the Week will be archived on FreightWaves.com for future reference.
SONAR aggregates data from hundreds of sources, presenting the data in charts and maps and providing commentary on what freight market experts want to know about the industry in real time.
The FreightWaves data science and product teams are releasing new datasets each week and enhancing the client experience.
To request a SONAR demo, click here.