
The cost of fuel has compounded margin erosion on the trucking spot market
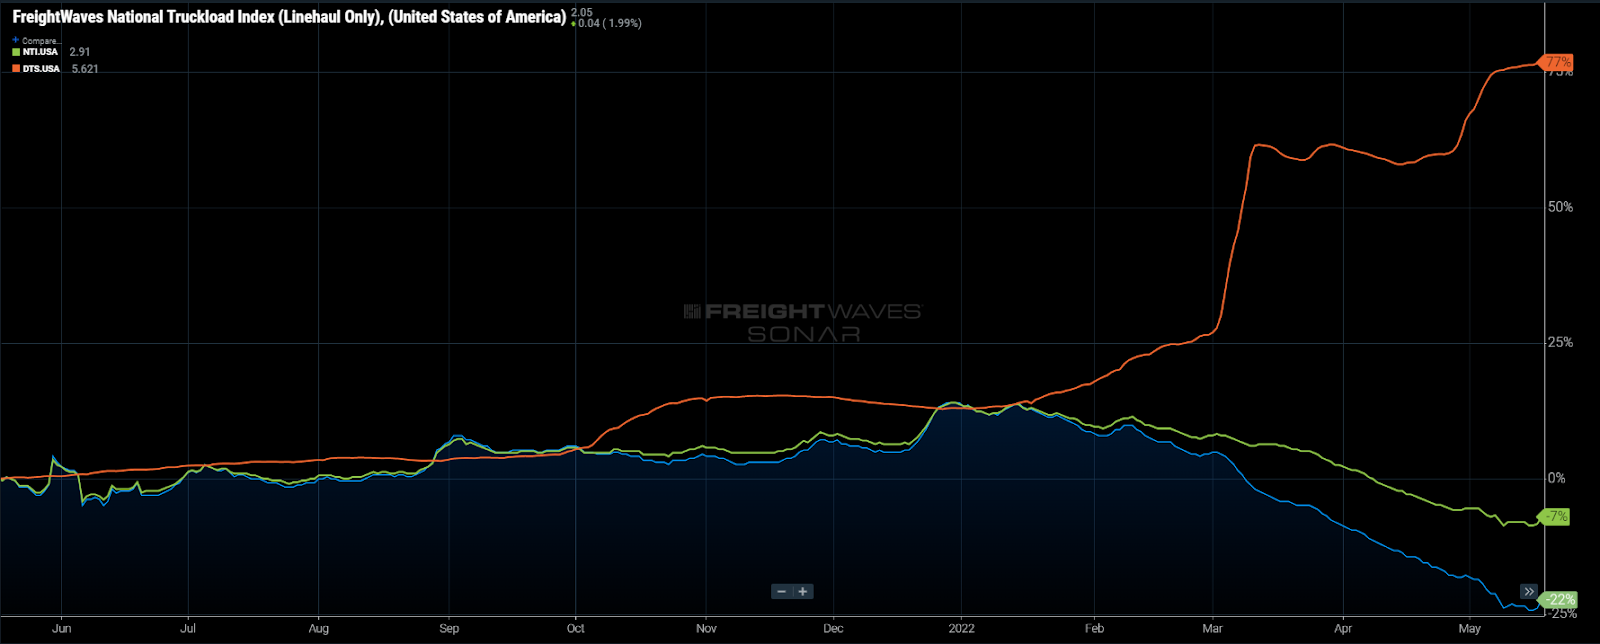
Chart of the Week: National Truckload Index (Linehaul Only), National Trucking Index, Diesel Truck Stop Price per gallon – USA SONAR: NTIL.USA, NTI.USA, DTS.USA
Truckload spot rates for dry van freight (NTI) have plummeted 18% since the start of the year, but if you remove fuel (NTIL), it nearly doubles to 32%.
From an annualized perspective, those numbers moderate to -7% and -22%, respectively, but are still impressive nonetheless. The big takeaway from all this is that carriers that rely on spot market freight have seen their margins erode faster than the rates alone imply.
This week’s chart illustrates how fuel costs (DTS) have seemingly not had much influence on keeping market rates afloat.
Normally, spot rates and cost inflation move in a similar direction as they are inherently connected. This is an extremely rare occurrence when operating costs are moving in polar opposition to the market rate. So what are the implications?
The truckload spot market has four primary functions for shippers:
- To find capacity when contracted carriers are unable to provide it.
- To cover a purely transactional move that occurs too inconsistently to have a contracted rate.
- To get service outside of a normal expectation — i.e., expedited.
- To get capacity covered at a discount to the contracted rate.
Finding capacity outside of the contracted provider has been the main driver of spot market activity over the past two years. This is supported by a tender rejection rate averaging above 20%.
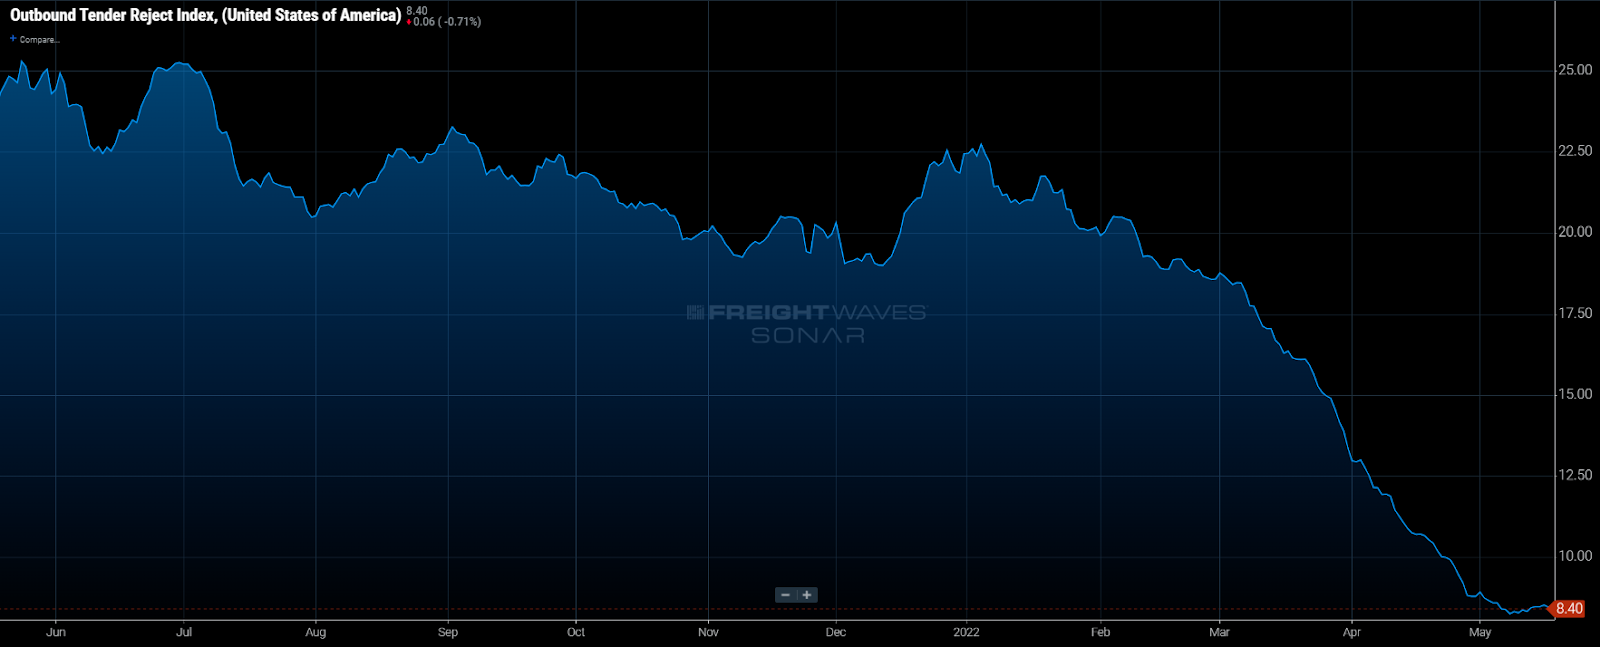
Tender rejections are a measure of carrier compliance, whereas high rates of rejection indicate carriers are either unwilling or unable to provide capacity for a contracted customer at a previously set rate. A national rejection rate around 5% is indicative of a relatively loose trucking market.
Contracted freight is heavily biased toward the larger shippers and carriers as they have the scale and infrastructure that makes having set rates more efficient. Smaller fleets get an opportunity to haul these loads when the rejection rates start to climb. Essentially, they get the overflow freight.
Small carriers grab a lot of these “rejected” loads on the spot market as they are not large enough to form ongoing relationships with some of the largest shippers. Prior to the pandemic consumption boom, they were largely only able to take advantage of this overflow around seasonal booms when larger carrier networks were disrupted.
Over the past two years smaller operations have become dependent on spot volumes and elevated rates. Even though there were few people who expected freight to move at such overheated levels forever, it is very difficult to know how to grow your operation sustainably in this environment.
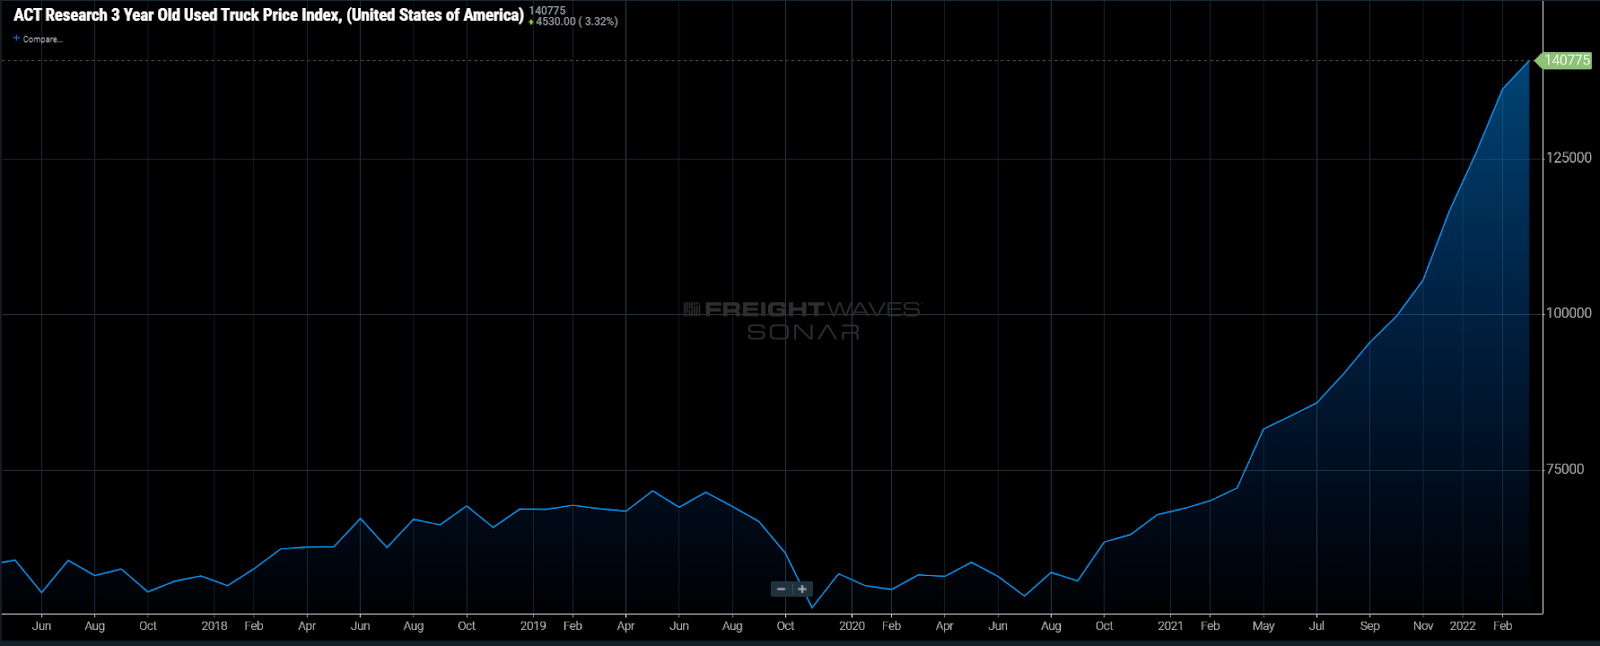
With equipment shortages prevalent, ironically due in part to the lack of equipment for transporting the raw materials for manufacturing, used truck prices for 3-year old units increased from $54,000 in July of 2020 to $140,000, according to ACT Research.
Small operators get a lot of their equipment on the used truck market due to lack of relationship with the OEMs and their affordability. They had to make the choice to stagnate or spend money to grow.
With many carriers making investment decisions based on an overheated and unsustainable market, they are now left exposed as the costs of operating continue to climb and the market for their service has dwindled significantly. The smaller operations are the most at risk for failure this year.
Larger fleets have taken a much different approach, with many larger carriers such as Heartland drawing the ire of the financial sector for selling older trucks for premiums and stockpiling cash, which now looks like a heads-up move. Employing a long-term strategy has put them in a decidedly better position to weather the storm if the market continues to deteriorate.
About the Chart of the Week
The FreightWaves Chart of the Week is a chart selection from SONAR that provides an interesting data point to describe the state of the freight markets. A chart is chosen from thousands of potential charts on SONAR to help participants visualize the freight market in real time. Each week a Market Expert will post a chart, along with commentary, live on the front page. After that, the Chart of the Week will be archived on FreightWaves.com for future reference.
SONAR aggregates data from hundreds of sources, presenting the data in charts and maps and providing commentary on what freight market experts want to know about the industry in real time.
The FreightWaves data science and product teams are releasing new datasets each week and enhancing the client experience.
To request a SONAR demo, click here.
Freight Fraud Symposium
Double brokering. AI deepfakes. Identity theft. Freight fraud is an existential threat to the industry. Get ahead of it.
Supply Chain AI Symposium
Past the hype. Join operators, founders, and enterprise leaders figuring out how to deploy AI in supply chain.
Future of Rail Symposium
Reshoring is rewriting freight demand. Join shippers, rail executives, and government officials to shape the next decade.
Double brokering. AI deepfakes. Identity theft. Freight fraud is an existential threat to the industry. Get ahead of it.
Rock & Roll Hall of Fame • Cleveland, OH Register NowPast the hype. Join operators, founders, and enterprise leaders figuring out how to deploy AI in supply chain.
The Old Post Office • Chicago, IL Register NowReshoring is rewriting freight demand. Join shippers, rail executives, and government officials to shape the next decade.
The Signal at Chattanooga Choo Choo • Chattanooga, TN Register Now