
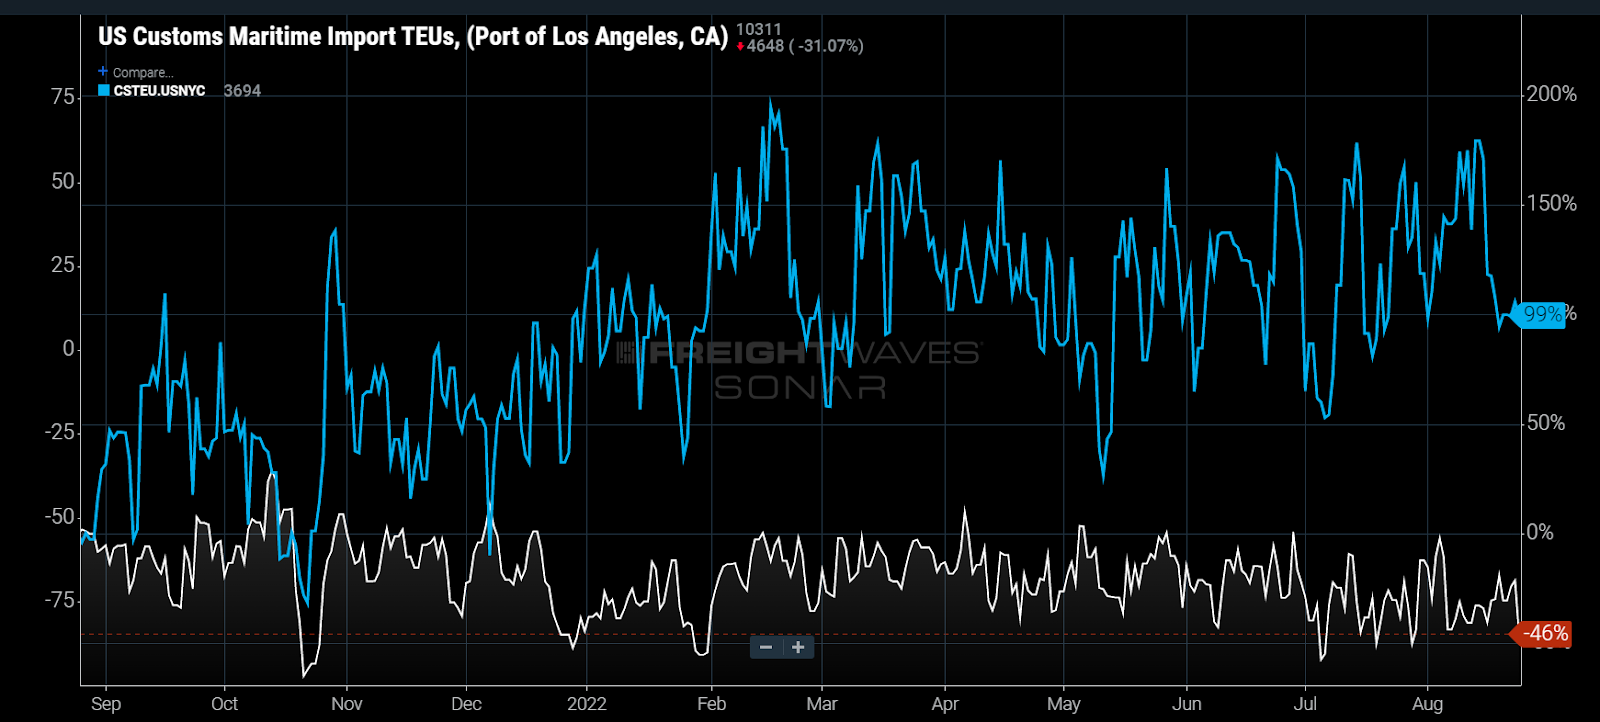
Chart of the Week: US Customs Maritime Import TEUs – Port of Los Angeles, Port of New York/New Jersey SONAR: CSTEU.USLAX, CSTEU.USNYC
The volume of TEUs clearing customs at the Port of New York and New Jersey has doubled versus this time last year, while import volumes have been cut in half at the Port of Los Angeles. Cost effectiveness is driving shippers to take advantage of the savings of going directly to the East Coast, where most of the consumption occurs. This action has led to a rapidly easing Southern California transportation market that had become the backbone of many carrier networks during the pandemic.
The average cost to ship a 40-foot container on the spot market from China to the West Coast was $15,900 on April 1 this year, according to the Freightos Baltic Exchange. The average rate for shipping a container from China to the North American East Coast was $17,200, making the difference — aka the Panama Spread — a marginal $1,300.
While both rates have fallen dramatically since then, thanks to lower aggregate demand, the spread between the two has also expanded to over $3,600 as shippers try to take advantage of the economic benefit of shipping direct to the East and avoiding the cost of surface transportation across the U.S.

The extra $1,300 is a fraction of the surface transportation cost for a shipper trying to move freight from Los Angeles to the Northeast, but $3,600 is still a good deal considering truckload costs are still well above this level. The current all-in spot rate from Los Angeles to Philadelphia is around $6,800, according to FreightWaves TRAC data.

Current intermodal spot rates suggest costs would be between $5,500 and $6,000 to ship by rail, which is still well above the discount shipping on the water.

This trend is peaking as long-haul freight demand normally starts to hit its stride post-Labor Day. This year there will be less cross-country freight that needs to be moved — a huge shift from what defined third quarters during the pandemic era. Los Angeles’ capacity has already eased significantly this year, with spot rates and tender rejections falling throughout the year.
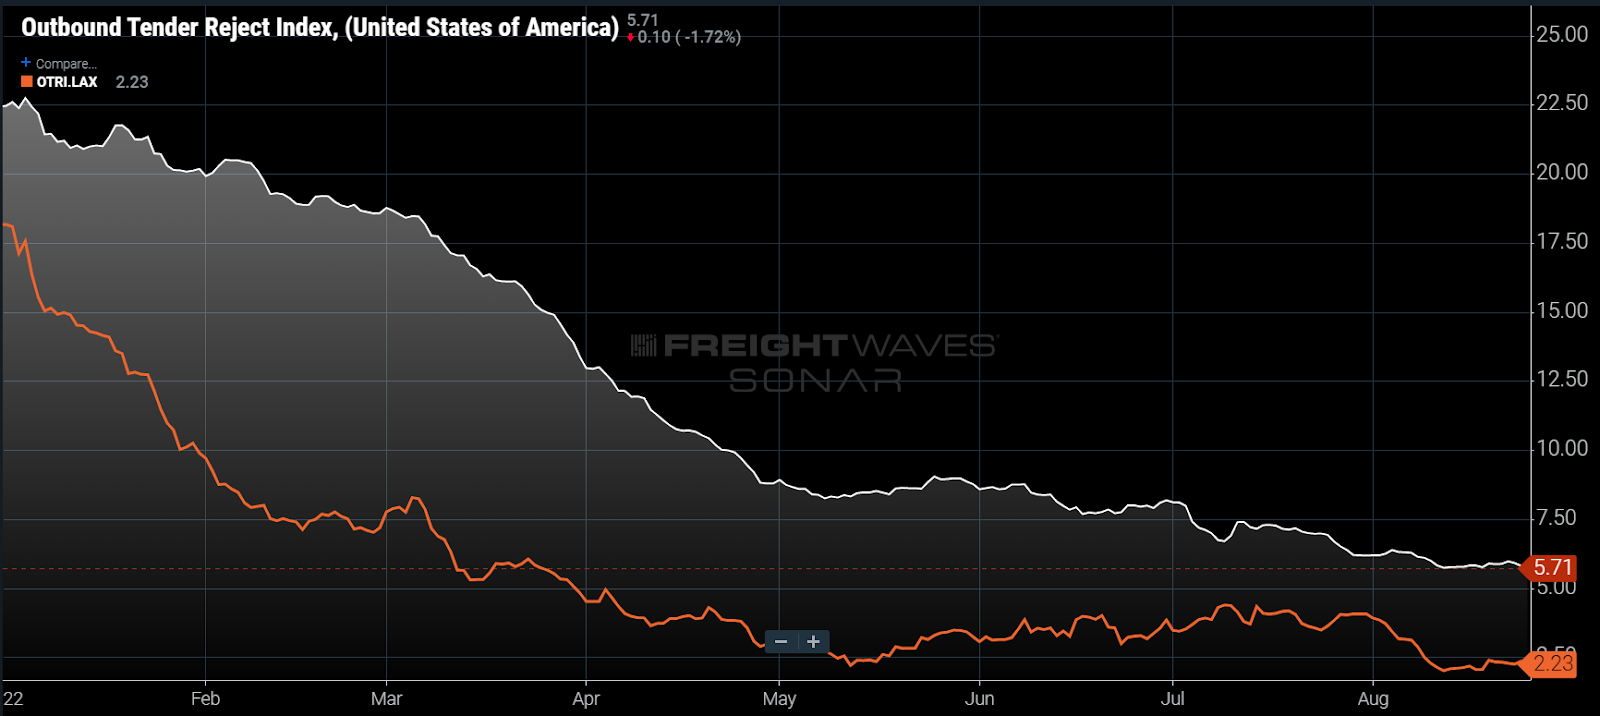
Currently, Los Angeles’ outbound rejection rate is near an all-time low at 2.2% and over 3% below the national average, implying it is one of the softest markets in the U.S. With many carriers having built networks around strong demand and pricing out of Southern California, this may be the first quarter they feel significant impact from the changing environment.
Overall truckload demand has been in decline since March, with the majority of that falling from the spot market. Intermodal volumes have been somewhat resilient in comparison, but a large portion of that is due to the favorable comps from the summer of 2021, when services were shut down to deal with railhead congestion and international container shortages.
In the long run, this appears to be a relatively short-lived event that will be a blip in the transitional state of the freight economy. East Coast port infrastructures have been overloaded thanks to the shift. But upstream order volumes suggest that trend is once again changing, with the Inbound Ocean TEUs Volume Index for the ports of New York/New Jersey and Savannah both showing near-50% drops in TEU booking volumes since May.

While import booking volumes are still above 2019 levels for the two largest ports on the East Coast, the trend suggests that this will not be the case for long. The past two years have been extraordinarily active for ocean shipping. Even as demand wanes, backlogs, congestion and other operational fallout is preventing an equally fast return to pre-pandemic efficiency. Domestic transportation providers will still struggle to find consistency in volumes until procurement becomes more reliable.
About the Chart of the Week
The FreightWaves Chart of the Week is a chart selection from SONAR that provides an interesting data point to describe the state of the freight markets. A chart is chosen from thousands of potential charts on SONAR to help participants visualize the freight market in real time. Each week a Market Expert will post a chart, along with commentary, live on the front page. After that, the Chart of the Week will be archived on FreightWaves.com for future reference.
SONAR aggregates data from hundreds of sources, presenting the data in charts and maps and providing commentary on what freight market experts want to know about the industry in real time.
The FreightWaves data science and product teams are releasing new datasets each week and enhancing the client experience.
To request a SONAR demo, click here.
Supply Chain AI Symposium
Past the hype. Join operators, founders, and enterprise leaders figuring out how to deploy AI in supply chain.
Future of Rail Symposium
Reshoring is rewriting freight demand. Join shippers, rail executives, and government officials to shape the next decade.
F3: Future of Freight Festival
Industry-defining keynotes, rapid-fire technology demos, and industry leaders networking in experiences across Chattanooga - plus the inaugural F3 Awards Dinner featuring the FreightTech and Shipper of Choice reveals.
Past the hype. Join operators, founders, and enterprise leaders figuring out how to deploy AI in supply chain.
The Old Post • Chicago, IL Register NowReshoring is rewriting freight demand. Join shippers, rail executives, and government officials to shape the next decade.
The Signal at Chattanooga Choo Choo • Chattanooga TN Register NowIndustry-defining keynotes, rapid-fire technology demos, and industry leaders networking in experiences across Chattanooga - plus the inaugural F3 Awards Dinner featuring the FreightTech and Shipper of Choice reveals.
The Signal at Chattanooga Choo Choo • Chattanooga, TN Register Now