
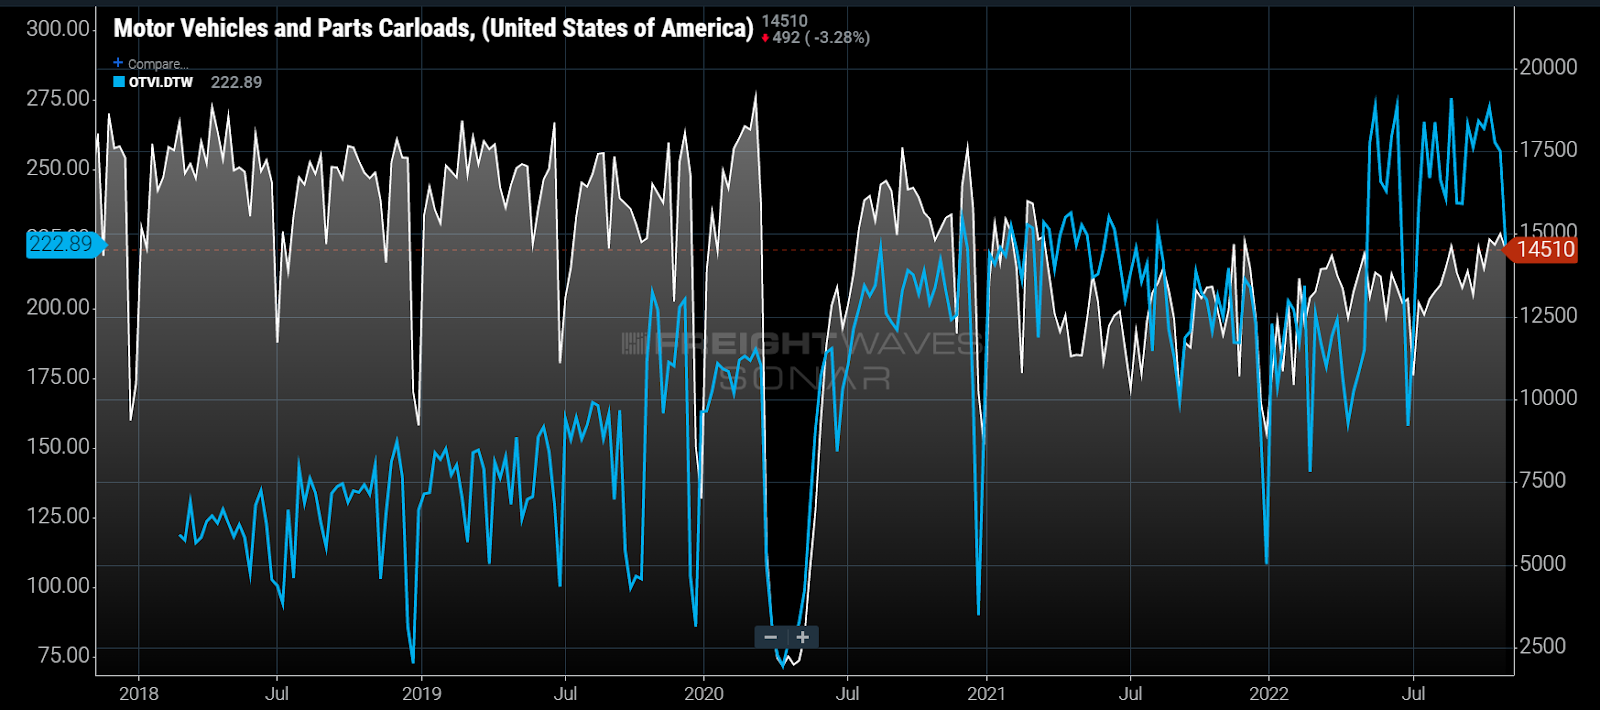
Chart of the Week: Motor Vehicles and Parts Carloads – USA, Outbound Tender Volume Index – Detroit SONAR: RTOMV.USA, OTVI.DTW
Freight volumes of automotive parts are still recovering as demand for many durable goods wanes. Is it sustainable?
Rail carloads for motor vehicles and parts averaged 11% higher year over year in October as part of a recovery trend that started earlier in the year. The Detroit Outbound Tender Volume Index (OTVI) shows a historical elevation in activity since this spring. The Detroit market is the best proxy for truckload automotive freight activity in the U.S. due to the large concentration of plants and suppliers. These movements contradict most of the data from other sectors and markets.
The retail sector was the first to go with consumer demand for goods waning. After the omicron variant diminished, the population started spending more dollars on travel and experiences.
And while electronics and furniture are items purchased for staying at home, motor vehicles enable the consumer to leave the house, something they have not been able to do as much of over the past two years.
Combine this with easing supply chain congestion, automotive manufacturers are now able to finish vehicles that have been awaiting completion. This sector is having a bit of a renaissance with growing demand for electric vehicles as well.
The average age of cars hit new highs earlier this year as consumers held on to their vehicles after driving less during the pandemic. The reasons are not entirely clear, but some of that trend may be reverting.
Similar mechanisms are at play for commercial vehicles. Truck OEMs are also seeing lagged demand recovery as Class 8 orders hit all-time highs in September, according to ACT Research. Carriers that have built up cash thanks to a booming market have also let their fleets age as new equipment has not been as available.
While earnings have been somewhat mixed for many consumer vehicle manufacturers, their revenues have been largely positive. Ford (NYSE:F) reported a 10% rise in revenue in Q3 even though its earnings were hindered by supply and investment issues.
Ford and GM (NYSE: GM) cited double-digit growth in new vehicle sales this past quarter. Even though Ford’s growth was lower than expected, it is an example of how the automotive sector has yet to feel the same decline in demand as the retail sector.
While this particular segment of the economy seems somewhat immune to the overriding direction of the economy for the moment, their executive teams wanted to temper expectations for the upcoming year due to more challenging consumer conditions.
The lesson for transportation providers who work with the auto sector is simply to take advantage of the volume while it lasts. Near-term demand still looks good and supply challenges will still persist into 2023. EVs may provide a softer landing for this sector as well. But the long run outlook has weaknesses.
Consumers are going back to some bad spending habits by overextending themselves. Auto loan delinquencies are around 10-year highs. Ultimately, the health of this sector depends on the fiscal health of the consumer.
A lot of automotive freight moves under dedicated agreements with somewhat specialized carriers, meaning there are high barriers to entry for newcomers. Opportunities to enter this space have increased over the past few years, but that window may be closing.
And while auto has been riding a latent wave of post pandemic activity, it is bound to come into closer alignment with the rest of the consumer economy.
About the Chart of the Week
The FreightWaves Chart of the Week is a chart selection from SONAR that provides an interesting data point to describe the state of the freight markets. A chart is chosen from thousands of potential charts on SONAR to help participants visualize the freight market in real time. Each week a Market Expert will post a chart, along with commentary, live on the front page. After that, the Chart of the Week will be archived on FreightWaves.com for future reference.
SONAR aggregates data from hundreds of sources, presenting the data in charts and maps and providing commentary on what freight market experts want to know about the industry in real time.
The FreightWaves data science and product teams are releasing new datasets each week and enhancing the client experience.
To request a SONAR demo, click here.
Freight Fraud Symposium
Double brokering. AI deepfakes. Identity theft. Freight fraud is an existential threat to the industry. Get ahead of it.
Supply Chain AI Symposium
Past the hype. Join operators, founders, and enterprise leaders figuring out how to deploy AI in supply chain.
Future of Rail Symposium
Reshoring is rewriting freight demand. Join shippers, rail executives, and government officials to shape the next decade.
Double brokering. AI deepfakes. Identity theft. Freight fraud is an existential threat to the industry. Get ahead of it.
Rock & Roll Hall of Fame • Cleveland, OH Register NowPast the hype. Join operators, founders, and enterprise leaders figuring out how to deploy AI in supply chain.
The Old Post Office • Chicago, IL Register NowReshoring is rewriting freight demand. Join shippers, rail executives, and government officials to shape the next decade.
The Signal at Chattanooga Choo Choo • Chattanooga, TN Register Now