

Early numbers on the first quarter are starting to trickle in from container shipping lines. They show a big step down from the fourth quarter, but they also confirm that earnings are still well above the pre-COVID “normal.”
Spot rates in the trans-Pacific eastbound market have collapsed, yet carriers continue to be shielded by annual contracts signed in 2022. Meanwhile, spot rates in the trans-Atlantic westbound market remain much higher than they were prior to the pandemic.
Average revenue per forty-foot equivalent unit — the big driver of container shipping net income — remains higher than it was before 2020.
Cosco and OOCL
Cosco, the world’s fourth-largest liner operator, reported Tuesday that it earned net income of 6.933 billion renminibi ($1 billion) in the first quarter of 2023, down 75% year on year (y/y). This is six times higher than Cosco’s net income in Q1 2019, pre-COVID.
Hong Kong-based OOCL, a subsidiary of Cosco, disclosed Thursday that it earned a global average of $2,503 in revenue per FEU in Q1 2023. That’s down 56% y/y and 31% sequentially versus Q4 2022. However, OOCL averaged $1,793 in revenue per FEU in the eight quarters during 2018 and 2019, prior to the pandemic-induced shipping boom. Its Q1 2023 revenue per FEU was 40% above that average.
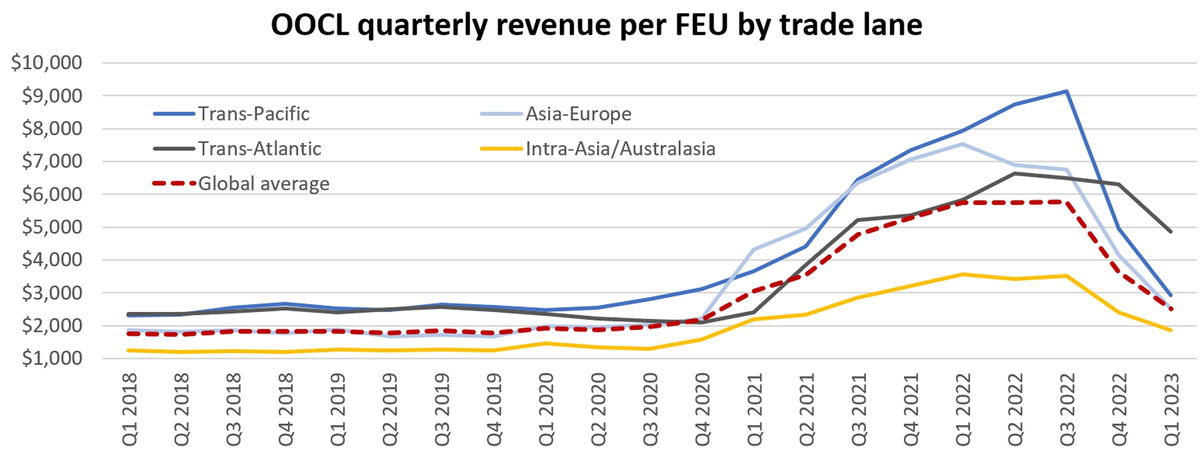
OOCL achieved $2,914 in revenue per FEU in the trans-Pacific lane in Q1 2023, down 63% y/y and 41% quarter on quarter (q/q) but still up 16% versus pre-COVID.
OOCL’s Asia-Europe trade averaged $2,524 per FEU, down 66% y/y and 39% q/q but 42% above the 2018-2019 average.
The carrier’s smallest market by volume — the trans-Atlantic — was its best performer. Q1 2023 trans-Atlantic revenue came in at $4,865 per FEU, 99% higher than pre-pandemic levels. Trans-Atlantic revenue per FEU was down 17% y/y and 23% q/q.
The intra-Asia trade is by far OOCL’s largest market by volume. In general, rates in this trade are lower than in the mainline east-west markets. OOCL posted revenue of $1,867 per FEU in Q1 2023 in the intra-Asia trade, down 48% y/y and 22% q/q but still up 51% from the 2018-2019 average.
Evergreen Marine
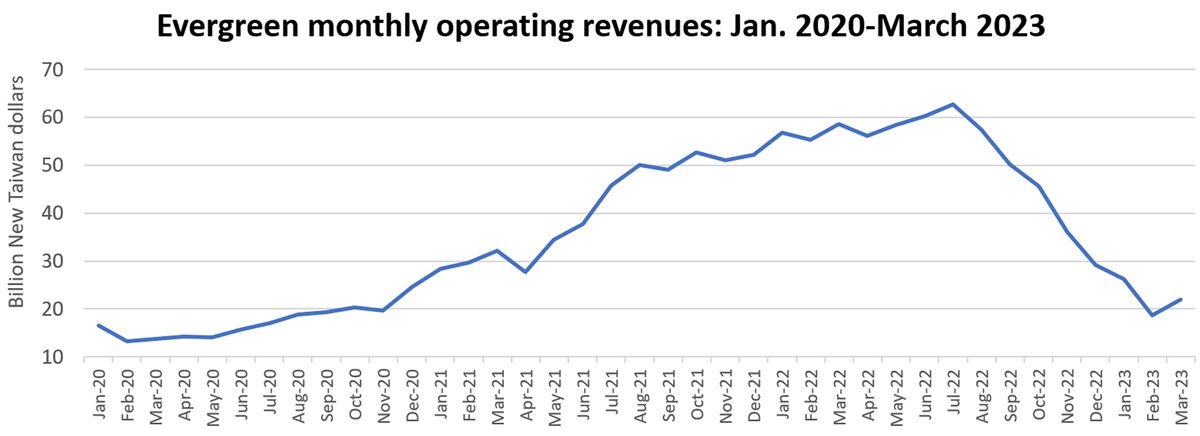
Taiwan’s Evergreen Marine, the world’s sixth-largest ocean carrier, reports monthly operating revenues. It disclosed its March revenues on Monday.
Evergreen’s operating revenues totaled 66.8 billion New Taiwan dollars ($2.2 billion) in Q1 2023. That’s down 61% y/y and 40% q/q, but still up 46% from Q1 2019, pre-COVID.

Looking at the monthly trend, OOCL reported operating revenues of 21.9 billion New Taiwan dollars in March.
This was up 17% from February, marking the first m/m increase since last July.
Freight rates fall at much slower pace
Indexes covering spot freight rates and long-term rates show continued deterioration, but at a much slower rate of decline than in the second half of 2022. Xeneta’s XSI Global index, which tracks long-term contract rates, fell just 0.5% in March versus February, to 345.87 points, “a slower pace than in previous months,” said Xeneta.
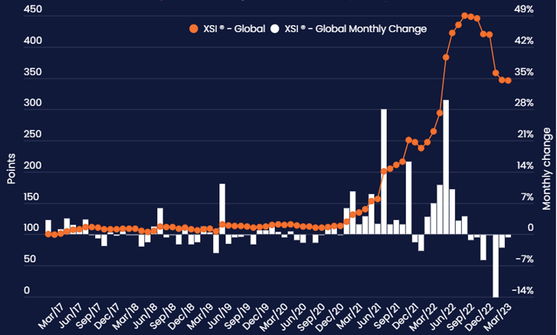
The XSI is down 24% from its all-time high in August 2022, however, it’s still up 30.5% y/y and is around three times pre-COVID index levels.
The Drewry World Container Index global composite — which measures average spot rates — was unchanged w/w for the week ending Thursday, at $1,710 per FEU.
The WCI global composite is down 79% y/y and is 84% below the all-time high of $10,277 per FEU reached in September 2022. Yet the index is still 20% above its 2018-2019 average, said Drewry.

Click for more articles by Greg Miller
Related articles:
- Mixed signals: Container shipping downturn not following the script
- Mighty fall: Container line profits plummet from historic peak
- LA-LB outlook darkens as labor unrest briefly shutters ports
- Crunch time for trans-Pacific container shipping contract talks
- Imports sink again as wholesale inventories remain bloated
- ‘Colossal’ tidal wave of new container ships about to strike