

Chart of the Week: Outbound Tender Volume Index – USA, Personal Consumption Expenditures – Durable Goods SONAR: OTVI.USA, PCE.DG
Truckload demand fell 17% in March and April of this year according to the national Outbound Tender Volume Index (OTVI), which measures the amount of electronic requests by shippers to their carriers for truckload capacity. The personal consumption expenditures index (PCE) for durable goods reported by the Bureau of Economic Analysis continues to show growth in spending.
If you were to adjust for inflation, however, this value would be on a downward trend since last year. This week’s chart illustrates the overwhelming demand that started this economic cycle has waned, and what is left is an inflationary mess caused by supply side constraints.
So what does this mean and why is it important?
Most of the economic policy in America is based on either stimulating or reducing demand. That is what the economic stimulus packages were meant to do and appeared to achieve. Right after the first checks were issued in mid-April 2020, demand appeared to increase immediately.
Another round of stimulus checks were issued in December 2020, which also appeared to give consumers another boost as spending appeared to slow down. These effects appear to be clear-cut in the increasing OTVI and PCE values.
Looking at the dollar amounts, which the PCE measures, does not reveal the full story. Inflation makes using aggregate dollar amounts difficult as many commodities have experienced inflation at widely varying rates.
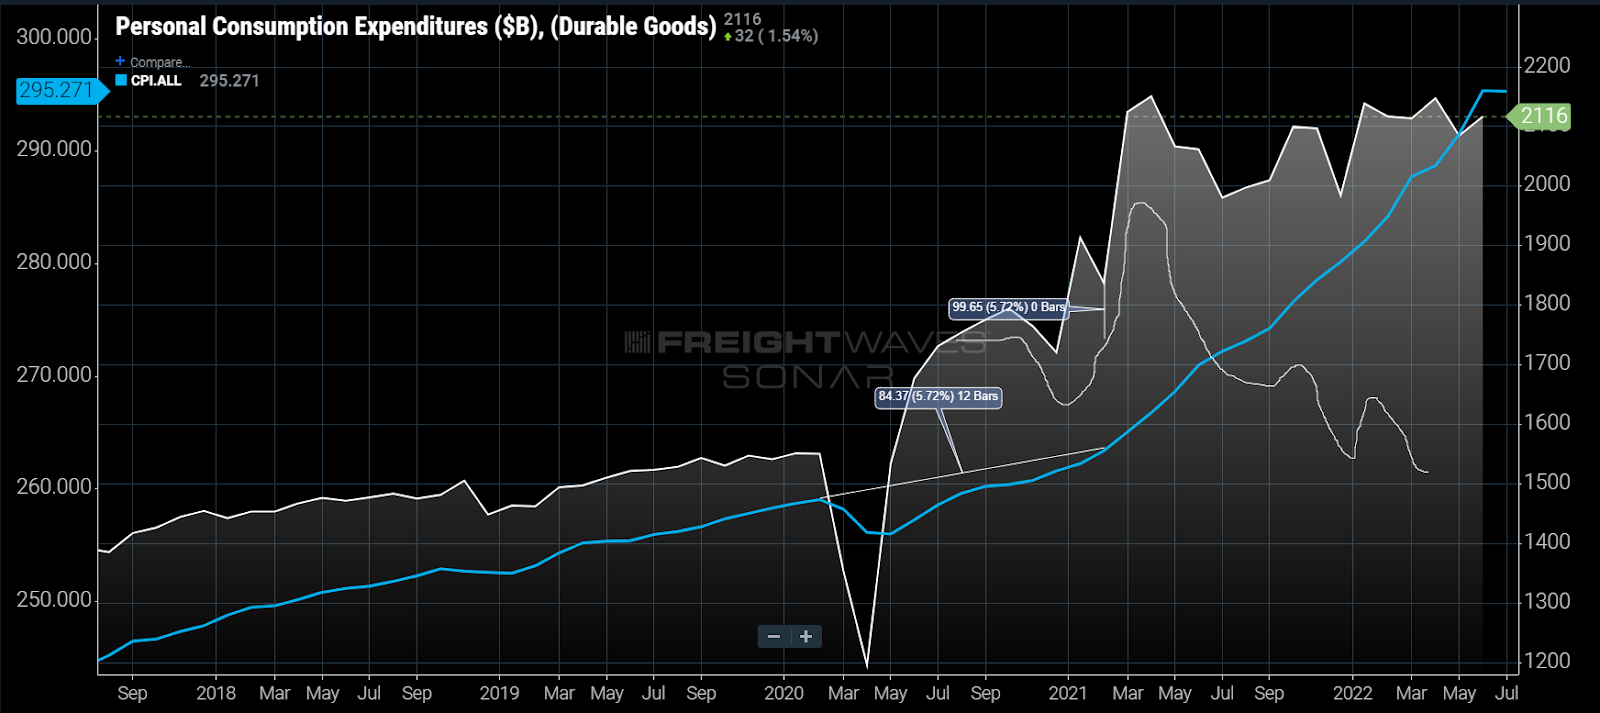
If we apply the consumer price index — which is admittedly not the most precise way of applying inflation — to the PCE just to get an idea of demand side direction, we can see that consumer demand started eroding potentially as early as Q2 in 2021.
In February 2021, winter weather invaded the Deep South and caused massive supply chain disruption. Both shipper and carrier activity stalled across the country as temperatures plummeted and froze the power grid in Texas. This weather event stalled production and shipping activity for about a week and had implications across the U.S.
The Texas freeze exacerbated the panic-buying mentality of supply chain managers across the country. The OTVI had fallen about 13% off its November 2020 high prior to the weather event but quickly increased over 14% after everything thawed.
Shippers began to order more than they needed at this point. With production and transportation capacity in question, companies switched to a just-in-case ordering strategy — compounding the pressure on supply chains.
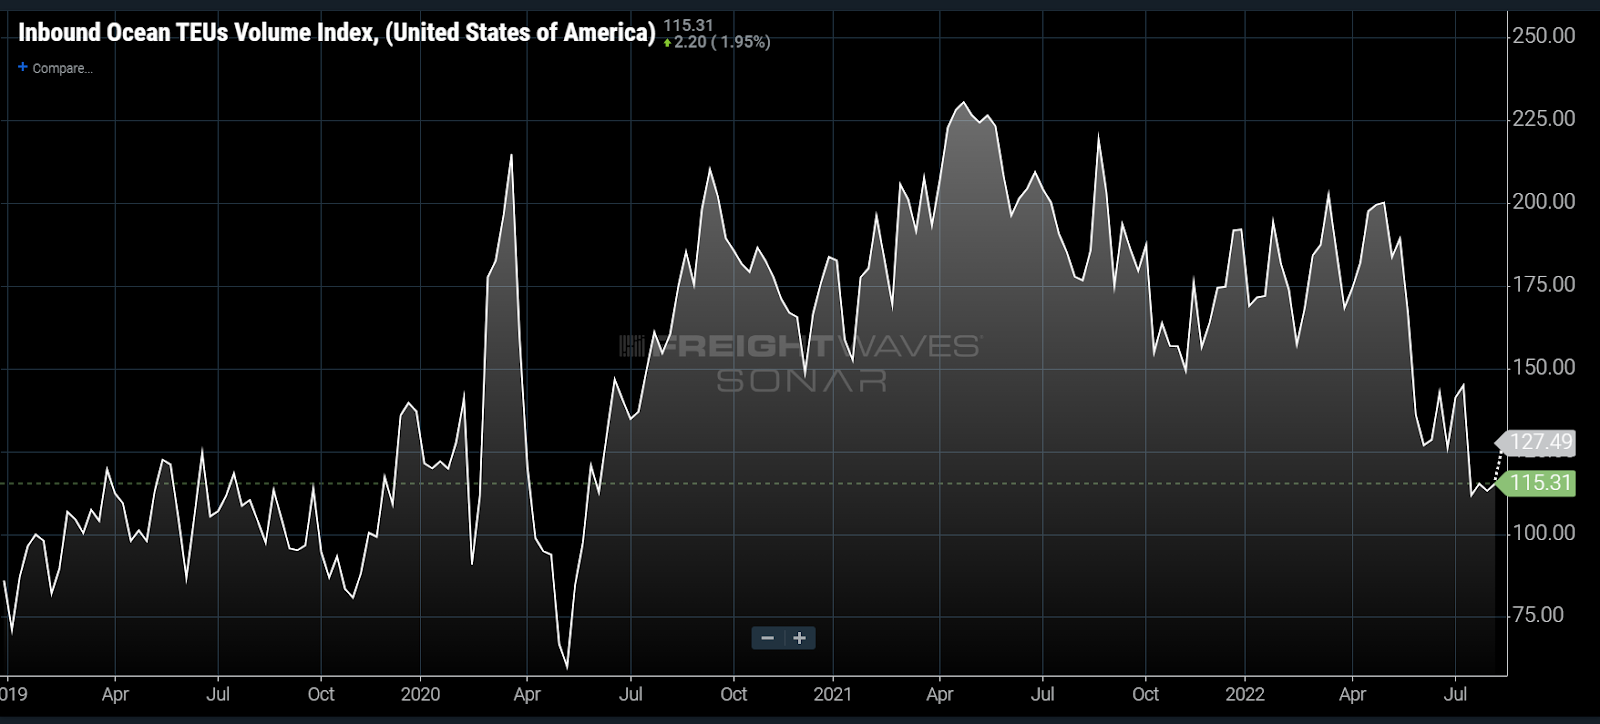
This overordering is illustrated in the Inbound Ocean TEUs Index (IOTI), which measures bookings of import twenty-foot equivalent volumes by companies. This index had its highest value in April 2021, but import booking volumes are now half of what they were at that time, with most of the decline occurring in May.
The primary reason for declining orders has been inventory growth. The Logistics Managers’ Index (LMI) indicated historical growth with values above 68 in every month of 2022. Anything above a value of 50 indicates expansion, with values over 70 representing exceptional expansion.

Inventory growth has also led to increasing demand for warehousing space, which has driven up costs. In this situation, demand erosion can aid inflation for goods as the supply of warehouses is lower than demand.
Warehousing costs are one of the smallest portions of supply side inflation. Labor shortages, demand for wage increases and a tumultuous geopolitical environment are now continuing to put upward pressure on the cost of goods and services globally.
The problem with supply side induced inflation is the fact the Federal Reserve has no direct influence over this side of the curve. It can incentivize companies to invest in supply chain improvements, but that takes a much longer timeline — well beyond many political terms, which means less political incentive.
Companies will have to play the long game at this point and prepare to weather an extended economic downturn in a high inflation environment. Many transportation providers are receiving the benefit of clearing the rubble of decimated supply chains for now, but spot rates have already corrected to an extent with contracts expected to follow.
The consequences of the Fed’s rate increases have yet to be fully recognized as demand side erosion was already in place. There is hope companies will be able to maintain workforces and wage growth while the global economic environment stabilizes, but that is a tall order. China has been subsidizing the U.S. economically with cheap goods for decades, so supply chain managers and CFOs are going to have to make changes if they want to regain control.
About the Chart of the Week
The FreightWaves Chart of the Week is a chart selection from SONAR that provides an interesting data point to describe the state of the freight markets. A chart is chosen from thousands of potential charts on SONAR to help participants visualize the freight market in real time. Each week a Market Expert will post a chart, along with commentary, live on the front page. After that, the Chart of the Week will be archived on FreightWaves.com for future reference.
SONAR aggregates data from hundreds of sources, presenting the data in charts and maps and providing commentary on what freight market experts want to know about the industry in real time.
The FreightWaves data science and product teams are releasing new datasets each week and enhancing the client experience.
To request a SONAR demo, click here.
Freight Fraud Symposium
Double brokering. AI deepfakes. Identity theft. Freight fraud is an existential threat to the industry. Get ahead of it.
Supply Chain AI Symposium
Past the hype. Join operators, founders, and enterprise leaders figuring out how to deploy AI in supply chain.
Future of Rail Symposium
Reshoring is rewriting freight demand. Join shippers, rail executives, and government officials to shape the next decade.
Double brokering. AI deepfakes. Identity theft. Freight fraud is an existential threat to the industry. Get ahead of it.
Rock & Roll Hall of Fame • Cleveland, OH Register NowPast the hype. Join operators, founders, and enterprise leaders figuring out how to deploy AI in supply chain.
The Old Post Office • Chicago, IL Register NowReshoring is rewriting freight demand. Join shippers, rail executives, and government officials to shape the next decade.
The Signal at Chattanooga Choo Choo • Chattanooga, TN Register Now