
Van rates on the truckload contract market will likely soften in the coming months. But, the decline won’t be as marked as what the industry saw on the spot market side.
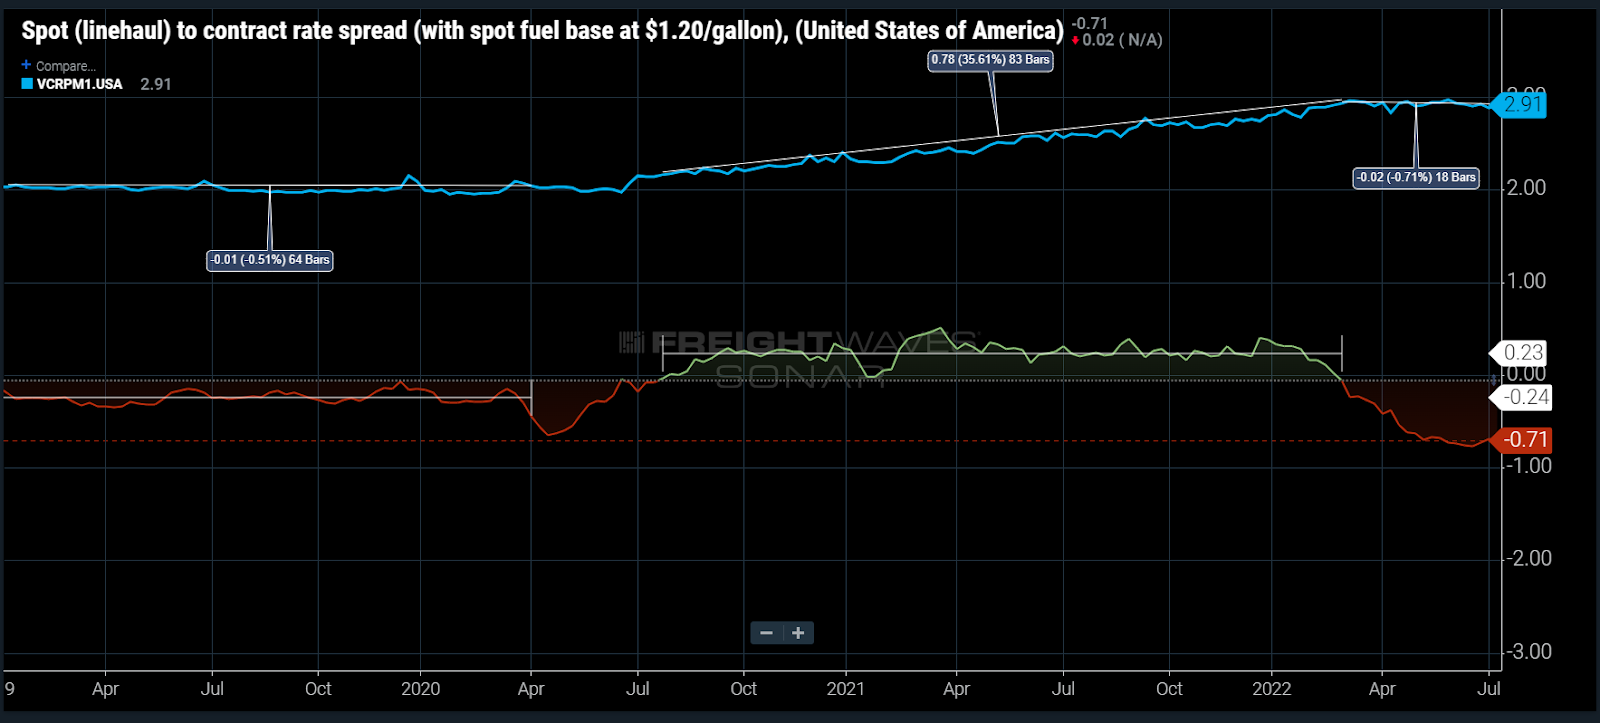
The spread between spot and contract rates has averaged around record low levels (~-74 cents a mile) since early May. That will put downward pressure on contract rates for bids negotiated in the second half of the year. There is little precedent for such a dramatic difference, but there’s also little evidence historically that contract rates will fall as fast as they increase.
The contract truckload market behaves very differently from the spot market. Volatility is the main difference. That’s driven primarily by the way pricing is negotiated.
The RATES12 index used in this week’s chart is the difference between spot rates less a level of estimated cost of fuel and contract rates. This is done for a more apples-to-apples comparison of the two rates, as contract rates include a portion of fuel cost and pass a lot of it along in the form of a fuel surcharge. This mechanism is largely absent from spot rates.
Contract truckload rates have barely budged since March, but red flags are already appearing
The contract or published rate market is simply an agreement between shipper and carrier that is in place for an extended period of time. The commitment is somewhat tenuous as neither volume nor service is guaranteed in most instances.
The only binding portion is, if the shipper tenders a load(s) to the carrier and the carrier is willing and able to transport the customer’s freight, it will do it for a predetermined price until the expiration of the agreement. Spot rates are negotiated on the spot and are normally only applicable for a few days with minimal volume.
Contract rate agreements typically have a life span of around 12 months but can be longer or shorter. Many shippers transitioned to a shorter procurement cycle during the pandemic thanks to their inability to secure capacity reliably, essentially bidding against one another and driving up rates faster than ever. Contract rates increased ~49% from June 2020 to March 2022.
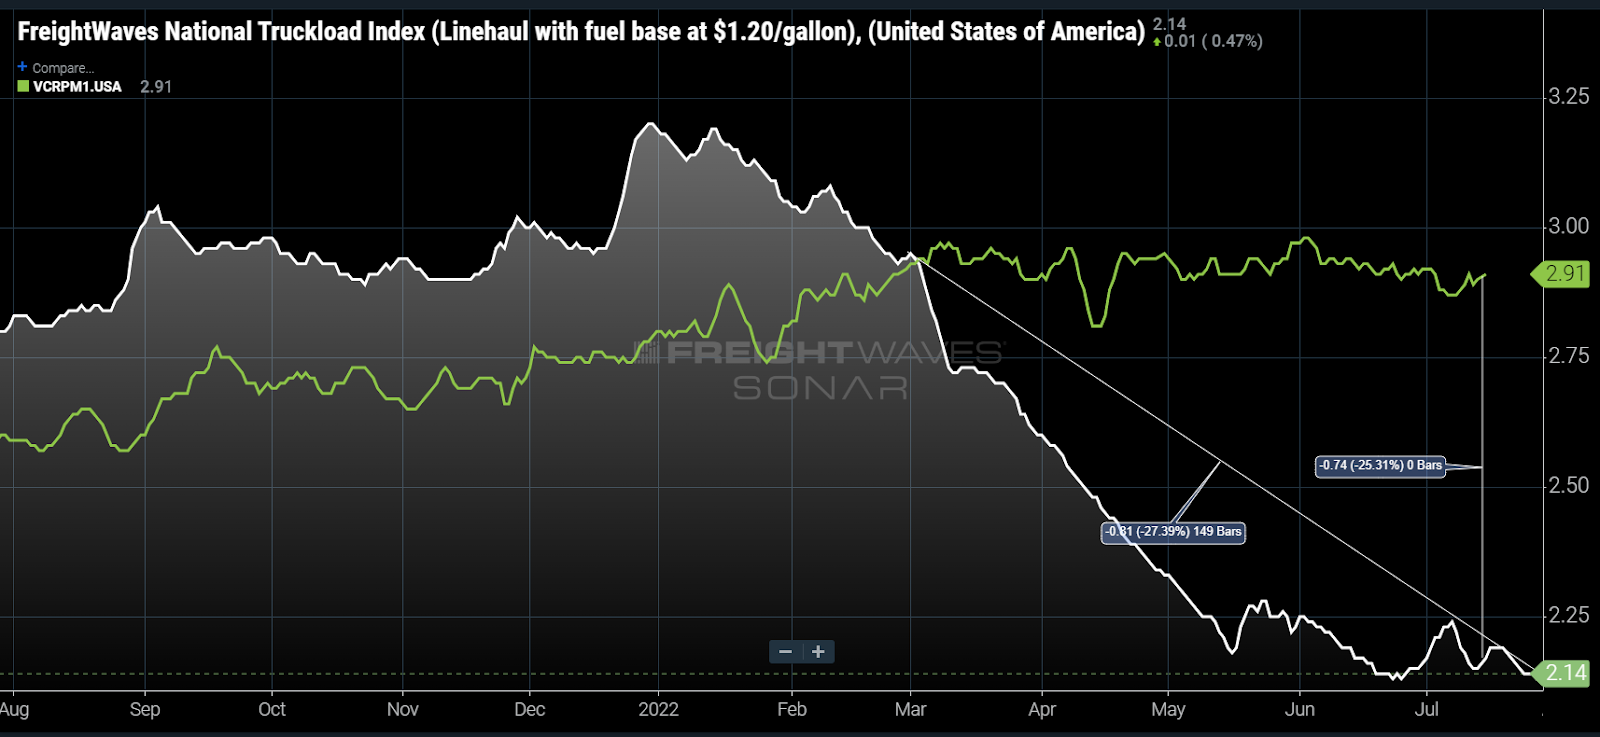
Since March, there has been minimal movement in contract rates, but they are showing early signs of deterioration, falling about 2% since early June. Spot rates, assuming a base level of fuel cost around $1.20 per gallon, have dropped 27% over the same period. This has created a 74-cent-per-mile difference between the spot (NTIL12) and contract rate (VCRPM1) indices.
In 2019 the spread between spot and contract averaged -24 cents per mile. Contract rates barely moved before falling about 2%-4% in January 2020, which shows that contract rates are less volatile.
The spread today is three times larger than it was in 2019. Shippers may have a stronger appetite for cost reduction after two years of rapid inflation.
A rate decrease will occur if demand-side conditions do not improve
Movements for contract truckload rates will ultimately be decided by the carriers and their need for equipment utilization. And so far, most publicly traded trucking companies have only mentioned minor deterioration at most while reporting strong Q2 results.
Accepted contract load volumes support this for now, showing only a marginal decline in July versus June. Compared to last July, volumes are down 3%-5%.
As for the supply side of the equation, most of the capacity growth over the past two years has been on the small fleet/owner-operator side, which heavily relies on spot market freight. The larger fleet heavy contract market has better structure to maintain elevated rate levels.
That said, the rate differential is too large to sustain for long. Some level of rate decrease will occur if demand-side conditions remain at or below current levels. Judging from history, it would appear a conservatively estimated 3%-5% decrease is all but imminent in the coming months.
About the Chart of the Week
The FreightWaves Chart of the Week is a chart selection from SONAR that provides an interesting data point to describe the state of the freight markets. A chart is chosen from thousands of potential charts on SONAR to help participants visualize the freight market in real time. Each week a Market Expert will post a chart, along with commentary, live on the front page. After that, the Chart of the Week will be archived on FreightWaves.com for future reference.
SONAR aggregates data from hundreds of sources, presenting the data in charts and maps and providing commentary on what freight market experts want to know about the industry in real time.
The FreightWaves data science and product teams are releasing new datasets each week and enhancing the client experience.
To request a SONAR demo, click here.