
Import container volumes continue to point to domestic freight market slowing

Chart of the Week: National Trucking Index – USA, Inbound Ocean TEUs Index – China to USA SONAR: NTI.USA, IOTI.CHNUSA
Back in the early part of the pandemic, companies began to import goods at an incredible pace, leading to the unprecedented rise in the truckload spot market rates. The connection between imports and trucking is not always this consistent, but the pandemic has strengthened their relationship thanks to an acceleration of growth in e-commerce and societal shifts.
The Inbound Ocean TEUs Index (IOTI) measures bookings based on their estimated time of departure from their origination ports. This particular granularity measures bookings originating in China to the U.S., which saw a sharp rise in May of last year as the shopping spree began.
Bookings from China to the U.S. were up 16% year-over-year (y/y) on June 1, 2020, while trucking spot rates as measured by the National Trucking Index (NTI) were down 10% over the same period.
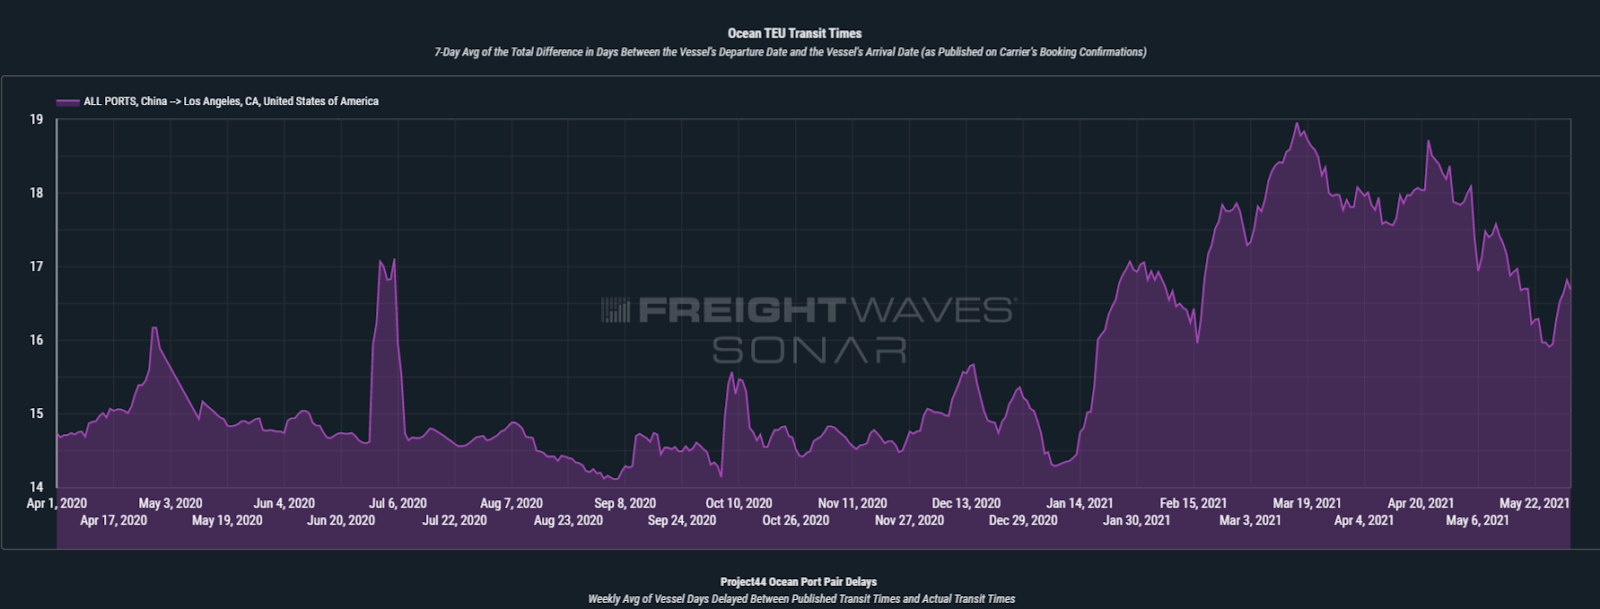
Transit times from China to the ports of Los Angeles and Long Beach — representing the bulk of the inbound volume for imported goods for the U.S. — averaged around 15 days as reported by the ocean carriers in May 2020, according to SONAR Container Atlas (SCA). This means there was at least two weeks’ lead time before domestic rail and trucking operators felt the demand side pressure.
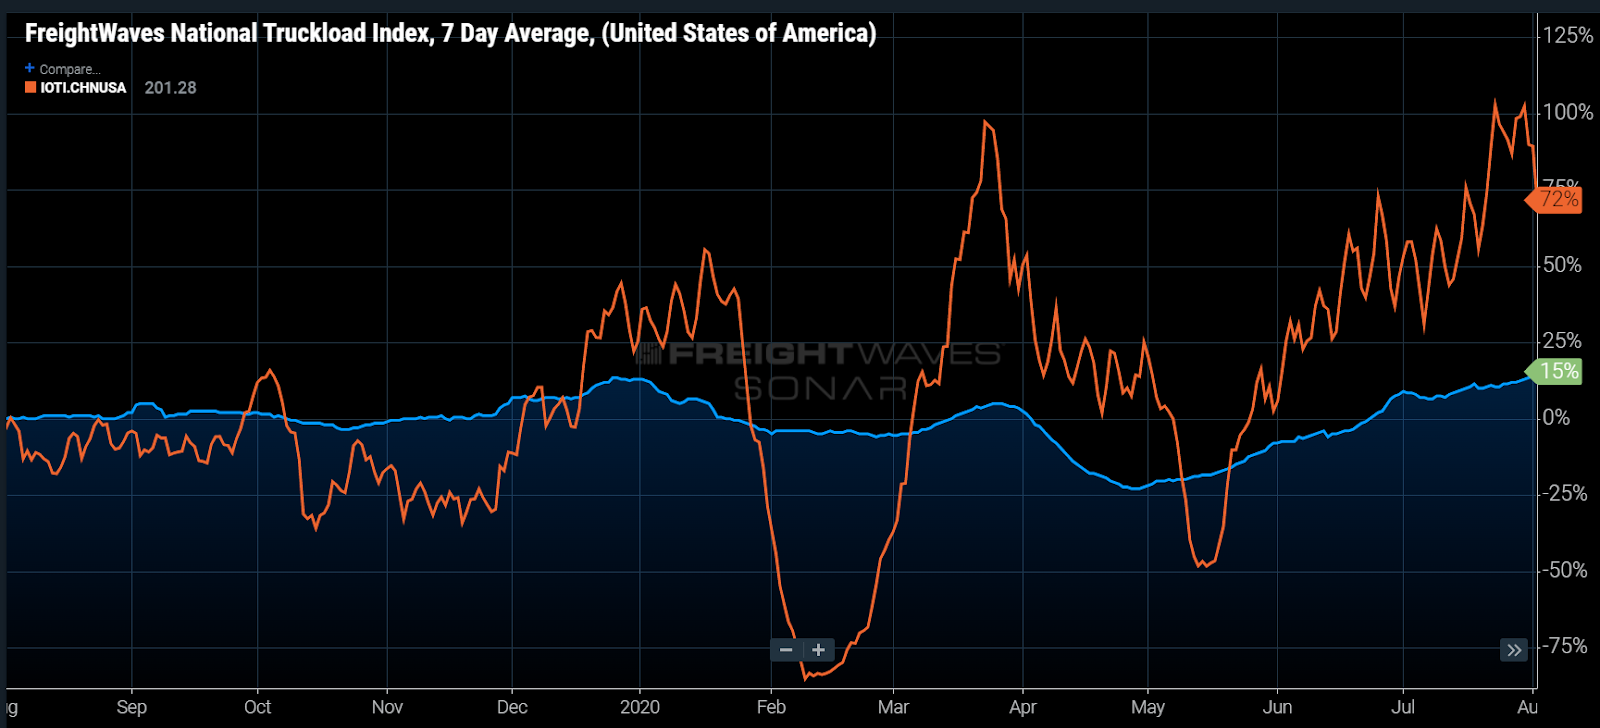
By the end of July 2020, China to U.S. bookings were up 72% y/y and national dry van spot rates were up 15%, indicating there was still plenty of room for rates to grow.
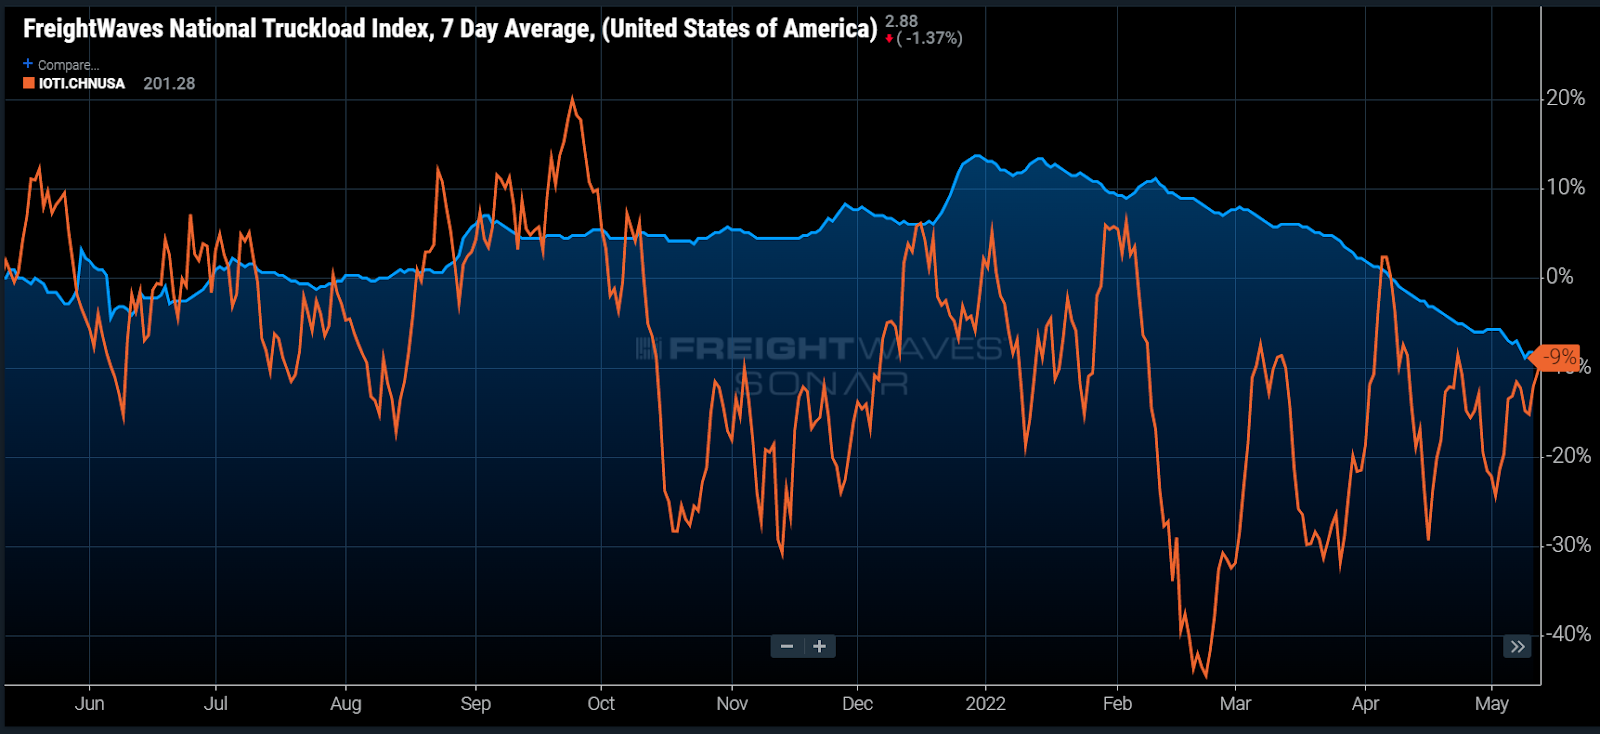
More recently, this past February showed a 33% decline in bookings from 2021, while spot rates were 16% higher y/y. As of Wednesday, both the IOTI from China to the U.S. and the NTI were 9% down from the previous year.
It should be noted that some of the annual booking activity decline in February occurred around the Chinese New Year, but the negative growth continued through March.
There are two big takeaways from this analysis. The first is that goods demand and subsequently surface freight volume in the U.S. are highly connected to maritime shipping, which should not be terribly novel at this point to anyone who monitors freight patterns.
The second is that we should continue to see contraction in domestic freight volumes for the next few months and potentially downward pressure on spot rates.
Spot rates are not built on demand alone, but it is a critical component. Since carriers will lose money if they are not moving (aka low utilization), they will take some loads they consider below their breakeven costs to essentially lose less.
This is important to know because their operating costs have inflated significantly over the past year, especially in regard to fuel. Once carriers decide to sink below the cost threshold on high-demand lanes, the clock starts ticking on how long they can sustain.
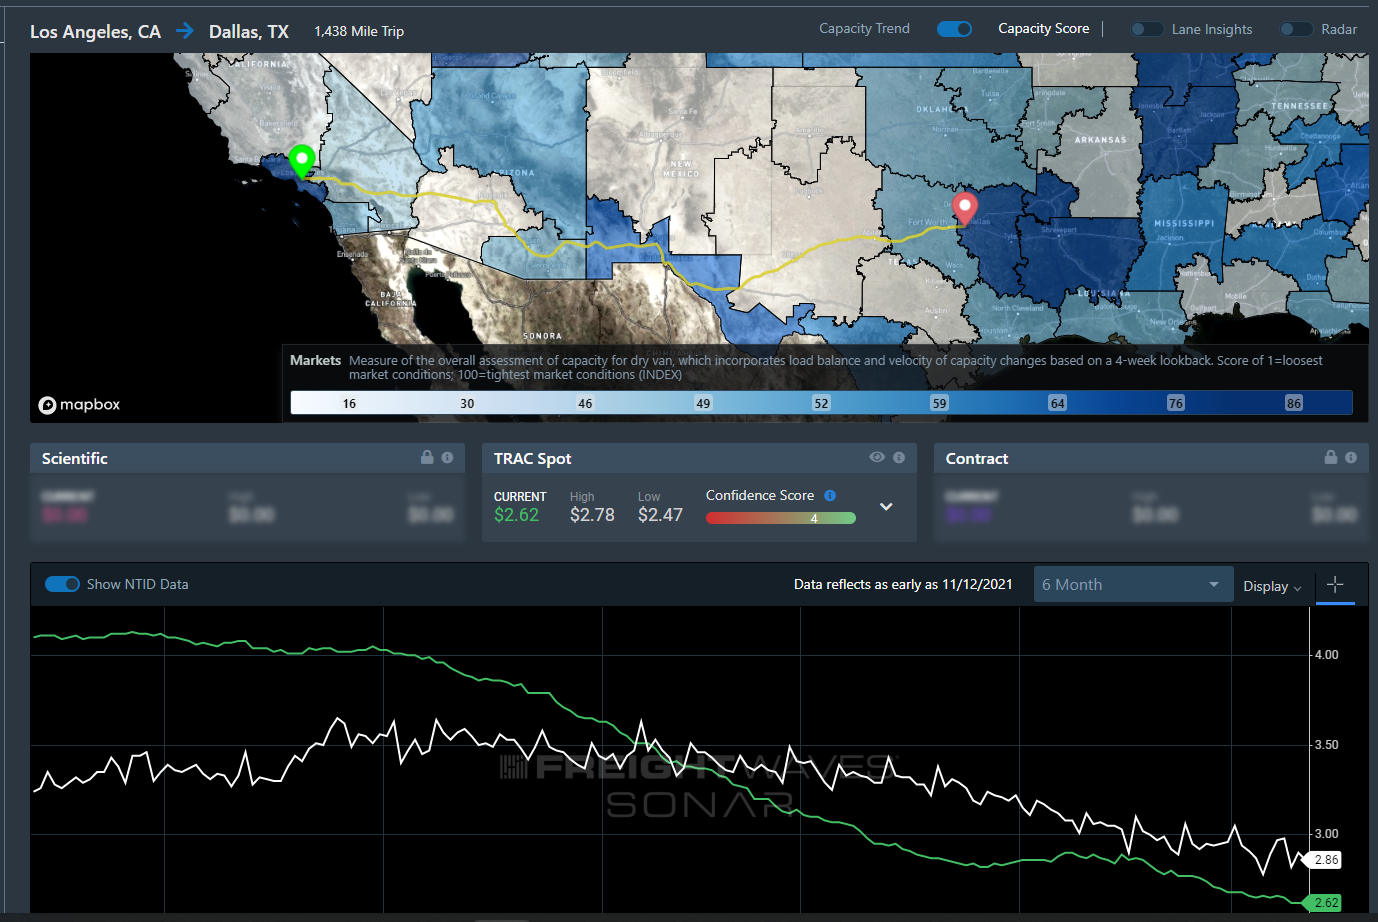
Looking at spot rates in the Los Angeles to Dallas lane, rates (inclusive of fuel) have fallen 35% since the start of the year, faster than the pace of the overall market (~29%). This is indicative of the demand-side drop as capacity cannot grow at this pace and other demand-side indicators such as the Outbound Tender Volume Index (OTVI) show significant dips out of Southern California as well — down 15% since Feb 1. Erosion to rail is also a factor here.
China is not the only source of imports, but it is the most important in regard to demand for goods and domestic freight volume. The continued lockdowns in Shanghai also point to future availability of goods problems that may add another layer of complexity to beleaguered supply chains. The question is just how long will this trend last and how deep will it get.
About the Chart of the Week
The FreightWaves Chart of the Week is a chart selection from SONAR that provides an interesting data point to describe the state of the freight markets. A chart is chosen from thousands of potential charts on SONAR to help participants visualize the freight market in real time. Each week a Market Expert will post a chart, along with commentary, live on the front page. After that, the Chart of the Week will be archived on FreightWaves.com for future reference.
SONAR aggregates data from hundreds of sources, presenting the data in charts and maps and providing commentary on what freight market experts want to know about the industry in real time.
The FreightWaves data science and product teams are releasing new datasets each week and enhancing the client experience.