
Chart of the Week: Rail Traffic – Cass Freight Index – Shipments, Institute of Supply Management – Purchasing Manager’s Index, Backlog of Orders Index SONAR: CFIS.USA, ISM.PMI, ISM.MLOG
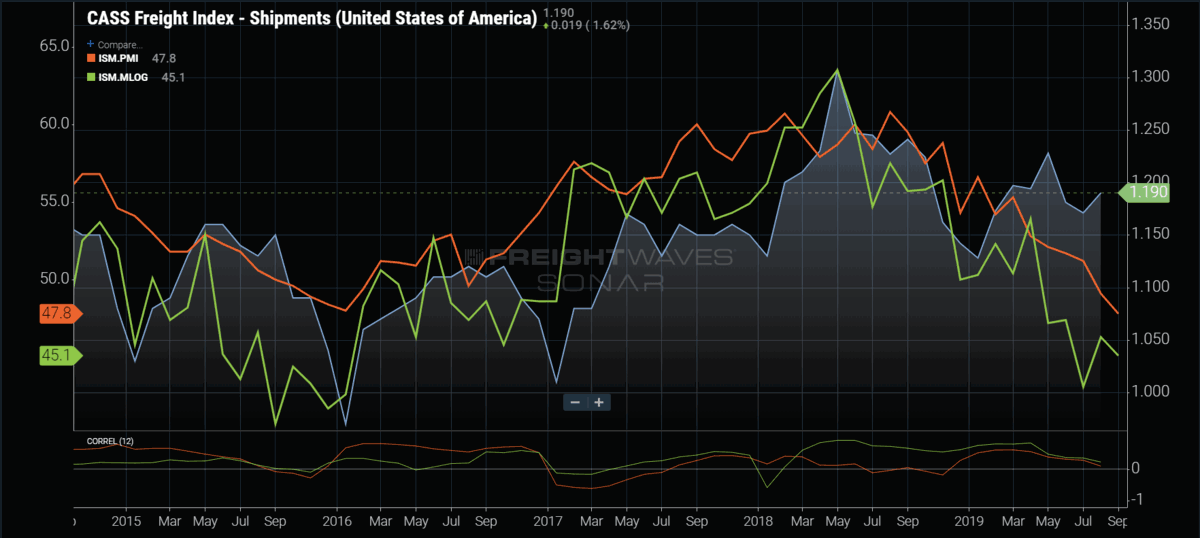
Last week the Institute of Supply Management (ISM) released their latest Purchasing Manager’s Index (PMI) value for September, which was the lowest value reported in over ten years. The PMI has a loose leading relationship with the Cass Shipments Index, which measures freight volumes based on invoicing activity. The recent drop could be a sign of what to expect with freight volumes after the retail shipment heavy 4th quarter ends.
The PMI is a diffusion index based on surveys of supply chain managers in over 400 companies in 19 industries. This type of index is designed to identify turning points in economic cycles. A reading below 50 is indicative of slowing or contracting conditions, while anything over 50 is indicating expansion as perceived by the purchasing managers.
The recent result of 47.8 is the lowest value since 2009, when the U.S. economy was in a deep recession. Times have changed, however, and the economy is not as tied to manufacturing as it once was, which is largely the focus of the PMI.
The bad news for trucking companies is the fact that they are still very connected to manufacturing activity, and at certain times of the year the freight mix shifts more heavily towards moving prefabricated goods between plants. January through March is typically the most active time of year for this due to the seasonality of order cycles.
Many companies budget for capital expenditures and inventory purchasing at the end of the fiscal year. For most, that occurs on or around December 31st. This leads to surging orders around this time as they clean out reserves of cash to get ready for the upcoming year. Part of the PMI calculation involves the backlog of orders. This index has been below 50 since May, with the most recent September number was 45.1.
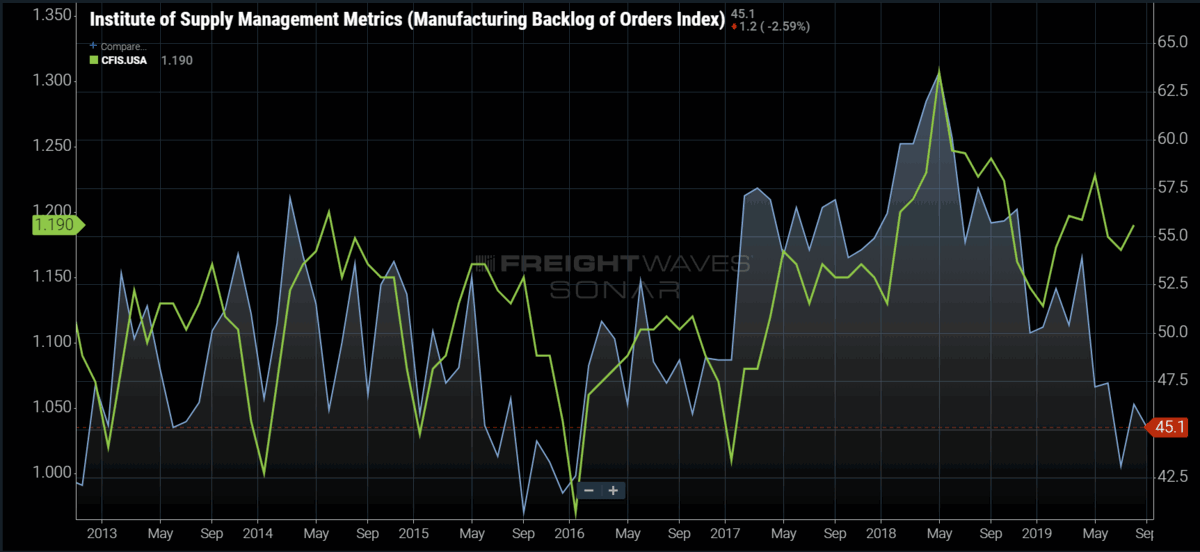
The backlog of orders index generated by the ISM has been better correlated with freight movements than the PMI in recent years due to the PMI being a summary of many aspects of supply chain activity such as pricing and inventory levels that do not have as close of a relationship with freight movement, at least in terms of timing. Orders have a more near-time impact to freight as manufacturers will need to transport raw materials to start the manufacturing process. So what does this mean for the freight market over the next few months?
Removing seasonality from the picture, there is a slightly leading nature to the backlog index for freight volumes. The most recent pattern looks eerily similar to 2015, when the ISM indices diverged from the Cass Shipments Index. This could mean we are only seeing a temporary respite in freight volumes — produce, retail shipments, and trade war response are keeping the industry afloat, while the bottom is about to fall out in earnest in early 2020.
Another reason trucking may be seeing a recent boost is the spillover from the intermodal rail sector due to trucking rates being more competitive. Shippers have shifted some of the freight that typically goes on rail to trucking.
The Cass Index includes samples of rail and intermodal shipments so it would seem that this does not explain the full discrepancy. It would appear that the freight market has not fully realized the bottom if the relationship between shipments and ISM indices remains true.
Winter is already a difficult time for carriers, maybe the consumer will rise to the challenge of saving the day once again.
About the Chart of the Week
The FreightWaves Chart of the Week is a chart selection from SONAR that provides an interesting data point to describe the state of the freight markets. A chart is chosen from thousands of potential charts on SONAR to help participants visualize the freight market in real-time. Each week a Market Expert will post a chart, along with commentary live on the front-page. After that, the Chart of the Week will be archived on FreightWaves.com for future reference.
SONAR aggregates data from hundreds of sources, presenting the data in charts and maps and providing commentary on what freight market experts want to know about the industry in real time.
The FreightWaves data science and product teams are releasing new data sets each week and enhancing the client experience.
To request a SONAR demo click here.