
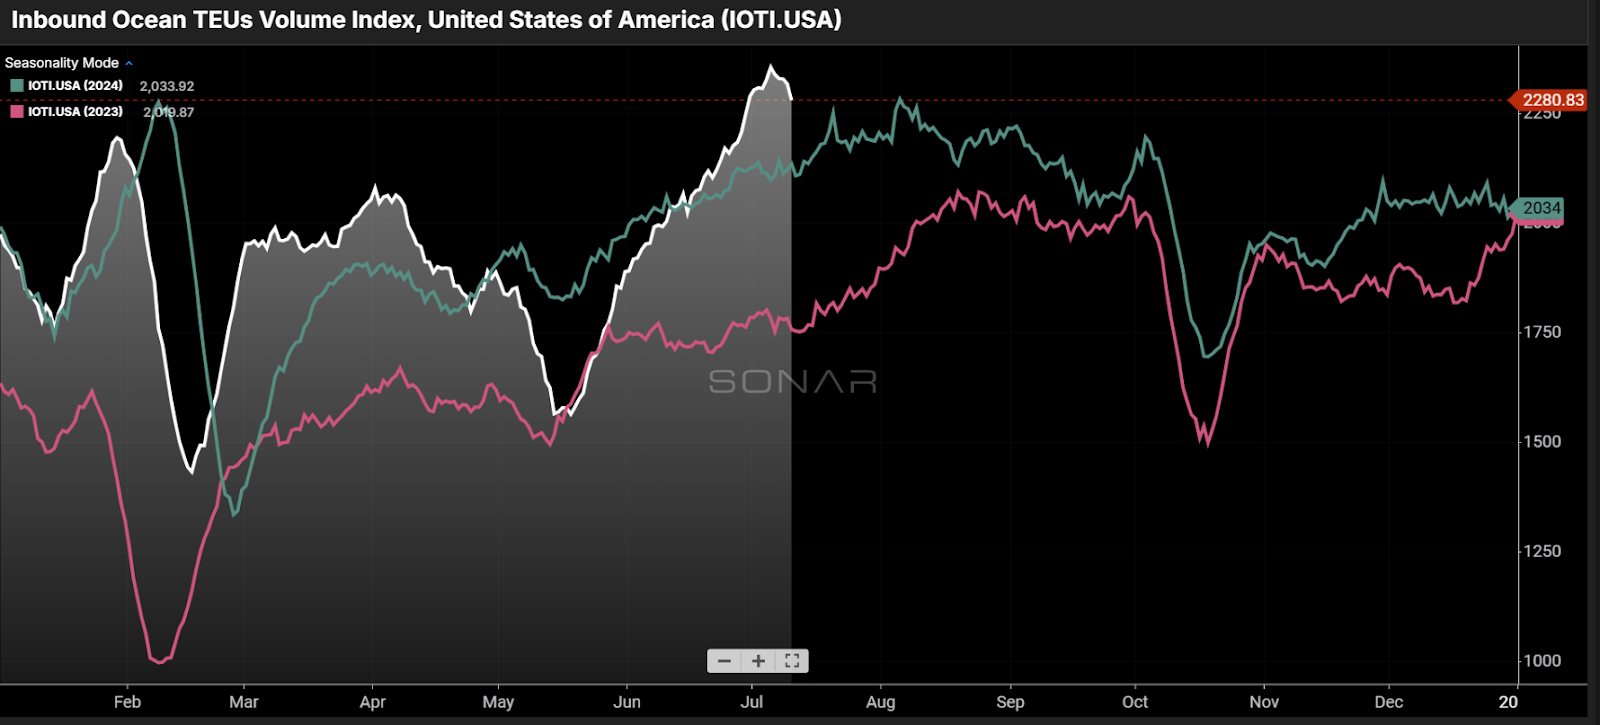
Chart of the Week: Import Ocean TEUs Volume Index – USA SONAR: IOTI.USA
Booking volumes for container imports, as measured by the Inbound Ocean TEUs Volume Index (IOTI), appear to have peaked in early July—about a month ahead of the typical peak shipping season. While “typical” has become a relative term in recent years due to shifting and increasingly normalized shipping behaviors, this early peak offers valuable insight into what transportation markets might expect for the remainder of 2025.
The IOTI is a 14-day moving average index that tracks twenty-foot equivalent unit (TEU) containers arriving at U.S. ports from around the world. While it generally follows stable seasonal patterns, 2025 has seen significant disruption due to an emerging trade war initiated by the current administration in an effort to rebalance U.S. trade and support domestic manufacturing.
The IOTI reached a multi-year high of 2,356 following the Fourth of July—roughly 4% higher than last year’s peak of 2,273, which occurred on August 5, 2024.
However, this does not necessarily indicate stronger goods demand compared to last year. A portion of this volume increase likely reflects a recovery from lost time earlier in the year when cost-prohibitive tariffs on Chinese imports, enacted in April and early May, temporarily froze activity. Many importers halted purchases from the U.S.’s largest overseas trading partner due to skyrocketing costs, which led to a 15% drop in the IOTI during May.
A wave of uncertainty
When the tariffs were paused (currently set to expire in August), shippers quickly resumed ordering—both to make up for delayed shipments and to ensure sufficient inventory ahead of potential demand spikes.
This situation presents a double-edged sword for many companies. On one hand, tariffs increase direct import costs; on the other, they contribute to broader economic uncertainty and could suppress consumer demand. The extent to which this trade war will impact the broader economy remains unclear.
So far, it has clearly rattled sentiment, as seen in multiple consumer and business confidence indexes. While the jobs market appears healthy on the surface, deeper analysis reveals underlying weakness. According to ADP, private-sector hiring stalled in June, leading to a net loss of jobs. Retail sales also softened in May, prompting many economists to forecast further weakening in the second half of the year as the full impact of tariffs begins to filter into prices.
Although government employment figures showed gains—thanks largely to state and local hiring—that trend may be overstated, as a growing number of people have exited the labor force in recent months.
Holding the ball
All of this uncertainty has left supply chain managers in a difficult position, balancing how much inventory to procure, how much it will cost, and how much they’ll actually need as consumer health remains in question.
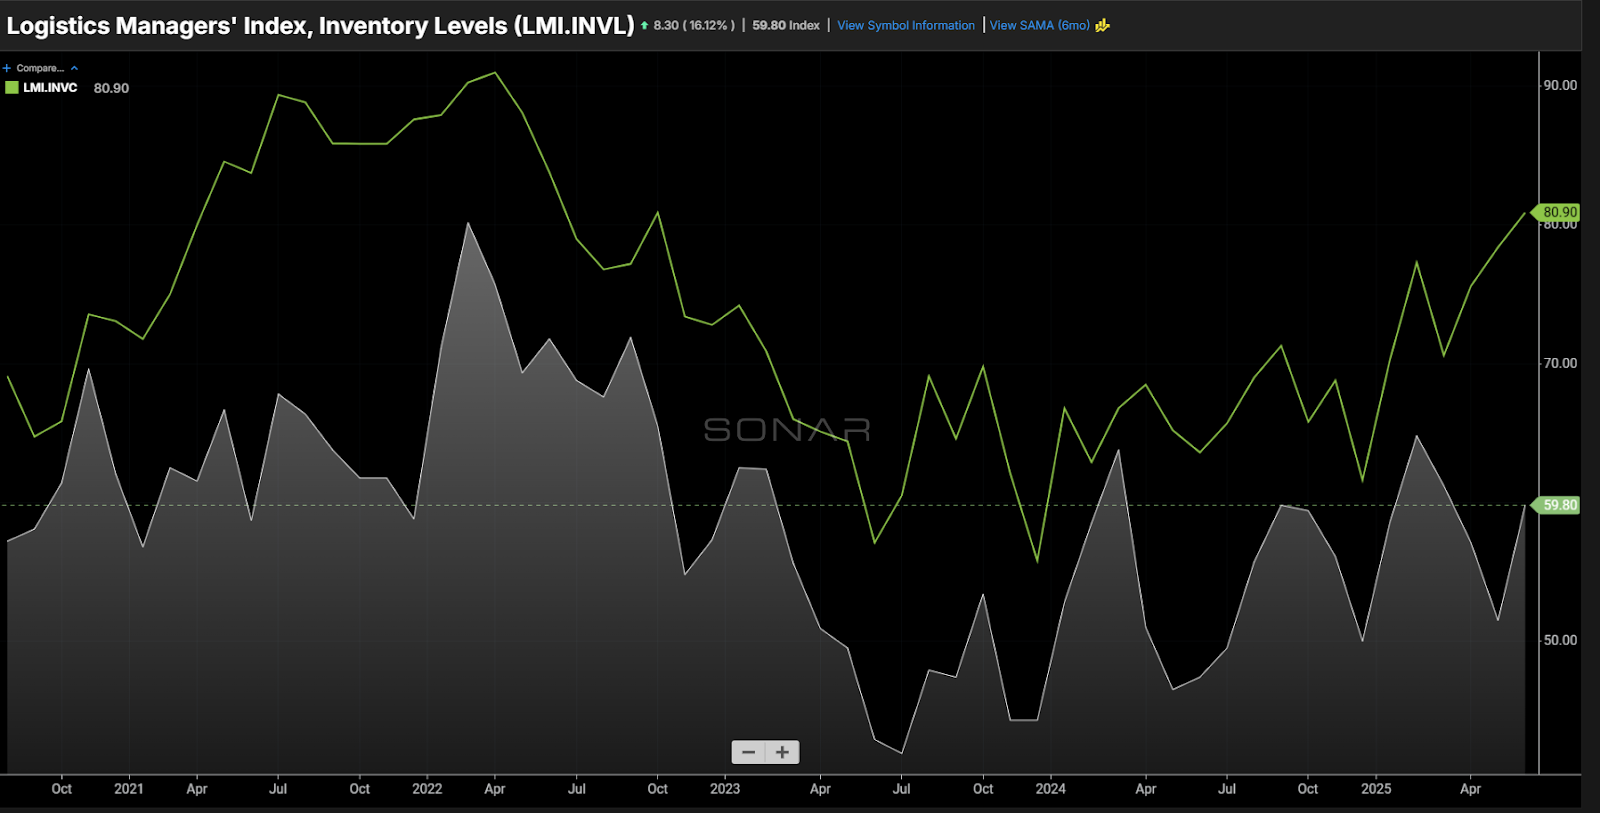
Inventory levels have grown somewhat erratically this year, though they’ve followed a generally upward trend since last summer, according to the Logistics Manager’s Index (LMI). More importantly, inventory costs have risen even faster—driven by tariffs and rising warehousing expenses. This pressure may suppress import volumes in the coming months as companies weigh the cost of holding excess inventory against waiting for more stable economic and policy conditions.
Maritime carriers appear to be anticipating softer demand as well. Early signs of blank sailings have emerged in response to declining bookings.
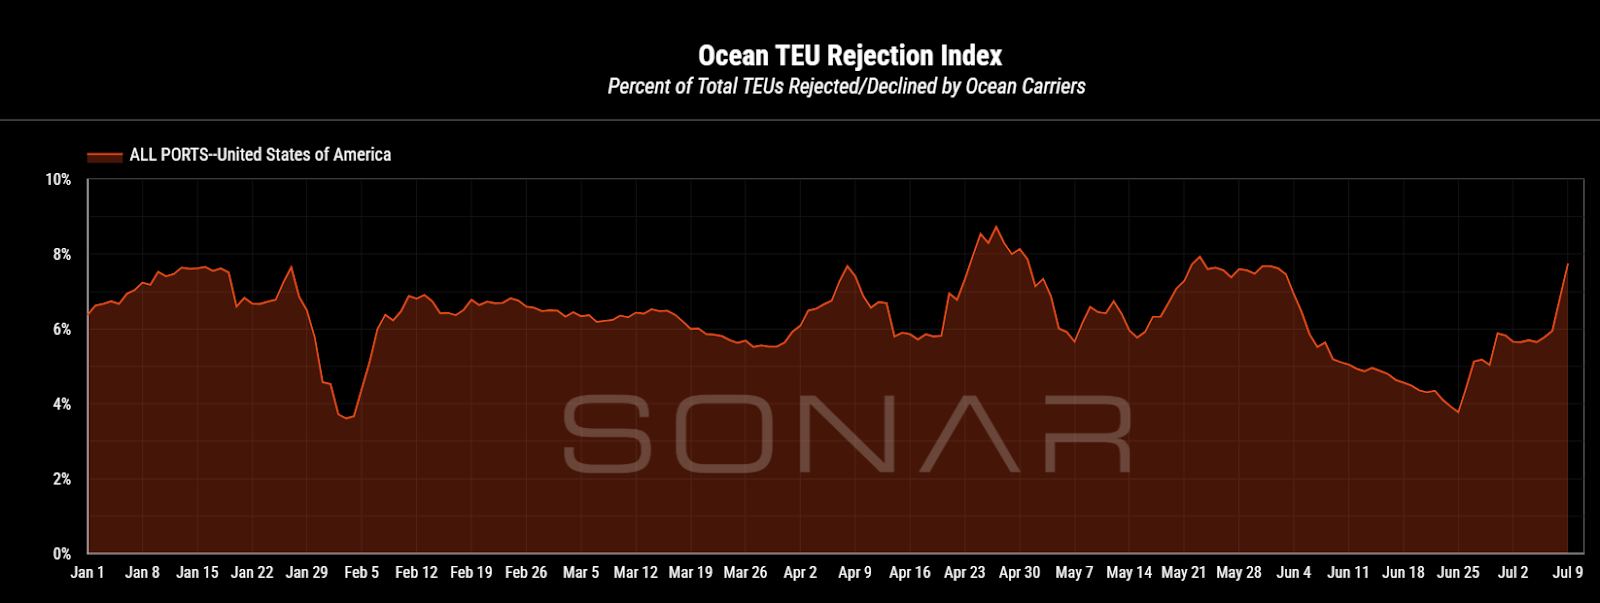
The Ocean TEU Rejection Index, found in SONAR’s Container Atlas application, shows a recent spike in rejected shipments. While this is a small sample that could reflect a short-term fluctuation, it may also suggest that carriers are starting to manage capacity to prevent rate declines.
This early peak in imports may not signal strength in the same way it once did. Still, that doesn’t necessarily mean surface transportation will weaken in the second half of the year. Rising inventory costs could lead to leaner inventories later on, prompting more last-minute orders. In environments like this, demand forecasts tend to lose accuracy—putting added pressure on transportation networks to remain agile and responsive.
About the Chart of the Week
The FreightWaves Chart of the Week is a chart selection from SONAR that provides an interesting data point to describe the state of the freight markets. A chart is chosen from thousands of potential charts on SONAR to help participants visualize the freight market in real time. Each week a Market Expert will post a chart, along with commentary, live on the front page. After that, the Chart of the Week will be archived on FreightWaves.com for future reference.
SONAR aggregates data from hundreds of sources, presenting the data in charts and maps and providing commentary on what freight market experts want to know about the industry in real time.
The FreightWaves data science and product teams are releasing new datasets each week and enhancing the client experience.
To request a SONAR demo, click here.
Supply Chain AI Symposium
Past the hype. Join operators, founders, and enterprise leaders figuring out how to deploy AI in supply chain.
F3: Future of Freight Festival
Industry-defining keynotes, rapid-fire technology demos, and industry leaders networking in experiences across Chattanooga - plus the inaugural F3 Awards Dinner featuring the FreightTech and Shipper of Choice reveals.
Past the hype. Join operators, founders, and enterprise leaders figuring out how to deploy AI in supply chain.
The Old Post • Chicago, IL Register NowIndustry-defining keynotes, rapid-fire technology demos, and industry leaders networking in experiences across Chattanooga - plus the inaugural F3 Awards Dinner featuring the FreightTech and Shipper of Choice reveals.
The Signal at Chattanooga Choo Choo • Chattanooga, TN Register Now