
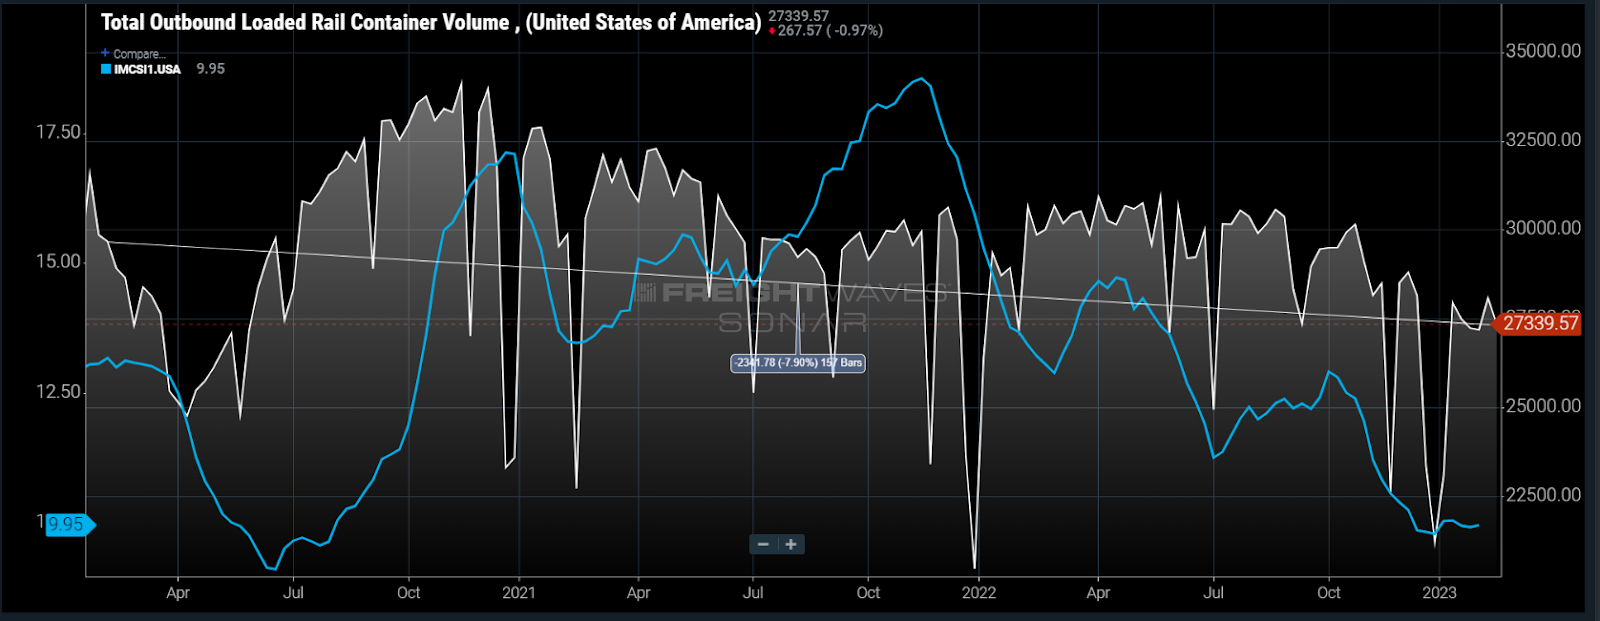
Chart of the Week: Outbound Loaded Rail Container Volumes, Intermodal Contract Savings Index – USA SONAR: ORAILL.USA, IMCSI1.USA
Intermodal loaded container volumes have dropped about 11% year over year, which is not terribly shocking considering declining goods demand. The real story for intermodal is the 8% drop in container shipments versus the pre-pandemic level in February 2020 and that their cost advantage over trucking is near all-time lows.
When trucking capacity tightens and rates increase, intermodal shipping on the railroads becomes a lot more attractive in general. That does not appear to have happened during the pandemic years.
Aggregate demand for goods has fallen over the past 12 months according to just about every macroeconomic indicator, but it remains elevated above the pre-COVID period — which means rail demand should still outperform early 2020 levels.
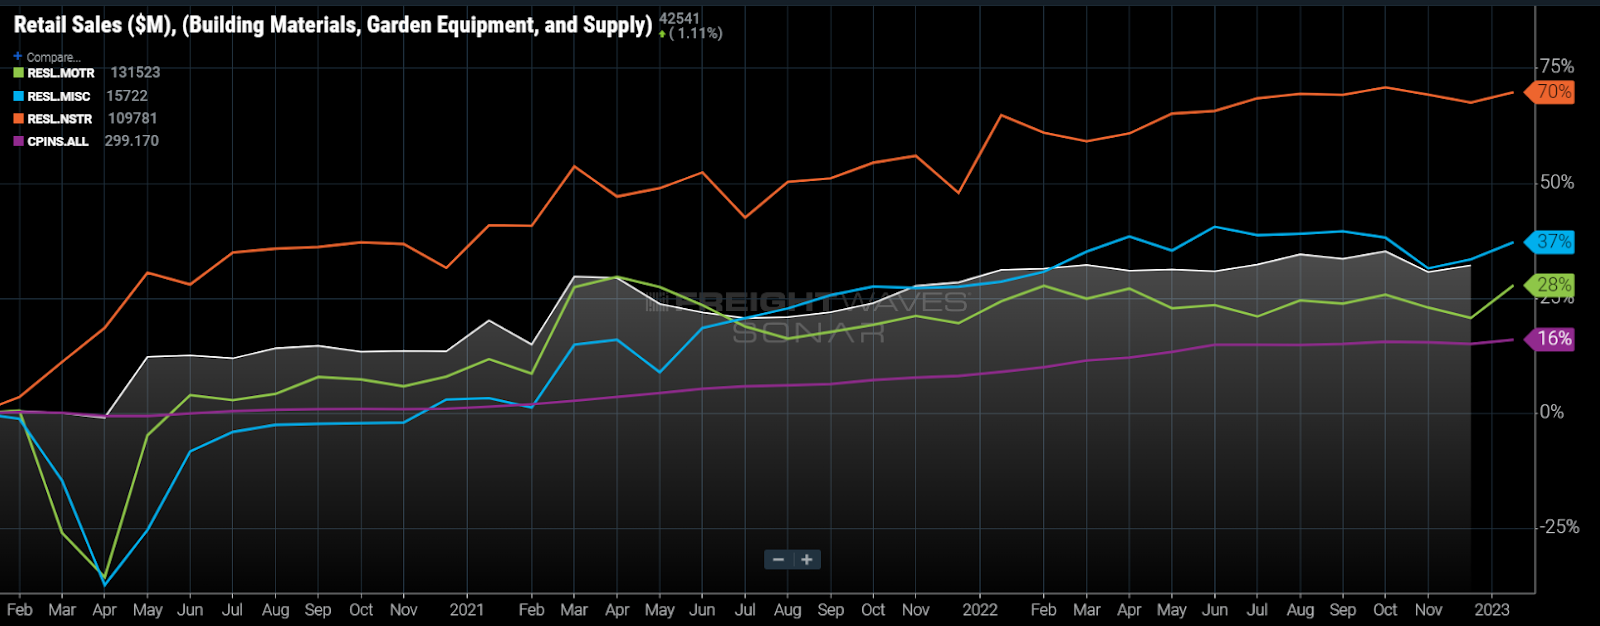
Retail sales (RESL) for most items even after being adjusted for inflation (CPINS) are still outpacing where they were three years ago. Nonstore retail sales have grown the most and may be an argument for trucking demand having more support.
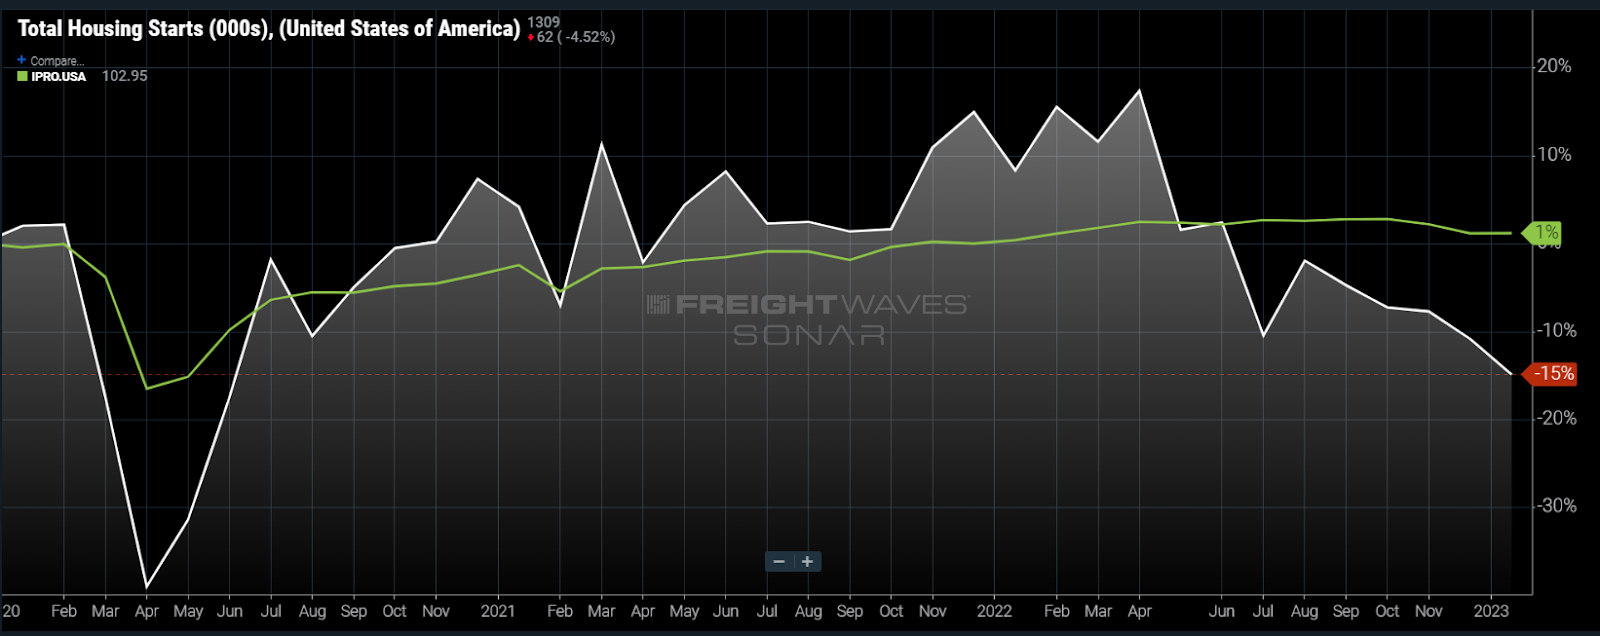
Housing starts have turned negative, but industrial production is still showing positive versus the winter of 2020. Starts are a leading indicator of freight activity and hit their highest levels since 2003 this past April.
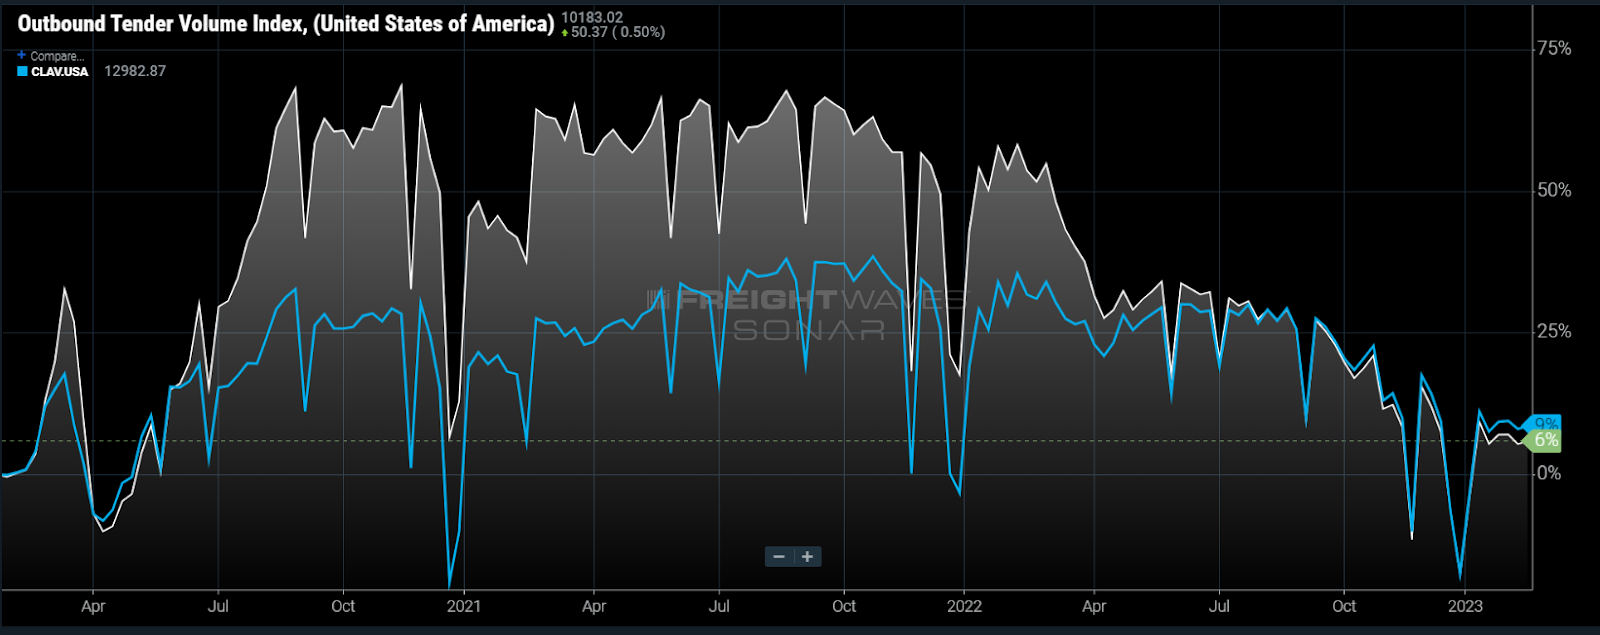
Most signs point to the fact that goods demand is still in a relatively strong position compared with where it was prior to the pandemic. The Outbound Tender Volume Index (OTVI) that measures total requests for truckload capacity is 6% higher than in February 2020. The accepted volumes index (CLAV) is 9% higher.
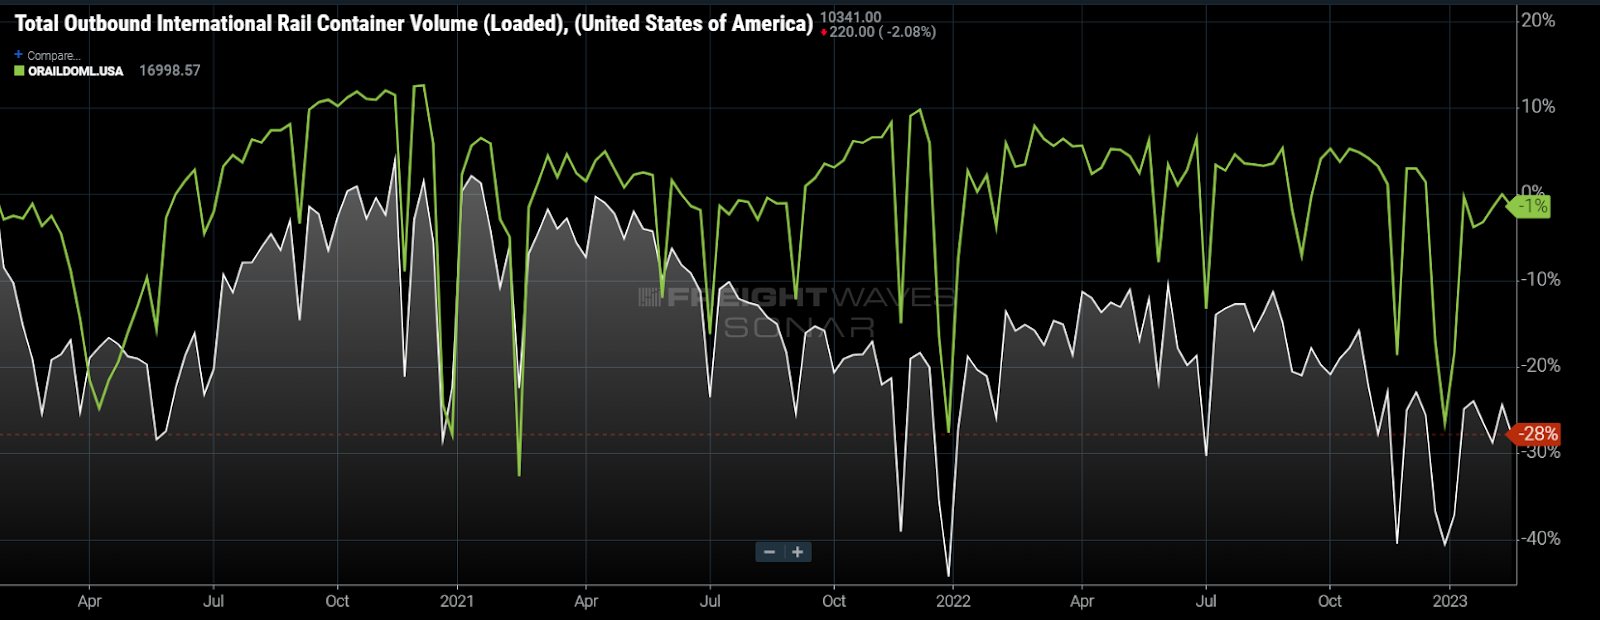
Signs are not all bad for intermodal as some of the decline in volume can be explained in the rapid deterioration of maritime imports. Breaking the loaded container volumes down into international- (ORAILINTL) and domestic-sized (ORAILDOML) containers, most of the deterioration can be explained by the lack of 20- and 40-foot container volumes being moved — down 28% versus 2020. These container types are mostly tied to imports coming from overseas.
The deterioration in international container moves is not totally tied to the lack of imports as customs shipments are still showing about 6% growth over this period. It is possible shippers are just letting the containers sit due to lack of warehouse space.
Possibly the most concerning thing for rail is that intermodal container growth spiked in late 2020 as truckload capacity was extremely tight. Then as time went on and truckload rates soared in relation to intermodal rates, the rails strangely lost share.
Many of the reasons for this were tied to factors outside of the railroad’s control, such as port operations and drayage congestion, and container shortages. Intermodal rates were offering as much as a 20% discount to truckload on average in late 2021. Intermodal rate increases and truckload contract rates falling have now pulled the spread below 10% for the first time since August 2020.
Not only has the competitive pricing advantage fallen, but freight patterns have shifted to be less favorable for rail’s infrastructure. Volumes in Southern California — one of the nation’s largest origins for rail freight — have fallen faster than in many other areas of the country.
While it may only be a correction from being more overheated than many areas of the country, companies now recognize the risk of having inflexible supply chain infrastructure and are looking to diversify.
The upcoming year looks challenging for most transportation providers in general. Normally, rail is more immune to shrinking demand, but its advantage has certainly diminished during a period when it was expected to grow.
About the Chart of the Week
The FreightWaves Chart of the Week is a chart selection from SONAR that provides an interesting data point to describe the state of the freight markets. A chart is chosen from thousands of potential charts on SONAR to help participants visualize the freight market in real time. Each week a Market Expert will post a chart, along with commentary, live on the front page. After that, the Chart of the Week will be archived on FreightWaves.com for future reference.
SONAR aggregates data from hundreds of sources, presenting the data in charts and maps and providing commentary on what freight market experts want to know about the industry in real time.
The FreightWaves data science and product teams are releasing new datasets each week and enhancing the client experience.
To request a SONAR demo, click here.
DwightP.
The decline in rail intermodal volume is directly related to the continual poor service and congestion in the intermodal network. Volumes from the West Coast will rebound once the ILWU situation is resolved, but intermodal has no chance of gaining market share from OTR trucking – even with appropriate pricing discounts – until the service becomes more competitive with trucking again.
Robert Allen
Transit times in the Chicago, Memphis and Dallas lanes still poor in relation to OTR carriers
Without competitive transit times trucks will continue to drive Intermodal off a cliff.
Worly1982
nice