
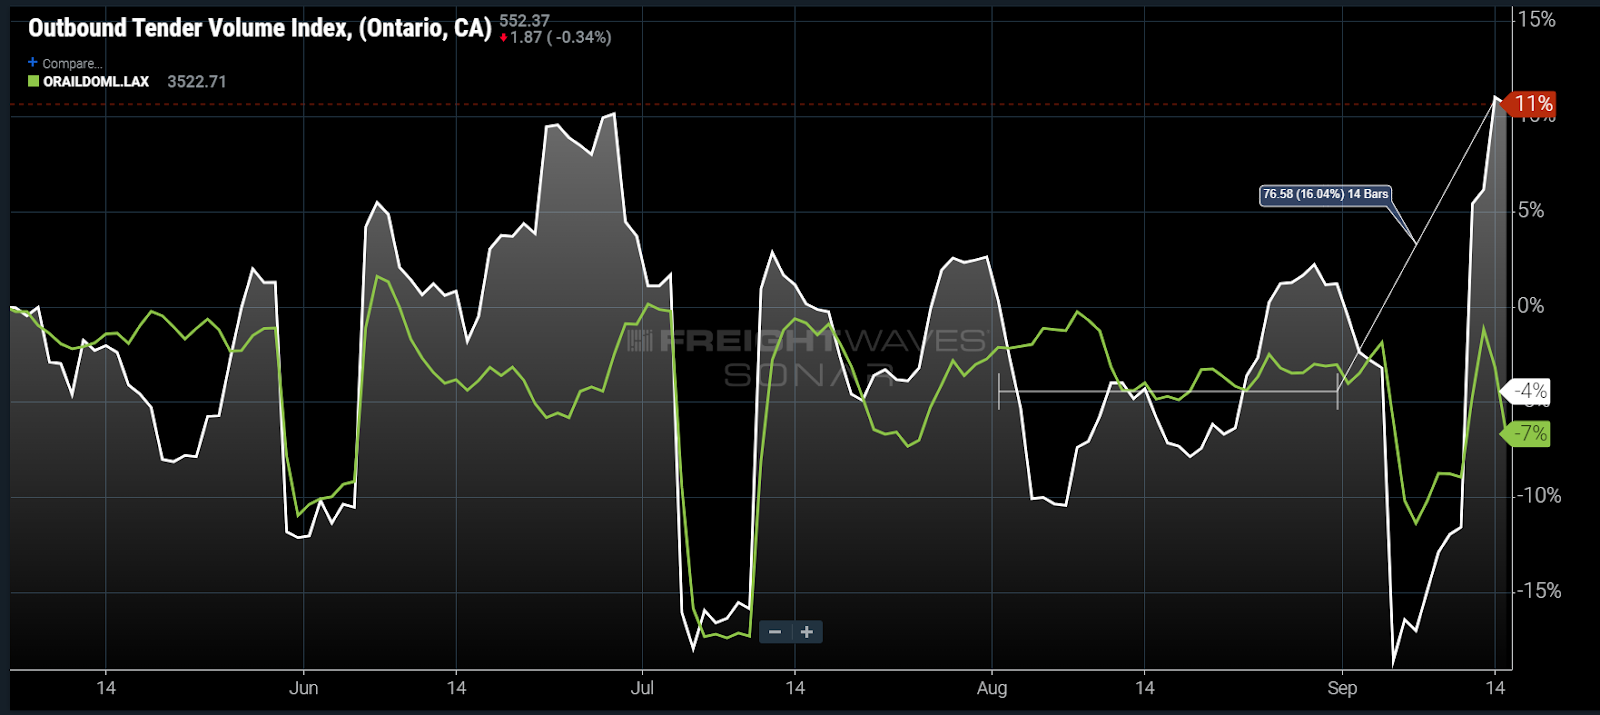
Chart of the Week: Outbound Tender Volume Index – Ontario, Outbound Loaded Domestic Container Volumes – Los Angeles SONAR: OTVI.ONT, ORAILDOML.LAX
Outbound tender volumes — shipper requests for truckload capacity — jumped 16% over the average level of August this past week out of the Ontario market in Southern California. Domestic rail container volumes were down roughly 2% at the end of the week out of Los Angeles. While difficult to tie together perfectly, this could be an illustration of how fragile supply chains remain even as the economy cools.
The biggest story of the past few weeks has been the potential strike that was poised to shut down rail traffic across the U.S. While most do not have a full grasp of what this means in detail, it could have brought increasing demand for truckload capacity out of the nation’s largest outbound freight center — and it may have achieved this effect.
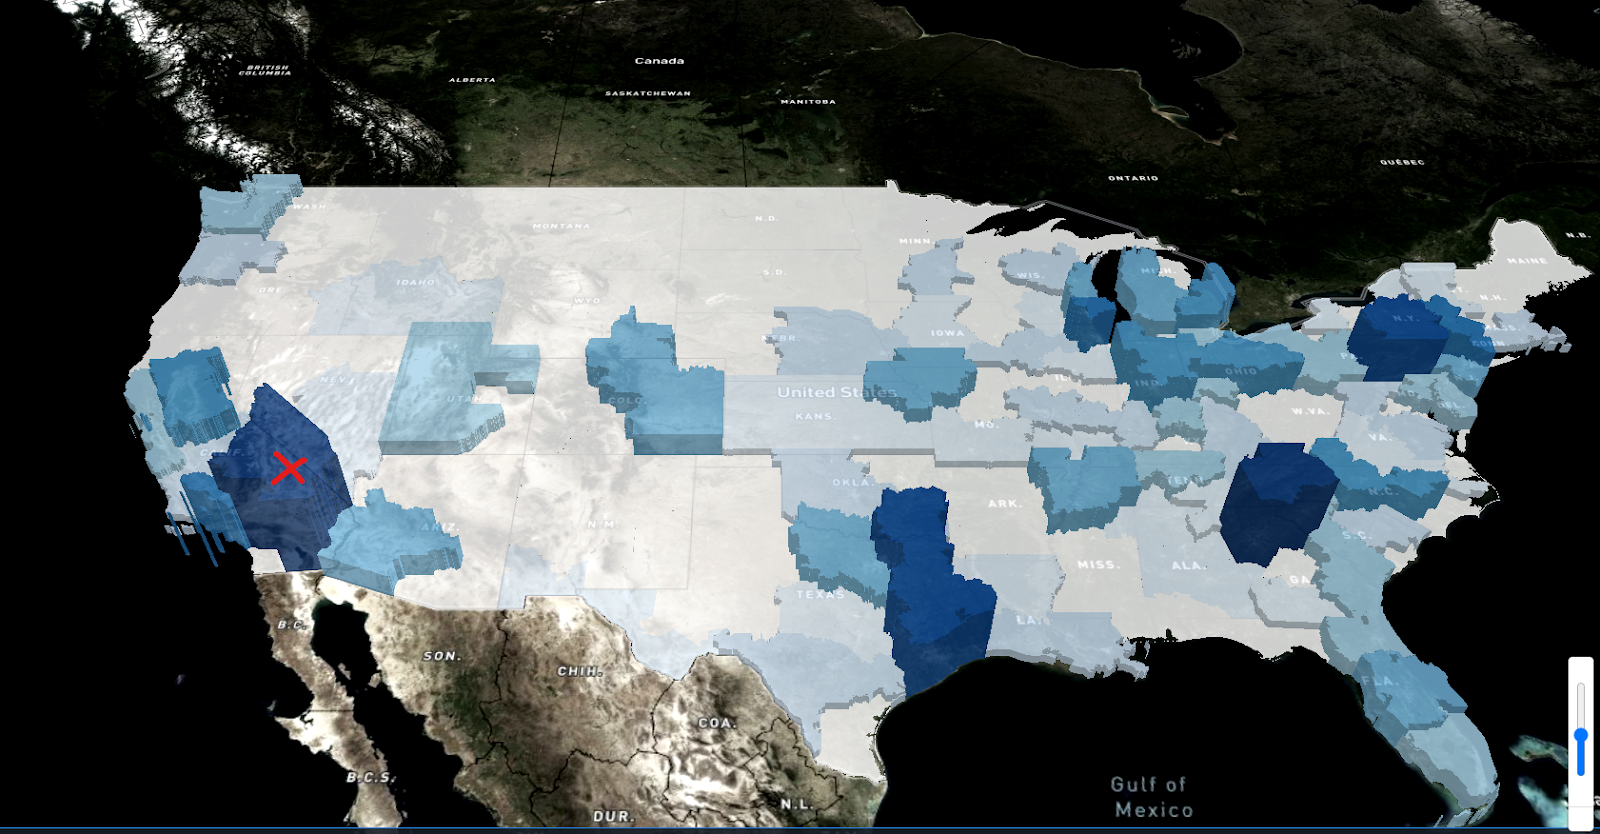
The Ontario market accounts for roughly 4-5% of total domestic truckload demand and houses one of the nation’s largest areas for warehousing. It is also one of the largest areas for intermodal shipments on the rail. The nation’s largest shippers all have facilities in this market, where they bring imports to stage until needed downstream.
It is typical to see a surge of long-haul truckload freight after Labor Day, but intermodal demand also tends to rise as shippers push volume to the east in preparation for a seasonal shift in demand and the holiday season. Over the past two years, this period of elevated demand has been extended to last from Labor Day into December.
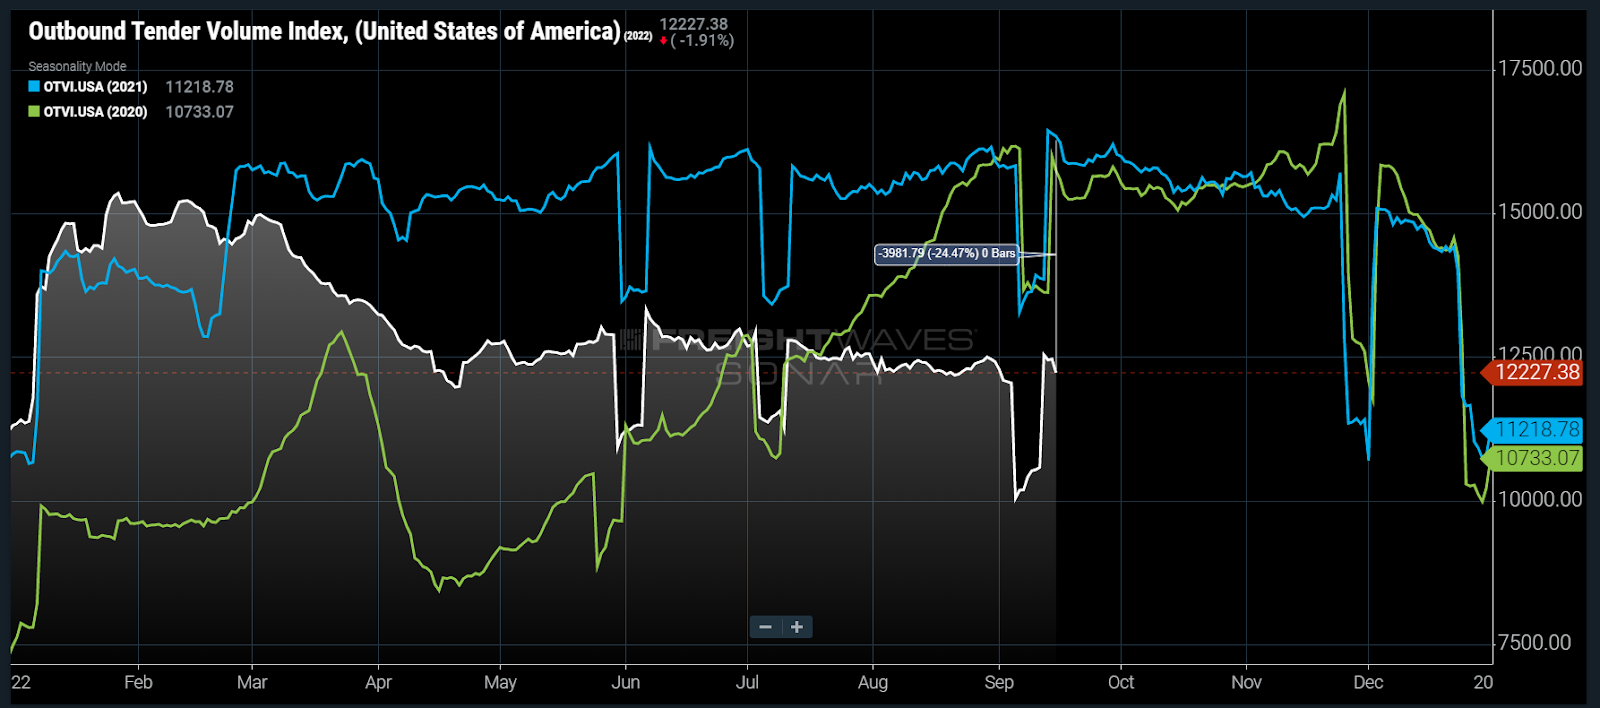
Truckload demand has eroded significantly over the past several months. National tender volumes have fallen 24% over the past year, which has deflated the spot market and put downward pressure on rates. Demand out of the Ontario market averaged nearly 30% lower from an annual perspective in August. As of Friday that figure had recovered to a 21% annual decline.
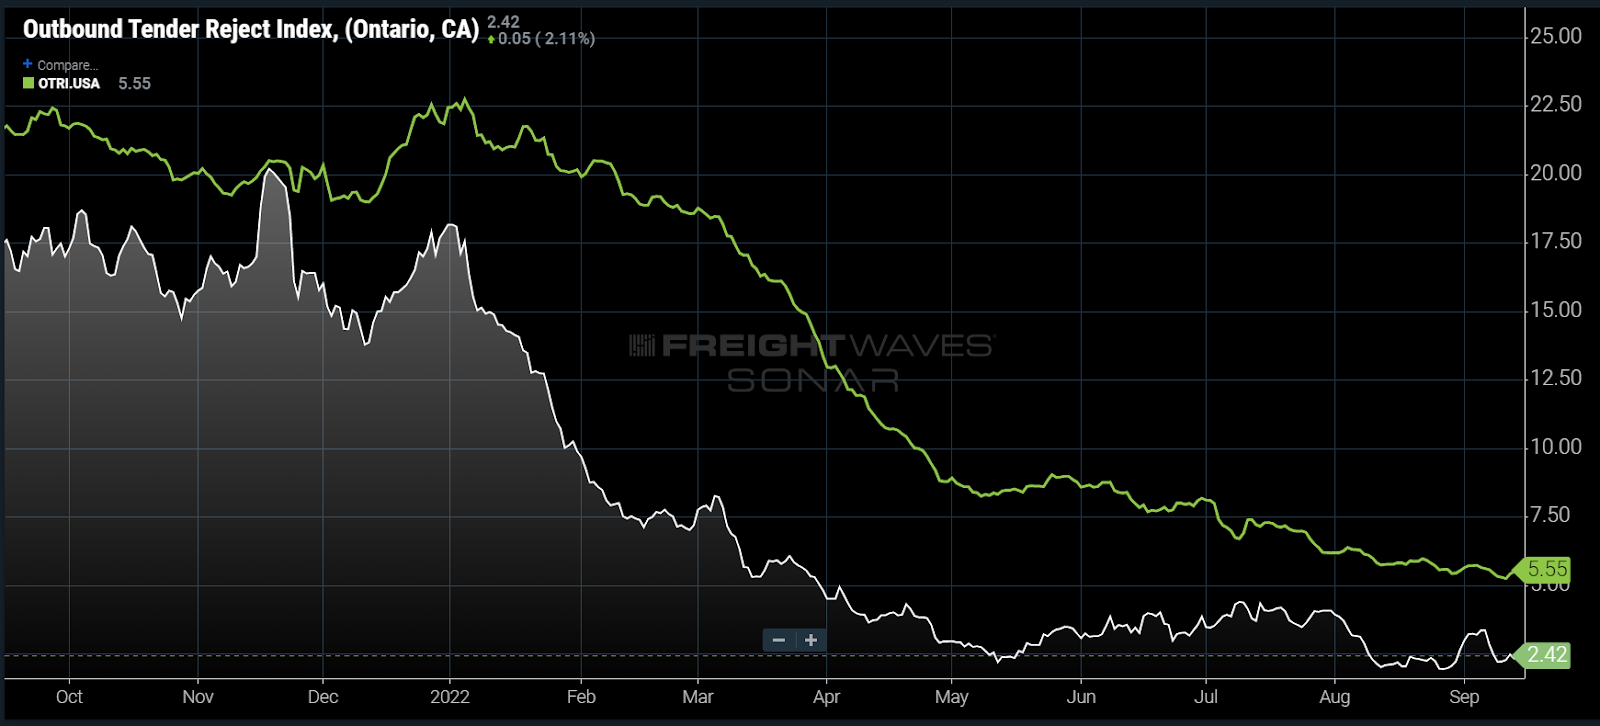
While this is still not enough demand to push rates upward, many carriers have adapted their networks to the elevated demand of the pandemic era. Ontario’s tender rejection rate — the rate that carriers reject requests for truckload capacity — has plummeted from 18% at the start of the year to 2.4% after Labor Day.
The recent spike in demand did not impact the rejection rate as capacity was readily available. Southern California continues to boast one of the lowest outbound tender rejection rates in the U.S.
Now that the rail strike has been seemingly averted, there is a question whether or not this trend will have any longevity to it. A short burst of long-haul demand out of Southern California is easy to manage, but if it persists, networks struggle to keep pace.
If nothing else, this situation illustrates that there is still potential for transportation markets to fall back into chaos as shippers are now much more responsive and proactive than they were prior to 2020. For now, carriers can enjoy a boost to their utilization but would be wise not to expect a long-term trend to manifest.
About the Chart of the Week
The FreightWaves Chart of the Week is a chart selection from SONAR that provides an interesting data point to describe the state of the freight markets. A chart is chosen from thousands of potential charts on SONAR to help participants visualize the freight market in real time. Each week a Market Expert will post a chart, along with commentary, live on the front page. After that, the Chart of the Week will be archived on FreightWaves.com for future reference.
SONAR aggregates data from hundreds of sources, presenting the data in charts and maps and providing commentary on what freight market experts want to know about the industry in real time.
The FreightWaves data science and product teams are releasing new datasets each week and enhancing the client experience.
To request a SONAR demo, click here.
Supply Chain AI Symposium
Past the hype. Join operators, founders, and enterprise leaders figuring out how to deploy AI in supply chain.
F3: Future of Freight Festival
Industry-defining keynotes, rapid-fire technology demos, and industry leaders networking in experiences across Chattanooga - plus the inaugural F3 Awards Dinner featuring the FreightTech and Shipper of Choice reveals.
Past the hype. Join operators, founders, and enterprise leaders figuring out how to deploy AI in supply chain.
The Old Post • Chicago, IL Register NowIndustry-defining keynotes, rapid-fire technology demos, and industry leaders networking in experiences across Chattanooga - plus the inaugural F3 Awards Dinner featuring the FreightTech and Shipper of Choice reveals.
The Signal at Chattanooga Choo Choo • Chattanooga, TN Register Now
Doug
Trucking is dead beat