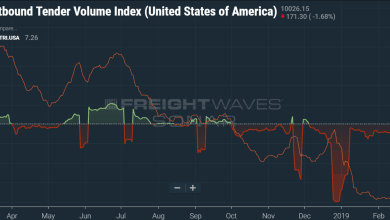
National freight volumes almost even year-over-year, capacity remains loose
National freight volumes are flat year-over-year, but capacity is as loose as ever. What is driving the discrepancy?
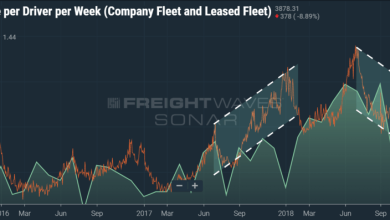
Increasing spot rates lead carrier revenues in 2018, will revenues start to fall now that rates have started to come down again?
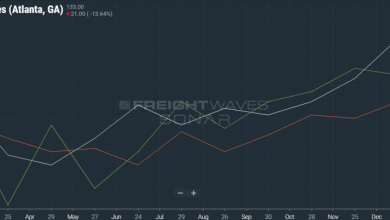
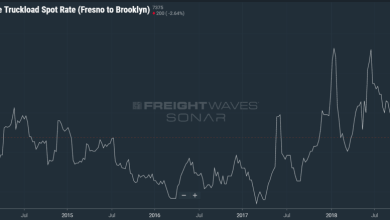
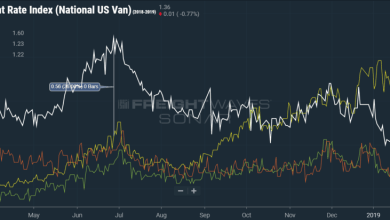
National spot rates have been flying high for the past year, but have only recently fallen under previous year values as illustrated on FreightWaves newest charting feature.
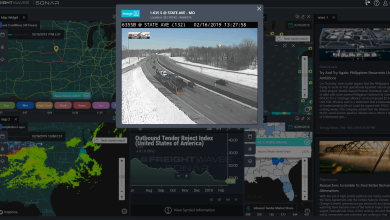
The newest release adds major weather data features, visualization and modeling tools, additional news features, and DOT highway cameras.
FreightWaves adds agricultural truckload prices and numerous warehousing and real estate data points to SONAR.
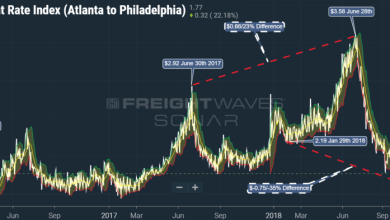
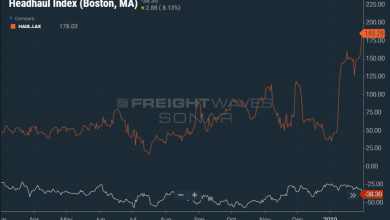
Atlanta to Philadelphia’s spot rate has hit its lowest point in 3 years. The absolute rates may be similar, but the freight markets could not be further apart.
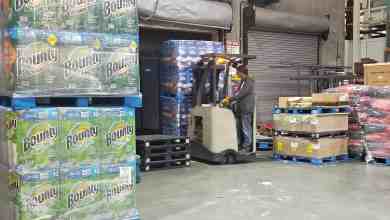
January used to be known as the worst month for freight, but consumer trends are starting to change that.
There are a lot of companies out there and it’s a number that is likely to shrink, according to the panel. Also on the agenda: blockchain and making yourself stand out in a crowded field.
Marten Transport and other public truckload companies could make a good stock investment if historical trends hold, says an analyst from Stephens.
The key benchmark OTRI sounded the alarms about weaker markets, but other indicators were telling a different story.
FreightWaves adds agricultural truckload prices and numerous warehousing and real estate data points to SONAR.
The two Super Bowl teams and their fanbases are very different, just like their freight market identities.
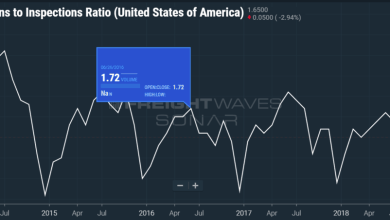
FreightWaves adds violations, fuel spread, and more rail data to SONAR platform
Driver detention has been causing headaches and lost wages for years, but the ELD mandate has shone a spotlight on the issue like never before. For the first time, carriers have the data to back up what they have always known.
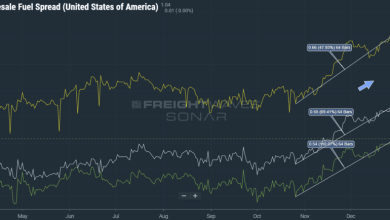
The DOE fuel price keeps sliding as wholesale or rack prices are increasing. This can have a negative impact to carrier margins in early 2019 after receiving the benefit of expanding fuel spreads in late 2018. SONAR’s newest index can help you monitor this.
Ben Murphy spent his life using data and technology to push trucking—the industry he loved—into the future.
Shipping trends of 2019 are requiring established freight carriers to evolve their operational models. UPS is developing more super-hubs to facilitate growth through handling more high margin shipments.
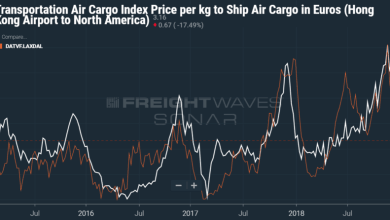
How can air cargo and dry van spot market rates be related? Could the movement of these two seemingly unrelated rates provide more evidence the market is slowing?
December was a month of growing uncertainty and severe declines in the U.S. financial markets. The only thing that seems to be growing is the level of ambiguity in everyone’s outlook.
It’s a long road from the wellhead down to the fuel going into a truck. Who makes money along the way?