
Chart of the Week: Intermodal Contract Savings Index – USA, Outbound Tender Rejection Index – USA SONAR: ICMSI.USA OTRI.USA
The cost differential between dry van truckload and intermodal contract rates expanded to multiyear highs over the winter as trucking costs expanded much more rapidly than the intermodal counterpart. Todd Maiden reported Wells Fargo believes 2021 will be a banner year for container shipping on the rails, citing strong year-over-year comps and sustained import growth. But we have already heard Union Pacific announce “peak-season” surcharges in the upcoming months as West Coast volumes have been challenging to handle. It is only a matter of time before the cost of shipping on the two modes converges and there are much bigger challenges looming in the form of reimagined supply chains.
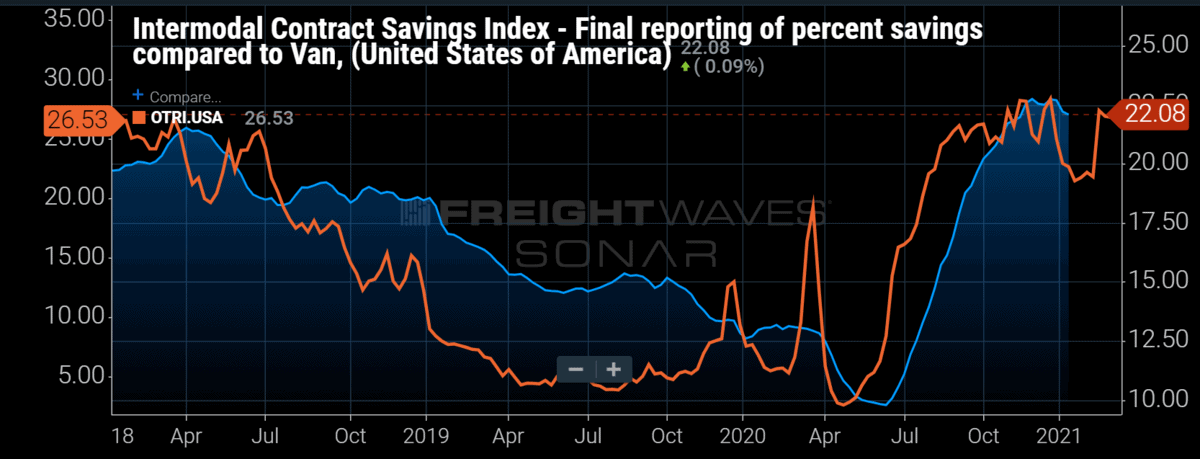
This past week FreightWaves rail and intermodal expert Mike Baudendistel wrote about the newly released Intermodal Contract Savings Index, which compares all-in dry van to intermodal contract rates, and broke down the reasons intermodal has a decisive cost advantage when the freight market tightens. The cost differential expanded to 22.7% in December. Trucking pricing tends to be much more volatile thanks to much more dynamic networks and customer base.
Intermodal shipping is dominated by the largest shippers in the U.S. and operates on a more static network, which gains higher cost efficiency than trucking over longer-mileage runs. Trucking has a decisive advantage on shorter, irregular runs moving in or out of less populated regions.
The chart shows the relationship between tight trucking markets and increasing cost variance between dry van truckload and intermodal shipments. As carriers reject more load offers, represented by the Outbound Tender Reject Index (OTRI), trucking rates increase as shippers fall down their provider lists or route guides. Carriers positioned further down the list tend to charge higher rates.
If their routing guide fails completely, they end up on the spot market. When this happens over a longer stretch of time, as has been the case in the back half of 2020, some shippers renegotiate new rates out of cycle. This rarely if ever happens on the intermodal side. Most of the costs are incurred in the form of temporary surcharges on the spot market, which represents a much smaller percentage of the overall volume than trucking.
With imports continuing to flood the ports and inventories still well below pre-COVID levels, intermodal should continue to have a strong year, but there are systemic risks once inventories are replenished and trucking stabilizes.
While there are always threats of companies sourcing from different places, the impacts to bottom lines in 2020 have increased the need for alternative sourcing in order to mitigate risks to inventory levels.
This may mean reshoring to places like Europe or closer to home in North America. While not eliminating the need for containers, this could dramatically reduce the time spent on the rails as freight moves over shorter distances. Freight sourced in rural areas where costs are lower will not have the option of moving on the rail.
The increase in e-commerce will mean more warehousing with more focused inventory scattered across the country in areas with lower population density and less infrastructure — something less-than-truckload companies should benefit from.
The future supply chain model looks a lot more flexible. Though very efficient over long distances and cost-effective, flexibility and short movements are not intermodal’s strengths. The need for long-haul capacity moving more than 800 miles is not going away, but looking beyond 2021 there are some eroding factors the sector will need to address to grow.
About the Chart of the Week
The FreightWaves Chart of the Week is a chart selection from SONAR that provides an interesting data point to describe the state of the freight markets. A chart is chosen from thousands of potential charts on SONAR to help participants visualize the freight market in real time. Each week a market expert will post a chart, along with commentary, live on the front page. After that, the Chart of the Week will be archived on FreightWaves.com for future reference.
SONAR aggregates data from hundreds of sources, presenting the data in charts and maps and providing commentary on what freight market experts want to know about the industry in real time.
The FreightWaves data science and product teams are releasing new datasets each week and enhancing the client experience. To request a SONAR demo, click here.
Freight Fraud Symposium
Double brokering. AI deepfakes. Identity theft. Freight fraud is an existential threat to the industry. Get ahead of it.
Supply Chain AI Symposium
Past the hype. Join operators, founders, and enterprise leaders figuring out how to deploy AI in supply chain.
Future of Rail Symposium
Reshoring is rewriting freight demand. Join shippers, rail executives, and government officials to shape the next decade.
Double brokering. AI deepfakes. Identity theft. Freight fraud is an existential threat to the industry. Get ahead of it.
Rock & Roll Hall of Fame • Cleveland, OH Register NowPast the hype. Join operators, founders, and enterprise leaders figuring out how to deploy AI in supply chain.
The Old Post Office • Chicago, IL Register NowReshoring is rewriting freight demand. Join shippers, rail executives, and government officials to shape the next decade.
The Signal at Chattanooga Choo Choo • Chattanooga, TN Register Now