The ‘ingenious strategy’ behind most truckers’ least favorite week of the year: International Roadcheck

truck fallen over

International Roadcheck Week is hardly the sexiest topic in trucking, but it is a darn-tootin’ important one. Inspectors in the U.S. and Canada halt tens of thousands of trucks for vehicle inspections for a few days every summer or early fall. They remove thousands of trucks and drivers from the road; in 2021, 16.5% of inspected vehicles were put out of service along with 5.3% of drivers.

It’s uncommon for truck drivers to actually get their vehicles inspected at random during most of the year. To avoid International Roadcheck Week, many truckers simply don’t drive during that period of time — which, presumably, means more unsafe vehicles and drivers on the road outside of the inspection blitz. It’s a question that ate at Andrew Balthrop, a research associate at the University of Arkansas Sam M. Walton College of Business. 

Around 5% fewer one-person trucking companies are active during International Roadcheck Week. But Balthrop and his fellow researcher, Alex Scott of the University of Tennessee, found a major upside to the inspection blitz — even with all the folks who avoid it. According to their working paper published in March 2021, vehicles are safer a month before and after the inspection period. There’s a 1.8% reduction of vehicle violations, according to Balthrop and Scott’s analysis. Surprise inspection blitzes don’t result in the same uptick of compliance. 

I caught up with Balthrop about his research last week at FreightWaves’ Future of Supply Chain conference, and we chatted again on the phone this week about his findings on International Roadcheck Week.

Enjoy a bonus MODES and a lightly edited transcription of our phone interview: 

FREIGHTWAVES: For our readers who are not aware of what Roadcheck Week actually is, can you explain a little bit about what it and why it is important to drivers and companies?

BALTHROP: “The International Roadcheck is part of an alliance between the inspectors in Canada and the ones in Mexico and the U.S. to have a unified framework for making sure trucks are safe to operate. That should make it easier to go across borders when you have this kind of unified structure.

“In the U.S., one of these CVSA inspection blitzes is the International Roadcheck that happens for three days in the summer. Usually it’s a Tuesday, Wednesday and Thursday. And usually it’s the first week in June.

“And in it, they focus on Level One inspections, the North American Standard Inspection where they inspect the driver records, the hours of service, the licensure and I believe medical records as well. Then they inspect the truck. It’s an in-depth inspection where the inspector will actually crawl under the truck to look at various things. And these inspections, from the data that I’ve seen, take about a half an hour on average.

“During the Roadcheck Week, they’ll do about 60,000 inspections, so 20,000 a day. They’re going to pull over a lot of trucks, and this can cause a little bit of congestion at the weigh stations and the roadside inspections localities as the inspectors are doing these inspections.”

Roadcheck Week doesn’t catch all truck drivers, but it has a long-lasting benefit to safety

FREIGHTWAVES: So, can most drivers kind of expect to be pulled over? How likely is that?

BALTHROP: “There’s 1 million or 3 million trucks on the road, somewhere around there on any given day. With 20,000 inspections, most drivers still will not get inspected, but there’s going to be a higher proportion of drivers inspected. 

“You’re more likely to get inspected on these days. If you don’t have a recent inspection on your record, or if you have a bad recent inspection on your record, you’re more likely to be pulled over on these days.”

FREIGHTWAVES: Your research focused on that it’s just unusual that this inspection is announced, that it’s planned. We were talking before about how normally, if you’re trying to assure quality or compliance, you would not announce an inspection in advance. It would be more of a surprise-type situation. 

Can you walk us through why that’s so unusual, or what’s the rationale that you see behind announcing it in advance?

BALTHROP: “It is unusual, and on the surface, it doesn’t make much sense, but it turns out to be kind of an ingenious strategy. So I’ll walk through it here. 

“Over the course of a year, there’ll be 2 million inspections of 3 or 4 million trucks out there. The average rate of inspections is pretty low. It’s not uncommon for truckers to go years without having an inspection. With this low inspection intensity, the FMCSA has sort of a problem of, how does it get anybody to abide by the regulations?

“I’m a jaded economist, and I don’t worry or consider too much ethics and morality and all that kind of stuff. It comes down to incentives for drivers to follow these inspections. The incentives do guide behavior. So, how could the FMCSA incentivize drivers to follow these regulations more closely and adhere to the standards?

“They do this by announcing the blitz. This does two things. On one side, it allows everybody to prepare in advance. There’s a bunch of anecdotal evidence out there that people do prepare for these blitzes in advance. They will have their trucks inspected beforehand for any problems. They’ll time maintenance and upkeep in advance to make sure that their vehicles are in order. “They’ll be a little bit more cognizant of the driver-side regulations. One thing we notice in our study is that hours-of-service violations really drop during these extensions, because people see them coming. They don’t fudge the books in any way.”

Owner-operators can evade Roadcheck Week. Big carriers, not so much.

BALTHROP: “The issue with the announcement, on the flip side, is that it allows people to just dodge the inspection entirely. For a long time, people have talked about how owner-operators and smaller carriers time their vacations for this particular time. They could do this for a couple reasons. To avoid the hassle is a nice way to put it, but it also allows you to be noncompliant to avoid the high-intensity inspections.

“You have this balance here that on one side you get the behavior you want with people complying with regulations. That’s the behavior the FMCSA wants. But on the flip side, you get a bunch of people that are kind of outright dodging inspections.

“When you compare these two things on balance, the policy is actually pretty effective because you get a lot of people focused on maintaining their trucks and obeying the rules during that particular week. Especially with the vehicle maintenance stuff, that lasts a long time. 

“In our research, we saw that vehicle violations, a month before and up to a month afterwards, is when you still notice your vehicle violations. That trucks are kind of better maintained around these blitzes.

“The ingenious aspect of it is that the FMCSA, by concentrating their inspection resources all at one time and announcing it, they’re making it clear that they’re serious about enforcing these regulations and everybody prepares for it. For the number of inspections that are happening, you get fewer tickets than you would have otherwise expected.

“The FMCSA, they’re putting people through a little bit of a hassle, but they’re not having to write a bunch of tickets to get people to comply. They’re not really punishing a whole bunch of people because, by making this apparent that this is going to happen, people comply and the FMCSA gets what they want essentially without having to come down on carriers too hard.”

A convenient time for a vacation, indeed

FREIGHTWAVES: OK, interesting. And how does this pattern of shutting down, how does that compare for an owner-operator versus a driver for a big fleet?

BALTHROP: “If you’re a motor carrier with thousands of power units, you can’t just pack up and not do business on a particular day. They just don’t have that option. So they get inspected at a higher intensity, and you see the larger carriers kind of more focused on making sure that they’re prepared for these inspections. With so many inspections, the larger carriers are going to be inspected at higher rates. You can really damage your reputation if your equipment isn’t in order on this particular day. 

“Versus the smaller carriers, especially if you’re talking about a single-vehicle fleet, an owner-operator type, it is not that difficult to just not work for those three days. And so you see a lot about that. 

“In terms of what the roadway composition looks like, if we look at inspection data and relative to a typical day with the usual inspections, on these Roadcheck days, you have about 5% fewer owner-operators on the road than you otherwise would expect.”

FREIGHTWAVES: Wow. And when you say owner-operators, you also mean just like fleets with just —

BALTHROP: “One-vehicle fleets.”

FREIGHTWAVES: OK, that’s interesting.

BALTHROP: “You know, you see a little bit of effect with the smaller fleets, below six vehicles, but it basically disappears by the time you get to a hundred vehicles.

“This effect is being driven by smaller carriers staying off the road in terms of avoidance. You see this goes also how you would expect; it’s also older vehicles that stay off the road. This is correlated with carrier size. The larger carriers use newer vehicles and owner-operators tend to use some of the older vehicles. But it’s particularly the older vehicles that are off the road.

“This makes intuitive sense. Older vehicles are more costly to keep compliant. Maintenance is more costly, and they’ve been around longer so there’s time for more stuff to have broken essentially.

How a truck driver gets stopped for inspection

FREIGHTWAVES: Can you explain a little bit more, the idea of having this inspection history and why it would benefit a larger or small carrier?

BALTHROP: “Getting flagged for inspection is sort of random, but not totally. If somebody notices something obviously wrong with your truck, that’s ground for a more in-depth inspection. Or if you get pulled over for some other reason, this can be grounds for inspection of some type. 

“But there’s also the inspection selection service. The computer program that is random, that it randomly flags people in for inspection, but it’s based on your inspection history.

“So if your firm hasn’t been inspected recently, or if your carrier doesn’t have a very dense inspection history, you’ll be more likely to trigger that system to pull you in and have you inspected. If you have a dense inspection history, you’re less likely to get inspected.”

FREIGHTWAVES: So how do you get pulled over for inspection? As a person who only drives a passenger car, my main interaction with being pulled over is, I’m driving down the freeway or wherever, and I get stopped by the police. How does it work for a truck driver? How does getting pulled over or inspected work in that way?

BALTHROP: “The law is that you cannot pass a weigh station without pulling in and getting weighed. At that point they may flag you to be inspected. Now, in the past decade or two, there’s been a bunch of electronic devices that are installed in cabs. You may have heard of PrePass or Drivewise. This allows you to pass weigh stations. 

“I don’t have data on how many trucks have the in-cab devices. But from a trucking perspective, they’re so convenient that you don’t have to stop every time you cross a state line. I think the vast, overwhelming majority of trucks have some sort of one of these electronic devices. The DOT inspectors at these roadside inspection points have a dial they can twist essentially about how many people they want to inspect. 

“So during the roadcheck inspection week, they’ll crank that dial all the way up and pull everybody over. And if they get too backed up, they might crank it back down a little bit and so on.”

FREIGHTWAVES: OK, interesting. It reminds me of a highly sophisticated E‑ZPass.

A $10 million-plus expense to trucking companies every year … but it’s worth it if just one fatal crash is avoided

FREIGHTWAVES: Zooming out, when we hear about large truck crashes, something like a vehicle maintenance issue is not really the most sexy explanation. But just looking at the FMCSA data, in 29% of all truck crashes, a major factor is brake problems. So it seems like a lot of the truck crashes on the road are caused by vehicle maintenance, versus something like the driver using illegal drugs or some other sort of more dramatic explanation. Can you speak a little bit to why this sort of vehicle maintenance is important for safety in preventing large crashes?

BALTHROP: “We did a little bit of a back-of-the-envelope cost benefit analysis of this. Let me try and make sure I remember it clearly, but we have it in the paper that the cost of this on one side is that you have the compliance costs the firms are undertaking, and then you have to add to that the delay costs from doing this, and then the cost of the inspection itself, having to pay federal inspectors to do this.

“On the benefit side, it reduces crashes. So when we add up, just looking at the cost of what an inspection is, we don’t have a good idea of how to measure the compliance cost. It’d be fun to measure the delay cost, but I don’t have good enough price data on that to get at that cost. 

“But if you look at what the cost of an inspection is, it is something like $100 or $120 is what you would pay to have one of these inspections done privately. A lot of people do this in the run-up to inspections, and have it done privately so that you can fix whatever the problems are and be sure that you would pass the FMCSA inspection.

“With that $120 figure, if you aggregate that up to 60,000 inspections or whatever, and you take that in comparison, I’m going to give you a bad figure here, it’s on the order of $10 million. That is about the value of a statistical human life. Looking at this economically, it’s worthwhile if it saves one human life. If you identify just one faulty brake system that would’ve resulted in an accident, you’re getting some value out of the program. 

“When you add those other costs in there, we’re going to need to save a couple of lives, but in terms of cost benefit analysis with this kind of stuff, we’re usually looking at orders of magnitude differences in cost and benefits to say something for sure. 

“If you can save just a couple lives, this program will pay for itself.”

Time to start inspecting in the winter

FREIGHTWAVES: Then one last question: Is there any rationale for this program happening in the summer? 

BALTHROP: “I think part of it is that for the inspectors this gets much harder and much more miserable to do in winter conditions.”

FREIGHTWAVES: That makes sense.

BALTHROP: “Inspectors are less productive. One of the things that we talk about in the paper, that they have in addition to the International Roadcheck, is that they have Brake Week where they focus a little bit more on brake inspections. You have Operation Safe Driver a little bit later on in the summer, usually in September, where it’s a little bit more focused on passenger vehicles and how they drive around these trucks.

“But there’s not one in the winter time. There’s an unannounced brake check that usually happens in May, a surprise inspection that’s just one day. But you’re right in pointing out that it might be worthwhile having one of these in the wintertime. You have this periodic high-intensity inspection that kind of incentivizes everybody to be compliant through the summer. 

“But there’s nothing in the winter, so that’s an area. But if I was managing the FMCSA, that would be one of the first questions I ask, ‘Why don’t we have one of these in the wintertime?’”

FREIGHTWAVES: That makes sense. Maybe they can do it in the South or something. Maybe a Miami January inspection … 

That’s it for this special bonus MODES. Subscribe here if you’re not already receiving MODES in your inbox every Thursday. Email the reporter at rpremack@www.freightwaves.com with your own tales on International Roadcheck Week or any other trucking topics. 

Why the Northeast is quietly running out of diesel

The nozzle of a diesel fuel pump is inserted into the tank of a commercial truck as its driver looks on the bankground.

The East Coast of the U.S. is reporting its lowest seasonal diesel inventory on record. And some trucking companies appear spooked.

The East Coast typically stores around 62 million barrels of diesel during the month of May, according to Department of Energy data. But as of last Friday, that region of the U.S. is reporting under 52 million barrels. 

The sharp increase of diesel prices has been a major stressor in America’s $800 billion trucking industry since the beginning of 2022. According to DOE figures, the price per gallon of diesel has reached record highs — a whopping $5.62 per gallon. It’s even higher on the East Coast at $5.90, up 63% from the beginning of this year. 

When relief is coming isn’t yet clear, and experts say higher prices are the only way to attract more diesel into the Northeast.

“I wish I had some good news for the Northeast, but it’s bedlam,” Tom Kloza, global head of energy analysis at OPIS, told FreightWaves. 

2022 has seen record-setting diesel prices. (SONAR)

Everyday Americans don’t fill up their cars with diesel, but the fuel powers our nation’s agriculture, industrial and transportation networks. More expensive diesel means the price of everything is liable to increase. Trucks, trains, barges and the like consumed about 122 million gallons of diesel per day in 2020. 

Patrick DeHaan, a vice president of communications at fuel price site GasBuddy, reported that retail truck stops are hauling fuel from the Great Lakes to the Northeast, calling it “extraordinary.” We’ve also seen anecdotal reports from truck drivers posting company memos:

Pilot Flying J and Love’s, two of America’s largest truck stops, told the Wall Street Journal yesterday that they were not planning to restrict diesel purchases, but were monitoring low diesel inventory.

Not unlike every other supply chain crunch we’ve seen in the past few years, the cause of the Northeast’s diesel shortage is multifaceted. A yearslong degradation of refineries is rubbing against the Gulf Coast preferring to ship its oil to Europe and Latin America.

Here’s a breakdown:

1. The East Coast has lost half of its refineries. 

As Bloomberg’s Javier Blas wrote on May 4 (emphasis ours): 

In the past 15 years, the number of refineries on the U.S. East Coast has halved to just seven. The closures have reduced the region’s oil processing capacity to just 818,000 barrels per day, down from 1.64 million barrels per day in 2009. Regional oil demand, however, is stronger.

Rory Johnston, a managing director at Toronto-based research firm Price Street and writer of the newsletter Commodity Context, told FreightWaves that refining is a “thankless industry,” with intense regulations that have limited the opening of new refineries. The Great Recession of 2008 led to several East Coast refineries shuttering, but there have been more recent shutdowns too. One major Philadelphia refinery shuttered in 2019 after a giant fire (and it already had declared bankruptcy), and another refinery in Newfoundland shut down in 2020.

2. It’s a financial risk to bring diesel to the Northeast.

The Northeast has increasingly relied on diesel from the Gulf region. Much of that diesel travels to the Northeast through the famous and much-adored Colonial Pipeline. You may remember the 5,500-mile pipeline from last year, when a ransomware attack shuttered it for nearly a week!  

It takes 18 days for oil to travel on the Colonial Pipeline from its source in Houston to New York City (or, more specifically, Linden, New Jersey), Kloza said.

That’s a long enough time to prioritize Colonial pipelines financially risky for traders — or, as Kloza said, “incredibly dangerous” — thanks to a concept called “backwardation.”

Backwardation refers to the market condition in which the spot price of a commodity like diesel is higher than its futures price. It’s only gotten stronger over time in the diesel market, Kloza said. So, a company could send off a shipment of diesel and find that it dropped by $1 per gallon in the time the diesel traveled from the Gulf Coast to New York — er, New Jersey. That could mean hundreds of thousands or more in lost profits, so traders often avoid such a fate.

“We’re not in an era where there are any U.S. refiners or big U.S. oil companies who would ‘take one for the team’ and bring cargo in where it’s needed,” Kloza said. 

The desperation is showing in New England and the mid-Atlantic regions. New England diesel retail prices are up 75% from the beginning of 2022, per DOE data. In the mid-Atlantic, diesel is up 67%. 

It’s not worth the risk, even amid ultra-high prices. As FreightWaves’ Kingston reported last week, the spread between a gallon of diesel in the Gulf Coast and its New York harbor price is usually a few cents. Last week, that swung up to 66 cents.

But that uptick still isn’t justifying moving oil to the Northeast — particularly when traders can make so much more money selling diesel abroad. 

3. Of course, we can blame COVID and the crisis in Ukraine. 

The catalyst for this diesel shortage, of course, is the ongoing conflict in Ukraine — particularly Europe’s desperation for diesel after weaning off Russian molecules. 

As CNBC reported in March, Europe is a net importer of diesel. Europe consumed some 6.8 million barrels of diesel each day in 2019; Russia exported some 600,000 barrels per day of that. Today, Europe has only eliminated one-third of its Russian diesel, so prices are expected to continue to climb amid that transition. Latin America, too, has been clammoring for U.S. diesel.

The Gulf Coast has been happy to provide such diesel, amid “insane” prices for diesel abroad, said Johnston. Waterborne exports of diesel from the U.S. Gulf Coast hit record highs last month, according to oil analytics firm Vortexa. (The records only date back to 2016.)

Naturally, COVID is also to blame for the Northeast’s run on diesel. Those refineries still retained on the East Coast scaled back during the pandemic due to staffing issues. It takes six months to a year to reignite refineries that were previously shuttered, Kloza said.

The ‘everything shortage’ endures

It’s been a tale as old as, well, last year. An industry is quietly hampered by supply issues for years, or even decades, and COVID pulls back the curtains on its unsteady foundation. It’s particularly jarring for commodities we never thought about before, like shipping containers or pallets, but that quietly underpinned our livelihood all along. 

Recall the Great Lumber Shortage of 2020? Big Lumber had unusually low stockpiles of wood by the summer of 2020, thanks to a vicious 2019 in the lumber industry shuttering sawmills and the spring of 2020 sparking staffing issues. (There was also a nasty beetle infestation.) Those in lumber expected the pandemic to slow the economy, not ignite online shopping, construction and housing mania. It meant lumber went from around $350 per thousand board feet pre-pandemic to a crushing $1,515 by the spring of 2021. The lumber price roller coaster persists today.  

In diesel, there’s no beetle infestation, but there are plenty of other headaches. It all means higher fuel prices on the East Coast, particularly the Northeast, to lure molecules from the Gulf Coast. And, down the line, probably more expensive stuff for you. 

Do you work in the trucking industry? Do you want to say that you hate or love MODES? Are you simply wanting to chitchat? Email the author at rpremack@www.freightwaves.com, and don’t forget to subscribe to MODES.

Updated on May 13 with the latest comments from truck stops.

Exclusive: Central Freight Lines to shut down after 96 years

Nearly, 2,100 employees will be laid off right before Christmas. Central Freight Lines is the largest trucking company to close since Celadon ceased operations in 2019.


Waco, Texas-based Central Freight Lines has notified drivers, employees and customers that the less-than-truckload carrier plans to wind down operations on Monday after 96 years, the company’s president told FreightWaves on Saturday.

“It’s just horrible,” said CFL President Bruce Kalem.

A source close to CFL told FreightWaves that CFL had “too much debt and too many unpaid bills” to continue operating, despite exploring all available options to keep its doors open.

Kalem agreed.

“Years of operating losses and struggles for many years sapped our liquidity, and we had no other place to go at this point,” Kalem told FreightWaves. “Nobody is going to make money on this closing, nobody.” 

Central Freight will cease picking up new shipments effective Monday and expects to deliver substantially all freight in its system by Dec. 20, according to a company statement.

A source familiar with the company said he is unsure whether CFL will file Chapter 7 or “liquidate outside of bankruptcy,” but that the LTL carrier has no plans to reorganize.

The company reshuffled its executive team nearly a year ago in an effort to stay afloat, including adding the company’s owner, Jerry Moyes, as CFL’s interim president and chief executive officer. Moyes remained CEO after Kalem was elevated to president in July.

“I think it was surprising that there wasn’t a buyer for the entire company, but buyers were interested in certain pieces but not in the whole thing,” the source, who didn’t want to be identified, told FreightWaves. “Part of it could have been that just the network was so expansive that there was too much overlap with some of the buyers that they didn’t need locations or employees in the places where they already had strong operations.”

Third-party logistics provider GlobalTranz notified its customers that it had removed CFL as “a blanket and CSP carrier option immediately, to prevent any new bookings,” multiple sources told FreightWaves on Saturday.

CFL, which has over 2,100 employees, including 1,325 drivers, and 1,600 power units, is in discussions with “key customers and vendors and expects sufficient liquidity to complete deliveries over the next week in an orderly manner,” a CFL spokesperson said. Approximately 820 employees are based at the company headquarters in Waco.

Despite diligent efforts, CFL “was unable to gain commitments to fund ongoing operations, find a buyer of the entire business or fund a Chapter 11 reorganization,” another source familiar with the company told FreightWaves.

Kalem said the company had 65 terminals prior to its decision to shutter operations. 

FreightWaves received a tip from a source nearly two weeks ago that CFL wasn’t renewing its East Coast terminal leases but was unable to confirm the information with CFL executives. 

Another source told FreightWaves that some of the LTL carrier’s West Coast terminals had been sold recently, but that no reason was given for the transactions.

At that time, Kalem said the company was “working to find alternatives” and couldn’t speak because of nondisclosure agreements. He said executives at CFL, including Moyes, were trying to do everything to “save the company.”

“Jerry [Moyes] pumped a lot of money into the company, but it just wasn’t enough,” Kalem said.

Kalem said he’s aware that a large carrier is interested in hiring many of CFL’s drivers but isn’t able to name names at this point. 

“Central Freight is in negotiations to sell a substantial portion of its equipment,” the company said in a statement. “Additionally, Central Freight is coordinating with other regional LTL carriers to afford its employees opportunities to apply for other LTL jobs in their area.”

As of late Saturday night, Kalem said fuel cards are working and drivers will be paid for freight they’ve hauled for the LTL carrier until all freight is delivered by the Dec. 20 target date.

“I’m going to work feverishly with the time I have left to get these good people jobs — I owe it to them,” Kalem told FreightWaves. “We are going to pay our drivers — that’s why we had to close it like we’re doing now. We are going to deliver all of the freight that’s in our system by next week, and we believe we can do that.”

During the outset of the pandemic, Central Freight Lines was one of four trucking-related companies that received the maximum award of $10 million through the U.S. Small Business Administration’s Paycheck Protection Program (PPP). This occurred around the time that CFL drivers and employees were forced to take pay cuts, a move that didn’t go over well with drivers.

“It all went to payroll,” Kalem said about the PPP funds. “Yes, our employees and drivers did take a pay cut over the past few years, and we gave most of it back, even raised pay over the past several months, but it just wasn’t enough to attract drivers.”

FreightWaves staffers Todd Maiden, Timothy Dooner and JP Hampstead contributed to this report.


Watch: Central Freight Lines’ impact on the LTL market


FreightWaves CEO and founder Craig Fuller reacts to the Central Freight Lines news:

“With Central struggling for many years and unable to reach profitability, it makes sense that they would want to liquidate while equipment and real estate are fetching record prices.”


Central Freight Lines statement

Here is the statement given by Central Freight Lines to FreightWaves late Saturday after reports surfaced of its impending closure:

“We make this announcement with a heavy heart and extreme regret that the Company cannot continue after nearly 100 years in operation. We would like to thank our outstanding workforce for persevering and for professionally completing the wind-down while supporting each other. Additionally, we thank our customers, vendors, equipment providers, and other stakeholders for their loyalty and support.

“The Company explored all available options to keep operations going. However, operating losses sapped all remaining sources of liquidity, and the Company’s liabilities far exceed its assets, all of which are subject to liens in favor of multiple creditors. Despite diligent efforts, the Company was unable to gain commitments to fund ongoing operations, find a buyer of the entire business, or fund a Chapter 11 reorganization. Given its limited remaining resources, the Company concluded that the best alternative was a safe and orderly wind-down. As we complete the wind-down process, our primary goal will be to offer the smoothest possible transition for all stakeholders while maximizing the amount available to apply toward the Company’s obligations.

“Central Freight is in negotiations to sell a substantial portion of its equipment. Additionally, Central Freight is coordinating with other regional LTL carriers to afford its employees opportunities to apply for other LTL jobs in their area. Discussions are ongoing and no purchase of assets or offer of employment is guaranteed.”


Brief history of Central Freight Lines

1925Founded in Waco, Texas, by Woody Callan Sr.
1927Institutes regular routes in Texas between Dallas, Fort Worth and Austin.
1938Dallas facility opens as world’s largest freight facility.
1991Receives 48-state interstate operating authority, expands into Oklahoma.
1993Joins Roadway Regional Group and begins service in Louisiana.
1994Expands into Colorado, Kansas, Missouri, Illinois and Mississippi.
1995Consolidation of Central, Coles, Spartan and Viking Freight Systems into Viking Freight Inc. is announced. Central’s Waco corporate HQ starts closure.
1996Becomes the Southwestern Division of Viking Freight Inc.
1997Investment group led by senior Central management purchases assets of former CFL from Viking Freight and reopens as a new Central Freight Lines.
1999Expands into California and Nevada.
2009CFL Network provides service to Idaho, Utah, Minnesota and Wisconsin.
2013Acquires Circle Delivery of Tennessee.
2014Acquires DTI, a Georgia LTL carrier.
2017Acquires Wilson; new division created with an increase of 80 terminals.
2020Wins Carrier of the Year from GlobalTranz.
Acquires Volunteer Express Inc. of Dresden, Tennessee.
Source: Central Freight Lines

Warehouse cramming is about to begin — Freightonomics

nVision Global, is a leading Global Freight Audit, Supply Chain Management Services company offering enterprise-wide supply chain solutions. With over 4,000 global business “Partners”, nVision Global not only provides prompt, accurate Freight Audit Solutions, but also providing industry-leading Supply Chain Information Management solutions and services necessary to help its clients maximize efficiencies within their supply chain. To learn more, visit www.nvisionglobal.com

Warehouse space is at a premium right now and with peak season right around the corner, shippers are starting to scramble for space. 

Zach Strickland and Anthony Smith look into what shippers are doing to prepare for the end-of-year crunch. They welcome Zac Rogers from Colorado State University to the show to talk through the industry tightness. 

The three also talk about the latest Logistics Managers Index results and what they mean for the fourth quarter of 2021. 

You can find more Freightonomics episodes and recaps for all our live podcasts here.

Seasonality pushing rejections and rates higher ahead of the Fourth

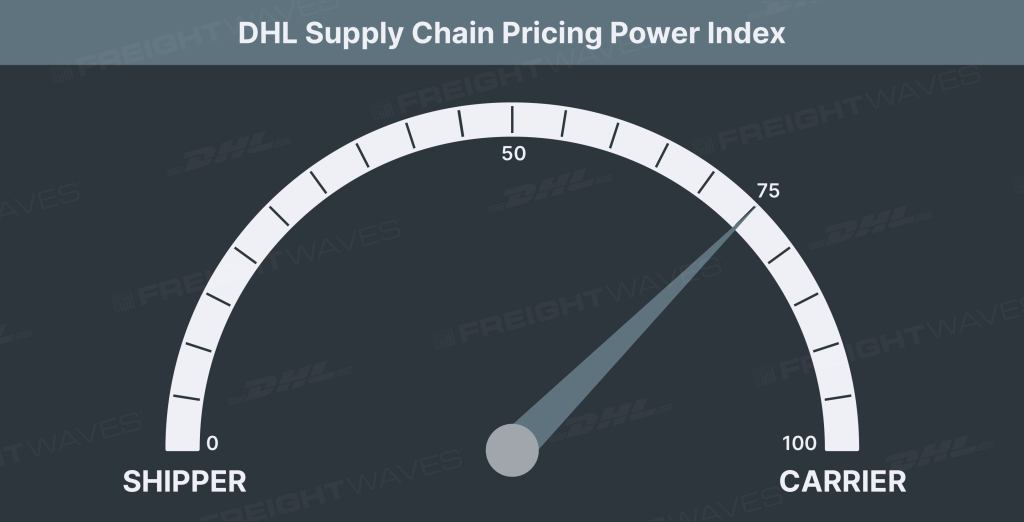
This week’s DHL Supply Chain Pricing Power Index: 75 (Carriers)

Last week’s DHL Supply Chain Pricing Power Index: 70 (Carriers) 

Three-month DHL Supply Chain Pricing Power Index Outlook: 70 (Carriers)

The DHL Supply Chain Pricing Power Index uses the analytics and data in FreightWaves SONAR to analyze the market and estimate the negotiating power for rates between shippers and carriers. 

The Pricing Power Index is based on the following indicators:

Load volumes: Absolute levels positive for carriers, momentum neutral

The Outbound Tender Volume Index at 15,980 is nominally higher now than basically at any point in the past 12 months with the exception of the week prior to Thanksgiving/Black Friday last year. OTVI captures all electronic tenders, including rejected ones, so when accounting for the rejection rate, we can get an even more accurate look at volumes. 

OTVI rose through the back half of May into the national holiday and has risen even further since. Throughout the back half of May and into the middle of June, tender rejections declined substantially. Meaning, current volume throughput is actually understated when comparing OTVI now to OTVI in November 2020. After adjusting for rejected tenders, the accepted outbound tender volume index is just 2.2% below the 2020 peak in November. At that time, OTVI surged towards 17,000, but the rejection rate moved in-kind towards its natural ceiling of 28%. So, the total accepted freight tenders in mid-June is comparable to the peakiest of peak seasons in 2020. Incredible. 

However, since the middle of June, tender rejections have begun increasing again heading into Independence Day, a time when many drivers spend time off the road with their families. The move higher in OTVI this week has been driven primarily by higher rejection rates, rather than higher freight demand. 

Over the past month, the drivers of freight volumes have continued to be imports and from just about every port. The west coast continues to provide seemingly non-stop container ships, while Houston, New Orleans, Miami and Savannah are seeing very strong throughput as well. 

It is van volumes that are driving freight markets higher right now. The Reefer Outbound Tender Volume index has tumbled 25% since its all-time high in the weeks after the polar vortex in February. Since Memorial Day, ROTVI has fallen another 10.5%. This is likely a factor of declining grocery demand, but I would expect the trend to reverse course in the near future as summer festivities accelerate. 

Dry van volumes pushed higher in the back half of May and into June while reefer volumes have declined significantly. 

SONAR: VOTVI.USA (Blue); ROTVI.USA (Green)

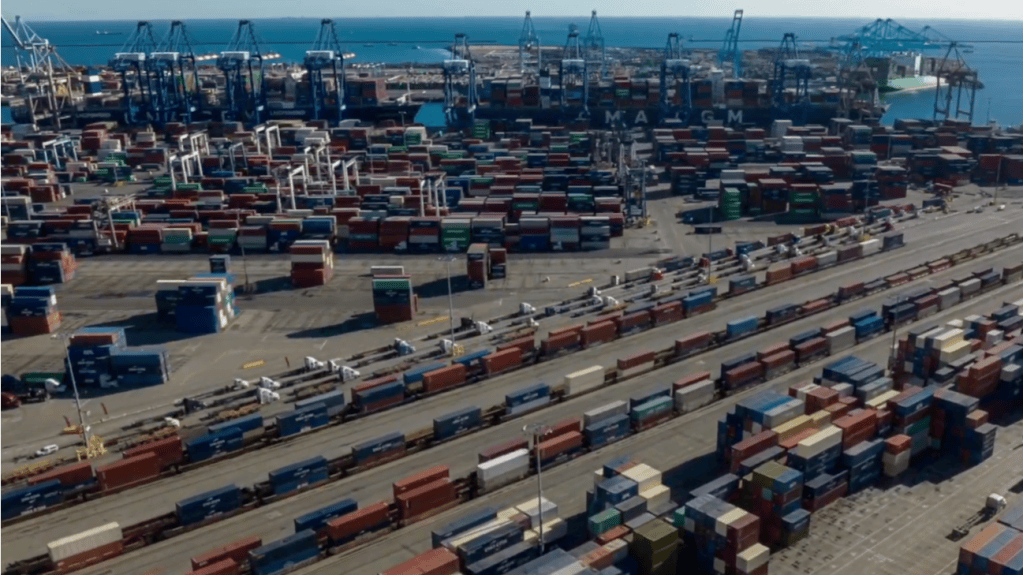
The congestion at our nation’s ports has spread from Los Angeles and Long Beach to Oakland, California. The California coastline is a parking lot of container ships, most of which are full to the brim with imports, awaiting berth. As detailed in the economic section, there are some signs that the reversion is underway with Americans paring back spending on pandemic superstar categories in favor of airlines, lodging and entertainment. But spending remains strong despite the moderation, and low inventory levels offset much of the decline that will occur from slowing demand. Real inventories are 3% higher now than pre-pandemic, but real sales growth is far outpacing inventory growth, leading to the lowest inventory-to-sales ratio in decades. 

On the manufacturing side, the ISM Manufacturing PMI expanded in May after declining in April. We’ve been in expansionary territory for 12 consecutive months. New orders, production, imports/exports and employment are all growing. The major issues should come as no surprise: Deliveries are slowing, backlogs are growing and inventories are too low. 

In all, there are many, many catalysts to keep freight demand strong for the foreseeable future. Americans are traveling and spending on services at a high clip, but the high savings rate is enabling it to occur without a massive detriment to goods spending. 

SONAR: OTVI.USA (2021 – Blue; 2020 – Green; 2019 – Orange; 2018 –  Purple)

Tender rejections: Absolute level and momentum positive for carriers

After declining steadily from mid-March to mid-May, the Outbound Tender Reject Index has reversed course heading into Independence Day. This is typical for a national holiday as carriers selectively choose loads to bring drivers closer to home. OTRI now sits above 25% for the first time in June. 

One of our newest indices in SONAR gives us the ability to compare markets on as close to an apples-to-apples basis as possible. FreightWaves’ Carrier Trend Market Score indices are divided into two perspectives – shipper/broker and carrier. The scores are positioned on a scale from 1-100 and have values measuring van and refrigerated (reefer) capacity. The higher values represent more favorable trends for whichever perspective. For instance, a value near the high-end of the range would suggest very favorable conditions for carriers in our carrier capacity trend score index. 

For the past several weeks, capacity disparities have been driven by import volumes. The markets with the tightest carrier capacity coincide with the nation’s busiest ports. Ontario, California, Savannah, Georgia, and Atlanta all have carrier capacity trend market scores of 100. 

SONAR: Capacity Trend Market Score (Carriers – VAN)

By mode. Reefer rejection rates tumbled from it’s all-time high in March to under 35% in mid-June before popping higher over the past two weeks. Reefer rejections are still quite high from a historical standpoint at 38%, but are significantly lower than just three months ago when reefer carriers were rejecting half of all electronically tendered loads. 

SONAR: VOTRI.USA (Blue); ROTRI.USA (Orange)

Dry van tenders make up the majority of all tenders, so the van rejection rate mirrors the aggregate index closely. Van rejections have surged from ~23% to ~26% over the past two weeks. 

Yes, one-in-four loads being rejected is not ideal, but it’s better than 30%. I am unaware of any meaningful signals that capacity is being added at a rate that would change my outlook. With so many catalysts for demand, and many constraints on drivers including the Drug & Alcohol Clearinghouse, driver training school closures and continued government unemployment benefits, the outlook is tight throughout this year and into 2022. That’s not to say we won’t see improvement as consumers revert to pre-pandemic spending habits and drivers enter or reenter the market. But I’m not expecting any quick reversal of this environment; there are simply too many catalysts driving volume and suppressing capacity. 

SONAR: OTRI.USA (2020/21 – Blue; 2020 – Green; 2019 – Orange)

Freight rates: Absolute level and momentum positive for carriers

Throughout June, spot rates have moderated while contract rates have pushed higher. The Truckstop.com dry van rate per mile (incl. fuel) has fallen from $3.21 to $3.11 since the beginning of June, while FreightWaves van contract rates have risen from $2.50 to $2.59/mile, exclusive of fuel. 

I still believe the Truckstop.com dry van national average will not retest the post-vortex surge pricing that brought spot rates up to an all-time high of $3.30. But, there aren’t many catalysts to bring spot rates down anytime soon either. Demand is unwavering with continued strong consumer goods demand, humming industrial recovery and a potentially cooling, yet still sizzling, hot housing market. And carriers can’t fill enough trucks to keep up with demand. 

Prior to the seasonal movements we’re seeing in tender rejections, routing guides generally had been improving through Q2. We should continue to see a convergence between spot and contract rates, but spot rates will remain historically very elevated throughout the summer as demand simply outstrips capacity. 

SONAR: TSTOPVRPM.USA (Blue); VCRPM1.USA (Green)  

Economic stats: Momentum and absolute level neutral

Several economic releases this week are worth noting.

Weekly jobless claims were released Thursday and give us one of the best close-to-real-time indicators of the overall economy.  This week, the data was again very promising as the labor market continues on a bumpy but trajectorially stable recovery path. 

First-time filings totaled 411,000 for the week ended June 19, a slight decrease from the previous total of 418,000 but worse than the 380,000 Dow Jones estimate, the Labor Department reported Thursday. Initial claims have held above 400,000 for consecutive weeks after falling to a pandemic low of 374,000 three weeks ago. As things stand, the current level of initial claims is about double where it was prior to the Covid-19 pandemic. 

The good news on the jobs front is that continuing claims are on the decline, falling to 3.39 million, a drop of 144,000. That number runs a week behind the headline claims total.

Initial jobless claims (weekly in May 2020-May 2021)

At the time of writing, the newest weekly data for the week ending May 29 had not been updated in SONAR. This week, claims fell from 405,000 to 385,000. 

SONAR: IJC.USA

Consumer. Turning to consumer spending, as measured by Bank of America weekly card (both debit and credit) spending data, total card spending (TCS) in the latest week accelerated to 22% over 2019. This is the first time in June that TCS has topped 20% over 2019, but spending has been running up 16-19% consistently on a two-year comp for months. For contect, the average pre-pandemic two-year growth rate was about 8% (from 2012 to 2019). 

The Bank of America team highlighted service spending in the nation’s two largest state economies, California and New York, which are now fully reopened. Spending at restaurants is now well above 2019 in both states, and the team believes there is more capacity for spending to accelerate in the states that were slower to reopen given pent-up demand. 

There was also a notable acceleration in spending on clothing this week, according to Bank of America. It could be a reversal from some softening in the early weeks of June, or an indication of people refreshing wardrobes ahead of a return to work, more travel and vacations. One tepid statement for freight markets from this week;s report: Leisure spending is on the rise and durable goods spending is flatlining.  

FreightWaves’ Flatbed Outbound Tender Reject Index, both a measure of relative demand and capacity, moves directionally with the ISM PMI. 

SONAR: ISM.PMI (Blue); FOTRI.USA (Green) 

Manufacturing. Over the past two weeks, regional manufacturing surveys have reported generally positive readings amid logistical challenges. The New York Fed’s Empire State business conditions index declined 6.9 points to 17.4 in June, retreating from strong readings the past two months. The Empire State Index is a diffusion index with a baseline of zero; any reading above zero indicates improving or expansionary conditions. 

Delivery times lengthened to a new record during the month, new orders and shipments fell, and inventories entered negative territory. The supply chain and transportation challenges are as visible upstream as downstream, but overall the manufacturing sector is handling. Growth continued throughout the second quarter in both the Empire State and Philly Fed indices. 

The Philadelphia Federal Reserve’s business activity index edged lower to a still robust 30.7 in June from 31.5 in the prior month. Unlike NY, the pace of shipments growth accelerated in the Philly region during June. The employment subcomponent rose to a very healthy 30.7 from 19.3 last month, the regional bank said. 

Record-long lead times, wide-scale shortages of critical basic materials, rising commodities prices and difficulties in transporting products are continuing to affect all segments of the manufacturing economy, but demand remains strong. 

For more information on the FreightWaves Freight Intel Group, please contact Kevin Hill at khill@www.freightwaves.com or Andrew Cox at acox@www.freightwaves.com.

Check out the newest episodes of our podcast, Great Quarter, Guys, here.

Project44 acquires ClearMetal to strengthen predictive tools

Project44, a leader in real-time visibility of the global supply chain, announced on Thursday it has acquired ClearMetal, a San Francisco-based supply chain planning software company that focuses on international freight visibility, predictive planning and overall customer experience. The terms of the acquisition were not disclosed.

ClearMetal, founded by top software engineers and data scientists from Stanford, Google and other Silicon Valley elites, has created a “continuous delivery experience” that leverages proprietary machine learning algorithms that can forecast supply chain disruptions. 

In an interview, Jason Duboe, chief growth officer at project44, explained that bringing in ClearMetal’s elite team is essential for the company’s future predictive solutions.

“Their team construct is fundamentally different. When you look at their data science, machine learning and computer science background, they are best in class,” he said. “Applying the team to solve really interesting challenges, starting with highly predictive ETA and deeper exception management to create more predictive analytics is really a key component here.”

Project44 recently acquired Ocean Insights to gain global supply chain vessel visibility and has announced it has expanded its truckload tracking services within Asia. Bringing on this new team of engineers will allow the company to capitalize on strong predictive tools, strengthening the supply chain of its customers.

“We’re going to be expanding deeper into Asia, and from a port perspective, getting data much earlier than competitors,” explained Duboe. “Our freight forwarder integrations will give us much deeper visibility from an end-to-end perspective in these regions.”

Along with the acquired skills the ClearMetal team will bring to project44, it brings a large book of customers, including large CPGs, retailers, manufacturers, distributors and chemical companies. These advanced use cases will strengthen the predictive planning tools, and project44 continues to expand into different customer markets.

“What we gain from ClearMetal is a holistic platform for anybody that joins the platform in the future,” said Duboe. “They have large customers with incredibly demanding and advanced use cases. So when it comes to order and inventory, functionality, supplier onboarding, and moving upstream into those processes, we can capture exceptions earlier on.”

Click here for more articles by Grace Sharkey.

Related Articles:

Project44 expands real-time visibility into China

Project44 reels in Ocean Insights in ‘largest acquisition in visibility space’

‘Project44’s vision has always been global’

Samsara makes AI agent platform generally available, reports 7x adoption growth

Samsara has made its Agent Studio platform generally available to all customers, opening its no-code AI agent builder to fleets and other businesses using its software. 

Samsara is recording AI-agent interactions about seven times faster than when it launched the tools in June, with its latest 500,000 interactions accumulating in 16 days, down from 112 days initially. Samsara measures AI agent adoption by the number of interactions, which it defines as a complete agent session through chat or voice.

Voice agents surpassed chat in interaction volume within four weeks of launch and have led every week since, Samsara said.

Most voice interactions to date have been calls initiated by agents and configured by the organizations using them, Samsara said. The company said more than 1,000 organizations use Samsara agents weekly, but did not specify how many organizations use voice agents specifically.

Samsara launched Agent Studio in June, but has now made it available to all customers on Tuesday. The platform lets customers build custom AI agents using operational data to perform tasks such as compiling reports, flagging potential hours-of-service violations and answering drivers’ questions based on company policies. The company did not disclose how many customers are using agents in production or how many have built custom agents. Agent Studio is included in existing Samsara subscriptions, the company noted.

The announcement comes as logistics companies work to move AI projects beyond pilot programs and demonstrate financial returns. 

A March 2026 Boston Consulting Group survey of more than 180 logistics providers and shippers found that about 40% of logistics service providers had deployed AI beyond pilot programs, but only about 10% had scaled it across core operations. Just 13% reported measurable value from AI. Unclear returns on investment and gaps in internal capabilities were among the leading barriers to broader adoption.

A separate September 2026 survey by Descartes found that 19% of shippers and 15% of logistics service providers were using AI at scale. The findings suggest that while AI is gaining a foothold in transportation, many companies have yet to deploy it broadly across their operations.

“AI is quickly adopted when it’s useful, and in physical operations that means an agent has to understand the operation and meet people where the work happens,” said Johan Land, Samsara’s chief product officer.

Samsara cited several customers using agents for reporting, compliance monitoring and driver communication.

Grand Isle Shipyard uses an agent to compile forms, inspection reports and asset data into monthly reports. Samsara said the process takes about five minutes per division, cutting report-generation time by 99%. The company estimated the change frees up about $100,000 in annual specialist capacity, though it did not provide the calculation behind that figure.

S. Bertram Foods uses an agent to track remaining stops, driving time and shift time to flag potential hours-of-service violations three hours in advance. Samsara said the system reduced weekly manual review time by 84%.

StreamTech Industrial uses an agent to identify trips in which drivers have not logged into their vehicles. Samsara reported a reduction of 500 hours in unassigned driving over two months.

The customer results were supplied by Samsara, which did not provide detailed measurement methods for all the reported outcomes.

Voice agents bring AI into the cab

Samsara says its voice agents can call drivers with instructions when trucks arrive at unfamiliar facilities, including information about entrances, parking, yard speed limits and required safety equipment. Drivers can ask follow-up questions, while managers can use operational data to investigate issues such as extended facility stops.

Specifically, Samsara said its voice agents deploy through its dash cams and operate hands-free. The hands-free design is significant because federal rules prohibit commercial drivers from holding a phone while driving, while allowing hands-free phone use. Organizations can configure agents to activate under specified conditions, such as when a vehicle enters or exits a designated geofence.

The company also offers Samsara Assistant, which lets users query operational information through its software dashboard, and Samsara MCP, which connects authorized Samsara data to external AI tools such as ChatGPT, Claude and Microsoft Copilot. Agent Studio adds a way for customers to create custom chat and voice agents for their own workflows.

For freight and logistics operators, the potential benefit is less time spent gathering information, monitoring compliance and answering routine questions. But the announcement offers limited evidence of how widely the agents are being deployed or whether the reported time savings translate into sustained financial returns. Those questions will matter as logistics companies weigh further investment in AI.

Why this matters: 

Freight and logistics companies are looking for ways to turn AI pilots into tools that deliver measurable operational value. Samsara’s usage figures suggest growing engagement with AI agents, but the company has not disclosed how many customers have deployed them or provided detailed methods behind customer-reported efficiency gains. Those metrics will help determine whether AI agents can deliver sustained returns beyond early use cases.

Despite new record, Port of LA chief warns of tariff-driven planning risk

The Port of Los Angeles moved 1.42 million TEUs in September, its best single month ever and the highest monthly volume ever recorded by a port in the Western Hemisphere, Executive Director Gene Seroka said this week. He said lower tariff levels, resilient consumer demand, and cargo shifting away from constrained Panama Canal and Suez routes drove the surge.

Record quarter

September imports totaled 546,000 loaded TEUs, up 19% year over year and 26% above the port’s five-year average. Exports rose 10% to 126,000 loaded TEUs, while the port handled a record 371,000 empty containers as carriers repositioned equipment to Asia.

July through September was the port’s strongest quarter on record at nearly 3 million TEUs, and June through September moved nearly 4 million containers. Through September, 2026 volume stood at nearly 8.1 million TEUs, up about 3% from the same period in 2025.

Seroka said the port expects October volume of about 900,000 TEUs. He cited typhoon-related schedule disruptions in Asia, cargo “roll pools” before China’s national holiday, and continued holiday-season replenishment as reasons volumes should remain elevated.

Trade and sourcing shifts

Seroka in a media briefing said Vietnam is now the port’s second-largest trading partner behind China, while Thailand has entered the port’s top five for the first time. Vietnam-origin volume through Los Angeles has quadrupled over the past decade, he said.

He said China’s share of port business has fallen from 60% to 40%, but added that diversification has been slower than many importers would like. Harvard Business School Professor Willy Shih, the briefing’s guest, said companies are increasingly “optimizing for options” rather than lowest cost, because frequent policy changes make long-term commitments difficult.

Shih said apparent shifts away from China often reflect changes in final assembly rather than a true reduction in upstream dependence, since Vietnam and Mexico still rely heavily on Chinese components. Building comparable supplier networks in Mexico could take about a decade, he said.

Tariffs and outlook

Seroka said tariffs remain a central source of uncertainty, with importers making rapid decisions based on cost, demand, and policy deadlines. He said purchase orders in Asia remain solid, but November and December are difficult to forecast.

He also said ocean carriers and shippers are shifting more cargo to Los Angeles from Panama Canal routings because of drought-related constraints and higher fuel costs tied to Middle East conflict. Shorter, faster transits have become more valuable, he said.

On operations, Seroka said the port is generally flowing smoothly, with truck turns healthy and large vessels turning in about four days. But he flagged rail dwell times as an area requiring close monitoring as the port moves holiday cargo inland.

Read more articles by Stuart Chirls here.

Read more:

Shippers waiting an extra week for US-bound containers

1 million boxes set new Los Angeles port record

Retailers say extended peak shipping season winding down

US West Coast container rates edge lower

Global container volumes hit record 17.46 million TEUs

25,000 Drivers Lost: US-Mexico Border Crisis Explained

Cross-border freight capacity is facing unprecedented challenges. With 25,000 Mexican driver visas revoked, and significant tender rejections at both the US-Mexico and US-Canada borders, rates are skyrocketing. Learn why these constraints are expected to continue well into 2027 and how it impacts your supply chain.

U.S. authorities have revoked visas for roughly 25,000 Mexican truck drivers, slashing the pool of qualified operators able to haul cross-border loads and sending rejection rates and spot rates sharply higher on key southbound lanes — a supply-side squeeze that FreightWaves data show is likely to persist well into 2027.

The capacity crunch is most acute at El Paso, where tender rejections peaked at roughly 24-25% in early July and still sit near 20%, according to FreightWaves SONAR. San Diego/Otay Mesa follows at about 10% rejections, up from 3.9% a year ago, while Laredo stands near 7% after briefly touching a low of 6.07% on Oct. 3 before rebounding to 7.78% by Oct. 10. The national tender rejection rate moved from 5.7% to 13.8% over the same period, underscoring that the border markets are tracking a broader tightening but have experienced outsized supply pressure.

“What is driving this is Mexico — there is not so much increased demand, but there’s certainly, whether short-term or whether it will be longer-term, we’re seeing a lot of reports of driver shortages,” said Julie Van de Kamp, who presented the SONAR analysis on the Oct. 13 broadcast.

“For that Mexican border, a lot of this revolves around lack of driver availability and visa revocations.” — Julie Van de Kamp

Spot rates on high-volume Mexico-origin corridors reflect the tighter conditions. San Diego-to-Phoenix rates are up 57% year over year, Laredo-to-Dallas is up 43%, Laredo-to-Chicago is up 35%, and El Paso-to-Dallas is up 28%. The Mexico Contract Volume Index shows volume is relatively stable — it recovered from a sharp drop in January but has not surged — meaning the rate pressure stems from fewer available drivers rather than a demand spike. Van de Kamp cautioned that Mexican cross-border volume data carry a reporting lag.

At the Canadian border, the dynamic is different: a freight imbalance rather than a driver shortage. Canadian exports remain firm, but weak northbound return freight makes it difficult for carriers to find backhauls, prompting some to avoid certain U.S. markets or demand premium pay. Rates on select Canada corridors are up 20% to 35% over the past six weeks. Canadian truckload volumes are running above year-ago levels on SONAR’s STVI index, while the Canadian rejection rate has climbed from roughly 4% to about 5.5% year over year and is expected to rise further through year-end. Van de Kamp noted the imbalance is also pushing some contract freight to spot to secure coverage, particularly in refrigerated.

Across both borders, the message for shippers and brokers is consistent: demand is relatively soft, but capacity is constrained and rates are rising. FreightWaves expects the tightness to continue well into 2027, with rejections running 2 to 3 times higher than a year ago on key border lanes.

  • US authorities have revoked B-1 visas for approximately 25,000 Mexican truck drivers, creating a driver shortage that is the primary driver of border capacity tightness.
  • Spot rates on key U.S.-Mexico lanes are up 28% to 57% year over year, with El Paso tender rejections peaking near 25% and still hovering around 20%.
  • Canada’s border crunch stems from a freight imbalance — strong exports but weak northbound return loads — pushing rejection rates to 5.5% and select corridor rates up 20-35% over six weeks.

This Summary is generated thanks to a transcription of the interview, for the full interview please enjoy the video above.

Canada Tariffs Are Changing Freight Strategy Fast

Canada-US trade tension is forcing fast changes in cross-border logistics. James Edge breaks down how importers, exporters and retailers are handling tariffs, shifting demand and new data requirements. In this FreightWaves conversation, Edge explains the real operator playbook: split U.S. and Canadian fulfillment, add warehouse capacity inside Canada, and stay ahead of changing customs rules. If you move freight across the border, this is the practical takeaway. #CrossBorder #CanadaTrade #Tariffs

Rapidly shifting U.S.-Canada tariffs are compelling importers and exporters to restructure their warehouse networks and sourcing strategies, according to James Edge, CEO of Cross Border at Bnode and chairperson at Landmark Global. Edge, who works daily with retailers moving goods across the U.S.-Canada border, said the unpredictability of policy changes — not the tariffs themselves — has been the hardest element to manage in 2025.

Edge offered a concrete example of how shippers are adapting: a client that had planned to serve both U.S. and Canadian customers from a single U.S. warehouse was forced to change course when tariffs hit. “We helped them set up a second Canadian warehouse,” Edge said, explaining that bulk importing into Canada lowers the effective tariff on individual orders. The client now fulfills Canadian orders domestically and U.S. orders from the American facility — a dual-node model Edge said many others are replicating.

“If an additional tariff means $5 extra, is that all of your margin, or do you have some room to play? That’s the math that’s going on.” — James Edge, CEO of Cross Border at Bnode

Beyond warehousing, Edge said sourcing flexibility has become critical. Brands heavily reliant on Chinese manufacturing are evaluating alternatives in Vietnam, Turkey, and Bangladesh to reduce tariff exposure. He added that retailers must also maintain rigorous data hygiene — including country of origin and product identifiers — because compliance requirements are shifting alongside tariff policy. “The changing tariffs and the management of those tariffs makes it difficult to do that cross-border shipment,” he said.

Canadian consumer sentiment is adding another layer of pressure. Edge noted that Canadian television is running commercials promoting domestic buying alternatives, which is dampening demand for U.S.-origin goods shipped northbound. He described the surge in Canadian nationalism as a new phenomenon: “It takes a lot to get the Canadians riled,” he said, calling the degree of friction between the two countries unprecedented in his experience.

On the technology front, Edge said artificial intelligence is already improving customs classification accuracy, with AI-assisted systems now achieving success rates “in the upper 90s” compared to roughly 80% with earlier machine-learning tools. However, he cautioned that the physical clearance process — including direct interaction with government agencies — remains firmly in human hands. Errors in customs documentation can result in delayed or seized shipments, raising the stakes for any over-reliance on automation.

Looking ahead, Edge said he expects tariff volatility to gradually stabilize into something more manageable, even if final rates remain higher than most importers would prefer. The geopolitical dimension, he acknowledged, is harder to forecast. His top advice for brands bracing for the next policy shift: get product data — origin, materials composition, classification — fully in order, and align with logistics partners who can navigate compliance requirements in real time.

  • Importers are splitting inventory into dual U.S.-Canada warehouse networks to reduce per-order tariff impact on Canadian fulfillment.
  • AI-assisted customs classification now reaches accuracy rates in the upper 90s, up from roughly 80% with earlier machine-learning tools, but human oversight of physical clearance remains essential.
  • Rising Canadian nationalism and ‘buy Canadian’ campaigns are suppressing northbound cross-border demand, adding a sentiment risk on top of tariff and compliance pressures.

This Summary is generated thanks to a transcription of the interview, for the full interview please enjoy the video above.

Diesel Prices Surge 20 Cents: Why the Fuel Market is in Crisis

Diesel prices just jumped 20 cents in a few hours, and experts warn we’re “running out of bullets” as inventories dwindle. We dive into the latest fuel market data, the impact of red-dyed diesel policies, and how geopolitical events are creating an unstable energy supply chain that could push prices much higher. Understand the real risks to your operations.

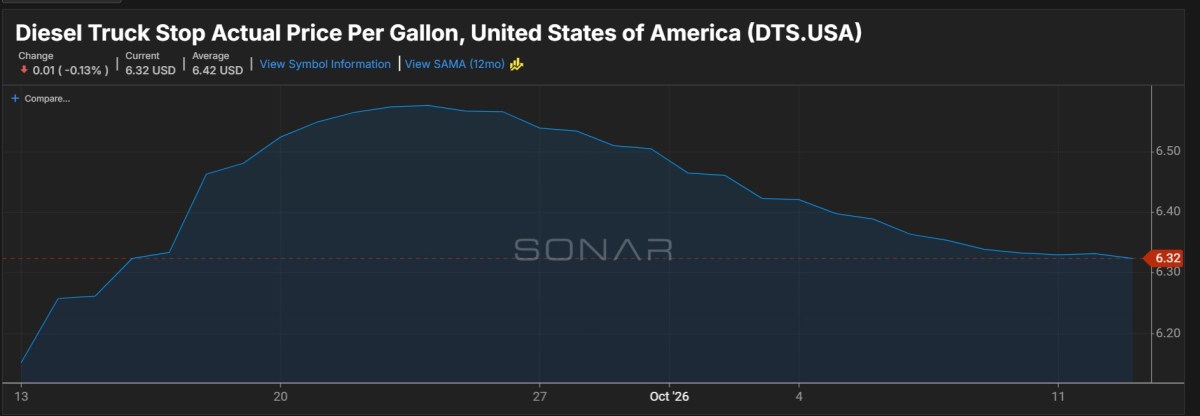
Ultra-low sulfur diesel futures on the CME swung sharply higher Tuesday morning, rising roughly 20 cents in the span of about two hours after briefly trading negative the day before. The move rattled diesel consumers already dealing with depleted inventories and limited policy options, with one market watcher warning that prices could push back above $6 per gallon — and potentially well above that level.

John Kingston, who tracks energy markets for FreightWaves, said the intraday whipsaw was a red flag for anyone exposed to diesel costs. The contract was down a few cents Monday, recovered to roughly 9 cents positive about two hours before the conversation, then jumped to up 20 cents just 10 minutes before air. “We’re just running out of bullets,” Kingston said. “There are no more bullets in the chamber. The inventories have been drawn down.”

“In the last 2 hours, I’d be real worried if I was a diesel consumer. I think what’s happening today is really, really concerning.” — John Kingston

The Trump administration’s decision to allow red-dyed diesel — normally reserved for tax-exempt, non-road uses such as farming — to be used over the road drew scrutiny. Kingston said the policy faces a fundamental supply-chain problem: red-dyed diesel is segregated from standard road diesel, and major truck-stop chains such as Love’s, TA, and Pilot are unlikely to drain and reconfigure tanks for a program set to expire December 31. The federal excise tax break embedded in red-dyed diesel also cannot be waived by the executive branch, since it was established by Congress. “The supply chain is not set up to get red-dyed diesel out of agricultural supply chain down to the supply chain that includes Love’s and Pilot and TA,” Kingston said.

On the international front, Kingston noted that a proposed U.S. diesel export ban was pulled back roughly two weeks ago. In response, G7 nations and other Western economies agreed to release strategic stocks totaling around 100 million barrels of crude and products into the market. More urgently, Fatih Birol, executive director of the International Energy Agency, contacted IEA member nations just two days ago and told them to speed up strategic stock releases — specifically prioritizing diesel over gasoline, according to Kingston.

Flows through the Strait of Hormuz had briefly improved toward pre-war levels, helping push oil and diesel prices lower about a week ago. But Kingston said the latest data show those flows are deteriorating again amid renewed Iranian attacks on oil infrastructure, adding geopolitical risk back into the price picture. He said he would not be surprised if Iran de-escalates after the U.S. midterm primaries, pointing to the historical precedent of Iran releasing American hostages the day Ronald Reagan took office in 1981.

Longer-term, Kingston said the diesel crunch could accelerate electric vehicle adoption among buyers who were previously undecided. He noted that a year ago, all three major monthly oil supply-demand reports — the OPEC report, the IEA report, and the Department of Energy’s Short-Term Energy Outlook — were signaling downward pressure on oil prices partly due to EV penetration, including EV share of new vehicle sales reaching roughly 40% in markets such as Norway or China. Higher diesel and fuel prices, he said, will likely push fence-sitters toward electrification: “It’s already been a factor, and it’s probably going to be a factor again.”

  • Ultra-low sulfur diesel futures surged 20 cents in roughly two hours Tuesday morning, signaling acute tightening in the diesel market.
  • The Trump administration’s red-dyed diesel waiver faces a December 31 expiration and supply-chain barriers that limit its real-world impact on over-the-road diesel supply.
  • IEA Executive Director Fatih Birol contacted member nations two days ago urging accelerated release of strategic stocks, specifically prioritizing diesel.

This Summary is generated thanks to a transcription of the interview, for the full interview please enjoy the video above.

Mexico truck exports soar 145% as US demand accelerates

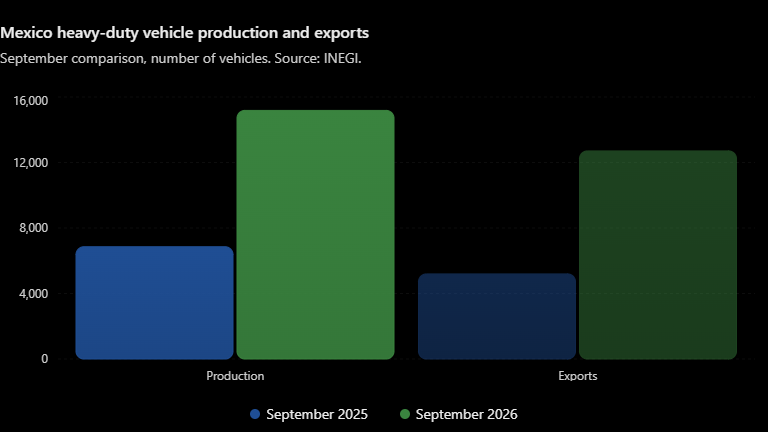
Mexican manufacturers produced 15,181 heavy-duty vehicles during September, compared with 6,857 in the same month last year.

Exports totaled 12,707 units, up 144.6% from September 2025, marking a significant acceleration in cross-border commercial vehicle shipments, according to figures from Mexico’s National Institute of Statistics and Geography (INEGI) presented by the National Association of Bus, Truck and Tractor-Trailer Producers (ANPACT).

The September rebound comes as Mexico’s domestic heavy-duty vehicle market continues to struggle with weak sales, delayed fleet replacement decisions and uncertainty surrounding U.S. trade policies.

Rogelio Arzate, executive president of ANPACT, said growing demand from U.S. customers preparing for new emissions standards has been a major factor behind the increase in production and exports.

“The reason why production and exports are growing at the levels they are is precisely because the United States, our main trading partner, is currently undergoing this technology shift,” Arzate said during an October news conference.

Arzate pointed to the transition toward U.S. Environmental Protection Agency emissions standards scheduled for 2027, which is prompting manufacturers and customers to adjust their purchasing and production plans.

“Clients are currently requesting a significant number of units as well, and that is why this production and export toward the United States is increasing,” Arzate said.

The growth highlights Mexico’s role as a major production hub for commercial trucks sold throughout North America, even as manufacturers navigate tariffs, evolving emissions requirements and the upcoming review of the United States-Mexico-Canada Agreement.

Sources: INEGI, Registro Administrativo de la Industria Automotriz de Vehículos Pesados, Oct. 9, 2026; ANPACT-AMDA October 2026 news conference transcript.

US remains Mexico’s largest heavy-duty truck export market

Mexico exported 98,394 heavy-duty vehicles during the first nine months of 2026, an increase of approximately 12% compared with the same period last year, according to ANPACT.

Of those shipments, 98,389 were freight vehicles, representing a 12.1% year-over-year increase.

The U.S. remained the industry’s dominant export destination, receiving 90,967 Mexican-built heavy-duty vehicles from January through September, up 9.6% from the comparable 2025 period.

That means the U.S. accounted for approximately 92.5% of Mexico’s heavy-duty vehicle exports during the first nine months of the year.

Canada also recorded gains, with shipments increasing 47.6% year over year through September. During September alone, Mexico exported 680 heavy-duty vehicles to Canada, more than doubling the volume recorded a year earlier.

Other markets showing year-to-date growth included Colombia, Peru, Honduras and Guatemala, while exports to Chile, El Salvador, Ecuador and Costa Rica declined.

The export gains accompanied a broader recovery in Mexican commercial vehicle manufacturing.

During the January-through-September period, Mexican factories produced 117,121 heavy-duty vehicles, an increase of 10.3% from the same period in 2025.

Freight vehicles accounted for 114,443 units of that production.

Diesel-powered vehicles continued to dominate the industry’s manufacturing and export activity. ANPACT reported no electric or natural gas-powered heavy-duty vehicles produced or exported during September.

Domestic truck sales continue to struggle

Despite stronger manufacturing and export activity, Mexico’s domestic heavy-duty vehicle market remained under pressure.

Cristina Vázquez, coordinator of economic studies at the Mexican Association of Automotive Distributors (AMDA), said retail sales totaled 2,980 heavy-duty vehicles in September, down 11.3% from the same month in 2025.

The decline marked the eighth consecutive month of year-over-year decreases in Mexico’s heavy-duty vehicle retail market.

Through the first nine months of 2026, retail sales totaled 25,289 vehicles, a 17.5% decline from the comparable period last year.

Sales of tractor-trailers were particularly weak.

Mexican dealers sold 1,153 tractor-trucks during September, down 14% year over year. Sales of other freight trucks increased slightly, rising 0.5% to 1,378 units.

Combined, the freight vehicle segment recorded 2,531 retail sales, down 6.7% from September 2025.

Passenger vehicle sales, including buses, fell 30.5% to 449 units.

Vázquez said Mexico’s commercial vehicle market has yet to recover from a surge in purchases during 2024, when fleet operators accelerated acquisitions ahead of regulatory changes.

The record sales that year effectively pulled forward demand that otherwise might have occurred in 2025 and 2026.

She also cited uncertainty surrounding U.S. trade policies and the upcoming USMCA review as factors discouraging fleet operators from making major investments.

The market’s continued weakness comes despite signs of improvement in Mexico’s broader economy, including a rebound in fixed investment.

AMDA projected annual heavy-duty vehicle retail sales of approximately 36,051 units in 2026 but cautioned that actual results could fall below that estimate if purchasing activity remains subdued.

ANPACT pushes for tariff relief, fleet renewal programs

Arzate said ANPACT is working with Mexican authorities to address U.S. tariffs on commercial vehicles and components as the North American automotive industry prepares for the USMCA review.

The association is seeking lower tariffs and wants to preserve existing regional rules of origin, which require manufacturers to meet increasing North American content thresholds.

Arzate said manufacturers have made substantial investments in their supply chains and production facilities to comply with the agreement.

He said the industry’s preferred outcome would be eliminating U.S. tariffs imposed under Section 232 of the Trade Expansion Act, although reducing those duties may be a more achievable near-term goal.

“In an ideal world, we should have zero tariffs,” Arzate said.

ANPACT is also working with Mexico’s Ministry of Finance and Ministry of Economy on programs aimed at encouraging domestic fleet replacement.

The initiatives include accelerated depreciation, financing guarantees and a proposed scrappage program designed to remove older commercial vehicles from service.

Arzate said the association is coordinating with Nacional Financiera, Mexico’s development bank, on additional financial incentives to help carriers purchase newer equipment.

September 2026: Key industry figures

MetricSept. 2025Sept. 2026Change
Production6,85715,181+121.4%
Exports5,19612,707+144.6%
Wholesale sales2,5142,965+17.9%
Retail sales3,3582,980-11.3%
Mexico heavy-duty vehicle production and exports in September comparison, number of vehicles. Source: INEGI.

Why it matters: The surge underscores Mexico’s importance to North American truck manufacturing as fleets prepare for regulatory changes and trade uncertainty.

More FreightWaves articles by Noi Mahoney:

How National Debt Affects Freight Costs and Financing

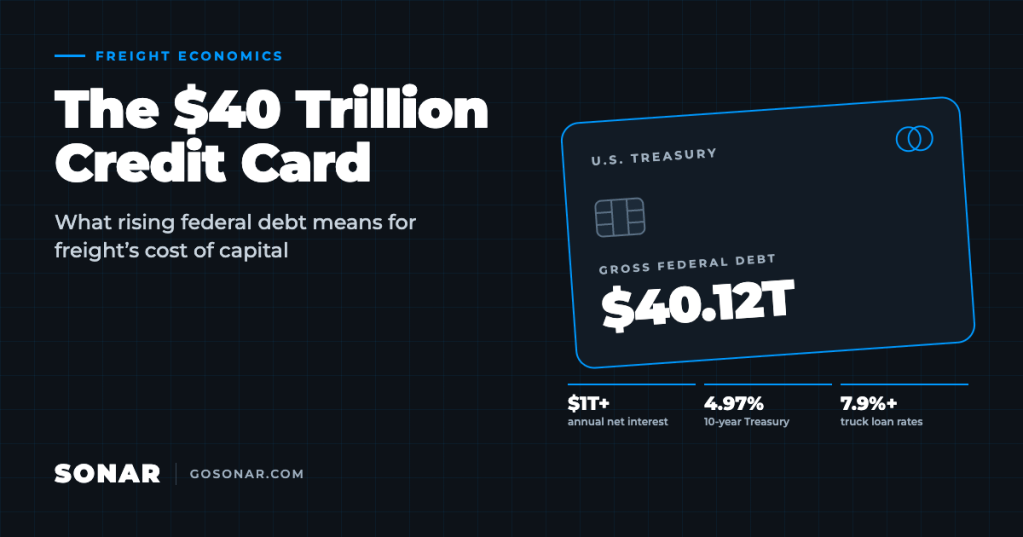
Illustration of a credit card showing $40.12 trillion in U.S. federal debt, with key interest rate stats for freight.

Key takeaways

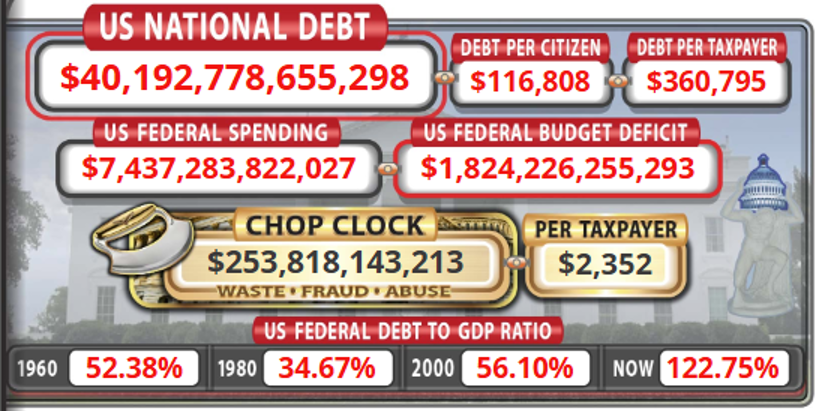
  • U.S. gross federal debt passed $40 trillion in August 2026; about $32.4 trillion of it is held by the public.
  • Net interest on the debt now runs above $1 trillion a year and eats roughly 18.5% of federal revenue, a record.
  • Heavy Treasury borrowing competes with private borrowers for capital (“crowding out”), adding upward pressure on interest rates, though the near-term rate story is still mostly inflation and the Fed.
  • Freight feels it first: truck loans start around 7.9% to 8.9%, Class 8 orders are down year over year, small carriers are under strain, and warehouse development costs more to finance.
  • Anyone planning a fleet replacement cycle or a long-term warehouse lease should model both Fed policy and the structural deficit.

On last week’s Freightonomics show, we discussed CBO rule-of-thumb numbers on how much an increase in the interest rate (as shown by the Effective Federal Funds Rate) would impact the debt. I had in my mind publicly held debt when I said it was somewhere in the neighborhood of $34T. Turns out I transposed a couple numbers and was thinking 34.2 (getting old stinks). It’s actually $32.4T, which is still not good. I looked this morning to see what the total U.S. debt total currently is. That number is worse yet.

Source: usdebtclock.org, 09/23/2026

Gross federal debt crossed $40 trillion in mid-August 2026, months earlier than most forecasters had penciled in, as the Washington Post reported at the time, and it has held in that neighborhood since, touching $40.12 trillion in Treasury’s own daily debt-to-the-penny data as of September 21. Of that total, $32.4 trillion is debt held by the public and $7.7 trillion is intragovernmental, per Congress’ Joint Economic Committee Debt Dashboard. Debt held by the public alone is now running close to 100% of GDP (Debt Clock’s 122.75% is gross federal debt, public plus intragovernmental), and the Congressional Budget Office projects that ratio to reach 120% by 2036 and 175% within thirty years, surpassing the 1946 postwar record of 106% along the way. The debt has roughly doubled in under a decade.

Before we go further, we need to talk about scale. “Trillion” looks fine on paper, but it is difficult to wrap our heads around just how big that number is. To be perfectly honest, one almost needs a metaphor to understand the metaphor, but I’m going to try my best. I don’t want to bore you with too many conversions, but we need to establish some foundations for this. Let’s assume that each dollar of federal debt is one drop of water, 1/20th of a milliliter, or 1/100th of a teaspoon. On my kid’s medicine syringe, 1 tsp = 5 ml; so that math checks out. Following our earlier assumption, that means each teaspoon is a $100 bill of debt. According to World Aquatics, a long-run Olympic-sized swimming pool is 50m x 25m x 2.5m or about 164’1” x 82’ x 8’2”. This means it holds 3,125,000 liters of water, or 825,538 gallons. That means each pool holds 62.5 billion drops. For a federal debt of $40.1T, that means almost 642 pools. Imagine trying to swim that, much less drink that much. If you drank a gallon of water a day, it would take you 2,260 years to down all that. (See what I meant about the metaphor needing a metaphor?)

For freight and logistics, the headline number is not the worrying thing by itself. It’s what a debt stock this large, growing this fast, does to the price of capital, and freight is one of the most capital-intensive, most interest-rate-sensitive sectors in the economy.

Interest on the national debt now tops $1 trillion a year

One small bit of good news is that neither we nor the federal government need to drink that much pool water, at least not all at once. Federal debt gets bought and sold, comes due and gets reissued, on a constant basis. One credit card gets paid off, another gets issued. But, the feds have to pay interest on the money they borrow, just like everyone else. This cost is called “servicing” the debt. And, since the feds both borrow debt and gain interest on balances held (just like in your savings account), the reported numbers are the net of the two.

Net interest on the debt ran $1.02 trillion for the first eleven months of FY26, up 9% from $933 billion over the same span in FY25, and annualized interest costs crossed the $1 trillion mark in August, according to the Peterson Foundation’s interest tracker. Interest is now the second-largest line in the federal budget after Social Security, ahead of defense and Medicare individually and, on a 2025 full-year basis, ahead of the entire defense budget outright, Fortune reported this month. Interest payments now consume roughly 18.5% of federal revenue, above the prior record of 18.4% set in 1991, and CBO projects that share to reach 25% by 2036, with cumulative net interest over the next decade totaling $16.2 trillion. None of that money buys roads, ports, or anything else freight moves for. It is a pure transfer to whoever holds the debt.

How federal debt raises the cost of capital

The 10-year Treasury yield sits at 4.97% as of this week, near a 19-year high, with hawkish Fed commentary on further rate hikes doing a good part of the near-term work, per Trading Economics’ yield tracker. That’s a useful caveat before reaching for the debt as the sole explanation: a meaningful share of the current move is monetary policy responding to inflation, not fiscal policy responding to the deficit. It’s also worth noting the 30-year yield, at roughly 5%, is ordinary by the standards of the last fifty years: it was around 8% in 1991 and over 10% before that, the same Fortune piece notes. Rates this high aren’t historically unprecedented, even if they’re a shock relative to the 2010s.

That said, the deficit is doing its own work on the margin. FY26’s deficit is running around $1.9 to $2 trillion, or 5.8% of GDP, a level CBO itself flags as historically unusual with unemployment below 5%, a point the Peterson Foundation has made as well. That’s the textbook crowding-out setup: the Treasury needs buyers for an ever-larger volume of new debt, and it has to compete for the same pool of savings that would otherwise fund corporate bonds, mortgages, and equipment loans. As economist Ed Yardeni told Fortune, capital flowing into corporate bonds is capital not flowing into Treasuries, and Treasury yields have had to rise to clear the market. Treasury has also doubled its buyback operation size to $4 billion per transaction, a form of direct market management that analysts have described as blurring the line between routine cash management and yield control, which is itself a signal that debt absorption is not frictionless right now.

The academic version of this is the Penn Wharton Budget Model’s capital crowd-out estimates: in a partially open economy where foreign investors finance about 40% of new issuance, each additional trillion dollars of non-productive borrowing is estimated to reduce the private capital stock by roughly 0.65% to 0.78% by mid-century and GDP by 0.23% to 0.28%. Scale that to the trillions being added annually now, and the effect compounds, though it is partly cushioned as long as foreign capital keeps showing up to buy Treasuries.

Where higher interest rates show up in freight and trucking

Equipment financing. Trucking runs on borrowed capital for its rolling stock, and commercial truck loan rates are currently starting around 7.90% to 8.90% for well-qualified borrowers, per LendingTree’s lender survey. That rate environment is a direct pass-through of the Treasury curve plus a lender’s margin. It shows up in the order books: preliminary Class 8 net orders for August 2026 came in around 13,000 to 13,200 units, down 14% to 19% year over year, the eighth straight year-over-year decline, and well below the ten-year average of roughly 23,100 units, Commercial Carrier Journal reported. FTR’s Dan Moyer points to fleets extending truck lifespans and absorbing higher maintenance costs rather than replacing equipment, with high interest rates cited as one factor among several, alongside tariff uncertainty and the 2027 EPA NOx standard. Financing cost isn’t the only story here, but it’s a real one.

Small-carrier attrition. More than twenty trucking and logistics firms filed for bankruptcy in May 2026 alone, FreightWaves reported. The primary drivers FreightWaves points to are erratic demand and elevated operating costs, fuel chief among them, plus margins that stay thin even when spot rates rise, rather than financing costs specifically. But for the segment of the industry running on leased or financed equipment, a higher cost of debt is a background pressure that compounds every other stress carriers are already under, even where it isn’t the headline cause.

Warehouse and DC development. Industrial building loan rates were around 6.58% as of June 2026, per SelectCommercial, and industrial bridge loans are running 7.5% to 9.5% this year, according to PeerSense. That raises the hurdle rate for new distribution center development at exactly the moment e-commerce and nearshoring are pushing demand for well-located industrial space. Slower new supply growth is a second-order effect worth watching for anyone modeling warehouse rents and network footprints over the next few years.

Current market backdrop. For context, SONAR’s national snapshot as of September 22 shows tender rejections (STRI) at 14.21, up about 1% week over week and up 5.6% over the past month; spot rates at $3.43 per mile, up 48.7% year over year; and contract rates at $2.66 per mile, up 15.7% year over year. Diesel, meanwhile, is at a record national average of $6.53 per gallon, but that’s mostly a geopolitical story (the Iran conflict, Russian refinery strikes, a Russian export ban, and historically low inventories), not a debt story, as Logistics Management’s coverage of the EIA data makes clear. It’s worth keeping that distinction clean: rising rates are being driven by a mix of tight capacity, fuel cost pass-through, and the financing backdrop described above, and it would be a mistake to attribute all of it to Washington’s borrowing.

SONAR Ticker: STRI.USA

The honest takeaway for carriers, shippers and brokers

The crowding-out case for freight isn’t that the debt is single-handedly setting truck loan rates or capping warehouse construction. It’s that a structurally larger, faster-growing debt load adds a persistent upward bias to the cost of capital across the economy, and freight, as one of the most financing-dependent, thin-margin sectors there is, feels that bias earlier and more acutely than most. The near-term rate story is still mostly about inflation and the Fed. The multi-decade story, with interest costs on a path to a quarter of federal revenue and debt-to-GDP heading well past the postwar record, is increasingly about the deficit itself. Anyone underwriting a fleet replacement cycle or a ten-year warehouse lease should be modeling both.

Frequently asked questions

How big is the U.S. national debt in 2026?

Gross federal debt passed $40 trillion in mid-August 2026 and stood at about $40.12 trillion on September 21, per Treasury’s Debt to the Penny data. About $32.4 trillion is debt held by the public and $7.7 trillion is intragovernmental.

How much does the federal government pay in interest on the debt?

Net interest ran $1.02 trillion in the first eleven months of FY26, up 9% from the same span in FY25, and annualized interest costs crossed $1 trillion in August. Interest now takes about 18.5% of federal revenue, and CBO projects that share to reach 25% by 2036.

What is crowding out, and how does it affect freight?

Crowding out happens when heavy government borrowing competes with private borrowers for the same pool of savings, pushing interest rates higher. Freight is one of the most capital-intensive, rate-sensitive sectors, so higher borrowing costs show up quickly in truck financing, equipment orders, carrier margins, and warehouse development.

Is the national debt the reason freight rates are rising?

Not primarily. As of September 22, SONAR data shows tender rejections (STRI) at 14.21 and spot rates up 48.7% year over year, driven by tight capacity, record diesel prices, and the financing backdrop. The debt acts as a persistent background pressure on the cost of capital rather than the direct cause of today’s rate moves.

Want to see how capacity, rates, and costs are moving in your lanes? Subscribe to SONAR for real-time freight market data.

SONAR Pricing Power Index Slips to 70 as Intermodal Contract Rates Fall

SONAR Pricing Power Index weekly header with a scale from shipper favorable to carrier favorable

The SONAR Pricing Power Index (PPI) fell to 70 this week from 71, its fourth straight weekly decline, but freight carriers still hold the upper hand in rate negotiations. Softer intermodal contract rates and ocean import bookings drove the dip, while truckload tender rejections held steady near 13.9%.

On the PPI’s 0–100 scale, 50 represents a historically balanced market. A reading of 70 means pricing power continues to favor carriers over shippers heading into the fourth quarter.

Key takeaways: SONAR PPI, week of Oct. 12, 2026

  • PPI: 70 (down from 71). Fourth consecutive weekly decline, still firmly carrier-favorable.
  • Three-month outlook: 76 (down from 79). The model gave back most of last week’s gain but still expects carrier leverage to build into mid-January.
  • Capacity is steady. The national tender rejection rate (STRI) was 13.85%, in the 83rd percentile of the past five years.
  • Intermodal contract rates fell to $1.61 a mile from $1.68, the single biggest drag on the index.
  • Spot rates are holding near July levels. The national spot rate eased to $3.52 a mile from $3.56, still in the 95th percentile.
  • Rail volume remains elevated in the 99th percentile as truck-to-rail conversion continues.

What pulled the index lower

Two metrics accounted for most of this week’s decline. Intermodal contract rates dropped to the 36th percentile from the 54th, taking roughly 0.9 points off the score on their own. Ocean import bookings slipped about 2% to the 48th percentile from the 56th, costing about 0.6 points. Small gains in van contract rates, the spot-contract spread, rejections and accepted volume clawed back about half a point.

Capacity: rejections hold in carrier territory

The national tender rejection rate was essentially flat at 13.85% versus 13.84% last week. Weekly rejections have stayed between roughly 13.3% and 14.4% since early August, well below the 17–18% peak of late June but still more than two and a half times the level of two years ago.

The full report explains why SONAR’s model expects rejections to move higher from here rather than hold at current levels.

Demand: rail stays strong, truckload volume stays soft

Rail volume eased less than 1% to 35,575 loaded containers but held in the 99th percentile. Truckload carriers continue to be more selective about the freight they accept, pushing loads onto rail on lanes of roughly 550 to 1,500 miles. Accepted truckload volume rose about 1% but remains near the bottom of its range, in the 13th percentile. Ocean import bookings softened yet are still running above last year’s levels.

Pricing: contract rates catching up to spot

Van contract rates ticked up to $2.74 a mile, moving to the 84th percentile, as carriers reprice contracts upward. The spot-contract spread narrowed to negative $0.11 from negative $0.15. It has been negative since mid-September because spot rates have pulled back from their early-July peak of $3.80 while contract rates keep rising.

What the three-month outlook signals

The three-month PPI outlook trimmed to 76 but remains well above today’s reading of 70. The model projects tender rejections reaching the 93rd percentile by mid-January, with spot rates and rail volume at the very top of their historical ranges. The full report breaks down the forecast metric by metric.

Read the full PPI report

The complete SONAR Pricing Power Index report includes charts and analysis for all eight underlying metrics, plus the full three-month forecast.

Read the full SONAR Pricing Power Index report inside SONAR Research or in FreightWaves Market Monitor.

Look for more data? Request a SONAR demo.

About the SONAR Pricing Power Index

The SONAR Pricing Power Index is a weekly composite score that measures whether carriers or shippers hold negotiating leverage in the U.S. freight market. It combines eight SONAR metrics (tender rejections, accepted volume, rail volume, ocean TEU bookings, spot rates, van contract rates, the spot/contract spread and intermodal contract rates), ranks each against its own five-year weekly history and weights them into a single score from 0 to 100. A 50 is a historically balanced market. Higher readings favor carriers; lower readings favor shippers.

Frequently asked questions

What is the SONAR Pricing Power Index (PPI)? The SONAR PPI is a weekly 0–100 score built from eight SONAR freight metrics that shows whether carriers or shippers hold pricing power. A 50 is balanced; above 50 favors carriers; below 50 favors shippers.

What is this week’s PPI reading? The SONAR PPI was 70 for the week of Oct. 12, 2026, down from 71 the prior week. It was the fourth consecutive weekly decline.

Why did the PPI decline this week? Intermodal contract rates fell to $1.61 a mile from $1.68 and ocean import bookings dropped about 2%. Together they subtracted roughly 1.5 points, partly offset by small gains elsewhere.

Do carriers or shippers have pricing power right now? Carriers. At 70, the PPI sits well above the balanced level of 50, supported by tender rejections near 13.9% and spot rates in the 95th percentile.

What is the PPI outlook for the next three months? The three-month outlook is 76, down from 79 last week. The model expects tender rejections to climb toward the 93rd percentile by mid-January.

CCT Auto Trans expands car haul coverage map in Livingston VTS deal

photo of a CCT rig

CCT Auto Trans announced Tuesday that it has acquired fellow car hauler Livingston Vehicle Transportation Services (VTS).

Financial terms of the transaction were not disclosed.

Livingston VTS operates one of Canada’s largest vehicle-hauling networks, using its own fleet of trucks and car haulers. It has seven locations nationally and partners with Canadian National (NYSE: CNI) for transcontinental moves. Its customer base spans auto manufacturers to individuals.

Livingston VTS was an operating unit of Livingston International, one of Canada’s largest customs brokers.

“Livingston VTS has a very solid customer base, dedicated, long-term staff and drivers with assets in most major cities across Canada,” said Chad Doiron, CCT Auto Trans president and CEO, in a news release. “This acquisition positions CCT as the only company in Canada delivering open, enclosed and rail vehicle transport. It provides us with an asset-based, national footprint and the ability to expand in those locations with our current customers.”

Parent company CCT Group of Companies will operate Livingston VTS under CCT Vehicle Transportation Solutions. Livingston VTS employees and drivers will transition to the new operation.

“We value the contributions our VTS associates have made and are proud of the work they have done over the years to support our customers,” said Livingston CEO Robert Smith. “This is a win for both organizations, allowing VTS operations to continue to grow under the management of a company with a long and successful history in vehicle hauling while enabling Livingston to focus on its core business.”

CCT provides finished vehicle transportation with a fleet of 90 open auto carrier units and more than 80 employees, including drivers.

The announcement follows other recent deals in the car haul space.

In August, finished vehicle transportation provider Acertus announced it acquired Fisher Shipping. The same month, Proficient Auto Logistics (NASDAQ: PAL) acquired Hansen & Adkins for $130 million. Jack Cooper closed its doors in early 2025.

Left Lane Associates represented Livingston in the transaction.

Why it matters? This acquisition highlights a clear trend toward consolidation within the car haul sector as operators look to gain scale, expand geographies and integrate service offerings.

More FreightWaves articles by Todd Maiden:

Russian diesel deal having limited impact, if any, on prices

With the weekly average retail diesel benchmark release delayed a day due to the Columbus Day holiday Monday, that lagging indicator is likely to show another decline even as most of the industry discussion these days has been decidedly bullish.

Since the Department of Energy/Energy Information Administration price was most recently published October 6, the futures price of ultra low sulfur diesel (ULSD) has been moving in its usual crazy volatility, a feature of the current market since the U.S. and Israel commenced military action against Iran at the beginning of March. 

But the overall futures market trend in the last week has been higher. ULSD settled October 6 at $4.5694/gallon. Within two days it was more than $4.88/g. It then sunk to a settlement Monday of $4.7232/g, but it wasn’t clear that the Trump diesel deal had any impact; for all of the boasting President Trump did about the transaction, it was only down 1.52 cts/g on the day. (Permitting red dye diesel to be used over the road also has hit a regulatory maze and is largely being dismissed as well).

On Tuesday at 10:45 a.m. EDT, ULSD was turning in another typical day of volatility. It was at $4.8185/g, up 9.53 cts/g, or 2.02%. But it had been as low as $4.6431/g on the day, for a low to high swing at that point of about 17 cts/g. 

Will Russia deal bring relief?

The DOE/EIA price to be released Wednesday will be the first since the Trump administration announced a deal to purchase Russian diesel, a transaction that has largely been dismissed as irrelevant to supply/demand trends (and the Tuesday upward movement at publication time suggests the broader market was dismissing it as well). The deal with Russia also has been criticized by some members of Congress and others as illegal.

While the DOE/EIA number used as the basis for most fuel surcharges is only a weekly number, and can be delayed during a holiday week, there are other price indicators about what’s happening at the pump.

The AAA daily diesel price recently completed a 17-day run where the national average fell every day. At the start of that slide on September 22, the price was $6.5276/g. When it ended Friday, AAA said the average daily diesel price was $6.2785/g. It moved up and down slightly the next four days and Tuesday was largely unchanged from Friday.

The DTS.USA average retail diesel price in SONAR Tuesday was $6.32/g. The latest DOE/EIA diesel price was $6.199/g, effective October 5.

Part of the volatility in the market the past few weeks has been the swing in reports about how much oil is getting through the Strait of Hormuz. Without the one definitive number for the market to agree on, that sort of uncertainty will lead to volatility. 

Shipments need help

But even if the number is high, as long-time analyst Paul Sankey told CNBC in an interview, what’s getting out is not transiting through the free flow of tankers that was the state of play before the war started.

“It’s supplied at enormous military cost,” Sankey said. “That’s how you’re getting the ships through, also with the shuttle tinkering. That’s another level of cost.”

He estimated those costs are probably worth about $35/b.

Under the terms of the diesel deal announced by President Trump, Russia is to immediately supply more than 300,000 metric tons of diesel to the world market. At a conversion rate of 7.45 barrels of oil per metric tonne, the formula used by S&P Global Energy in its calculations, that works out to 2.235 million barrels. 

The rest of the deal would be another 500,000 tonnes in November and 1 million tonnes soon after. At the conversion rate of 7.45 barrels per metric ton, that is 3.725 million b/d for the November quantity and double that for the supply to come after that. 

U.S. daily consumption of all non-jet fuel distillates, according to the most recent report from the EIA, is about 3.65 million b/d. For the members of the OECD, which consists of most Western economies, daily diesel consumption is estimated at about 13 million b/d.

A report from S&P Global Energy quoted Masha Kotkin, a fellow at the Center for Strategic and International Studies, as saying “the amount of diesel Russia can provide would be a drop in the bucket compared to global demand. If you are asking about US diesel prices, I don’t think it’s going to make a difference. It is not very much in the scheme of things.”

It’s the products, not the crude

The move by the Trump administration to secure additional diesel supplies ultimately goes back to the reality that even if flows out of the Strait of Hormuz are increasing, irrespective of whether they only got there through U.S. military support, consumers buy refined products, not crude.

In a separate CNBC interview, Ellen Wald of Transversal Consulting said markets have been able to avoid even higher spikes in price through a wide variety of steps, including drawdowns from strategic stocks. But that has limits.

“We have seen some incredible resilience in the market,” Wald said. “We’ve seen an ability to work around and for the market to find workarounds. But at a certain point, things are going to start to give, and we’re seeing that as prices are creeping higher and higher. Any attempts to bring them down that aren’t actual new sources of supply don’t really last.” 

(Editor’s note: the picture is AI-generated.)

Beyond the latest Russian diesel deal, and before that the agreement by G7 nations earlier this month to release additional strategic stocks, reportedly after a U.S. threat to implement a diesel export ban if they did not, there are the broader stock releases that were agreed upon by the members of the International Energy Agency in March.

IEA executive director Fatih Birol on Saturday tried to give a push to the ongoing releases and have them go faster.

“Members that have not yet fully delivered the volumes pledged under the March Collective Action look to see if they are able to accelerate the remaining releases to fulfil this prior commitment, prioritising diesel,” he said in his statement. He also noted that “some members have already released greater volumes than they initially pledged in March.”

More articles by John Kingston

FMCSA’s Elison: ‘weeks’ away from fixing Motus user experience

Wall Street analysts positive on C.H. Robinson deal; S&P more cautious

FMCSA split sleeper berth pilot program moves closer to launch