
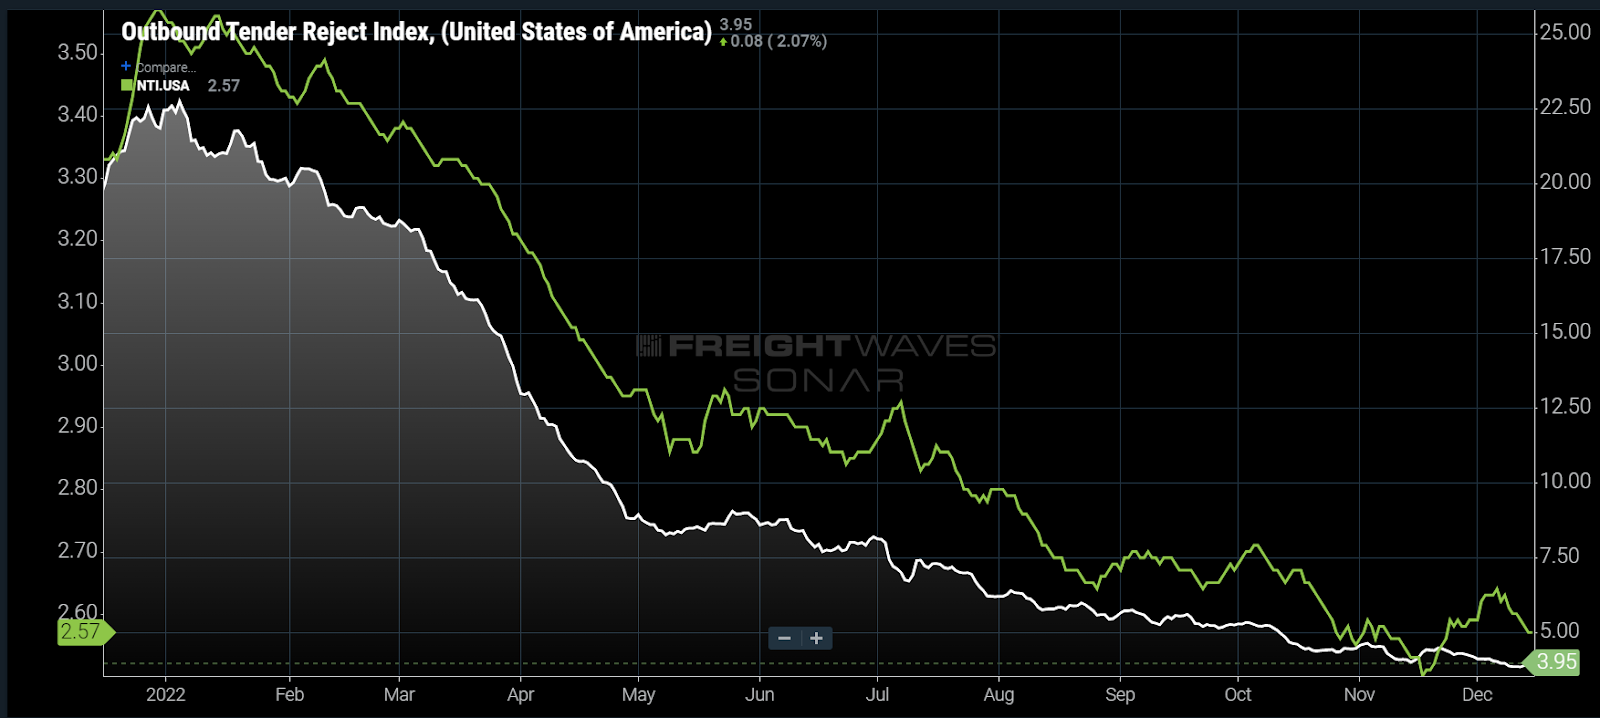
Chart of the Week: Outbound Tender Reject Index, National Truckload Index – USA SONAR: OTRI.USA, NTI.USA
Carriers are covering everything they can under contracted rate agreements, leaving the spot market a barren wasteland for freight.
The national Outbound Tender Reject Index (OTRI) barely responded to Thanksgiving this year, increasing from 3.99% to 4.46% in the week leading into the holiday before falling to its lowest value of the year of 3.83% on Dec, 12. Last year, rejection rates increased from 19.3% to 20.6% over the same period. In 2019, a pre-COVID-19 year, OTRI jumped from 5% to over 8%.
Spot rates measured by the National Truckload Index (NTI) hit an annual low on Nov. 17 before jumping 5% over the next two and a half weeks. As of Dec. 15, they had already retreated 3.4%. The lack of response from the OTRI suggested any spot rate increase would be short-lived.
The OTRI measures the average tender rejection rate of shippers requesting truckload capacity from their existing contracted carriers — basically how effective contract rates are at securing capacity. During COVID, they were about 75%-80% effective. Currently, they are around 96% effective.
Contracts in trucking are previously agreed upon rates the carrier agrees to honor if they have availability to cover the shipment — this is not dedicated service. Unlike the spot market, they are negotiated about once a year in general as opposed to an as-needed basis. Normally, These agreements make costs more predictable and capacity more available. The longer-term cycles make contract rates slower to respond to market conditions.
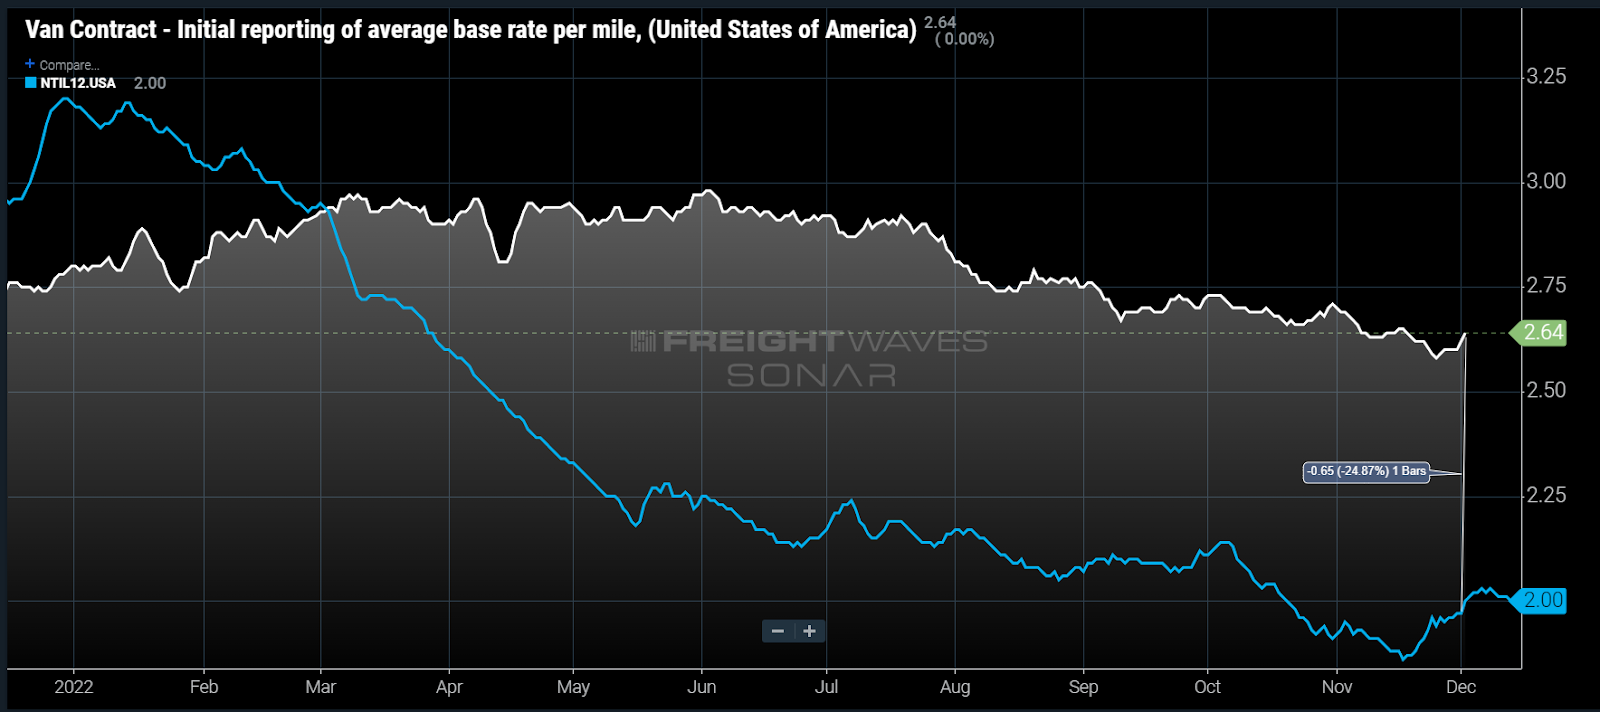
As of Dec. 1, FreightWaves spot rates excluding estimated fuel costs (NTIL12) are roughly 25% lower than contract rates for dry van capacity on average. The relationship between the contract and spot market has flipped since the early part of 2022. Shippers were desperate to get trucks to show up in January. Now carriers are desperate to find freight to move, using the spot market as a last resort for utilization as their services carry higher premiums under contracted rate agreements.
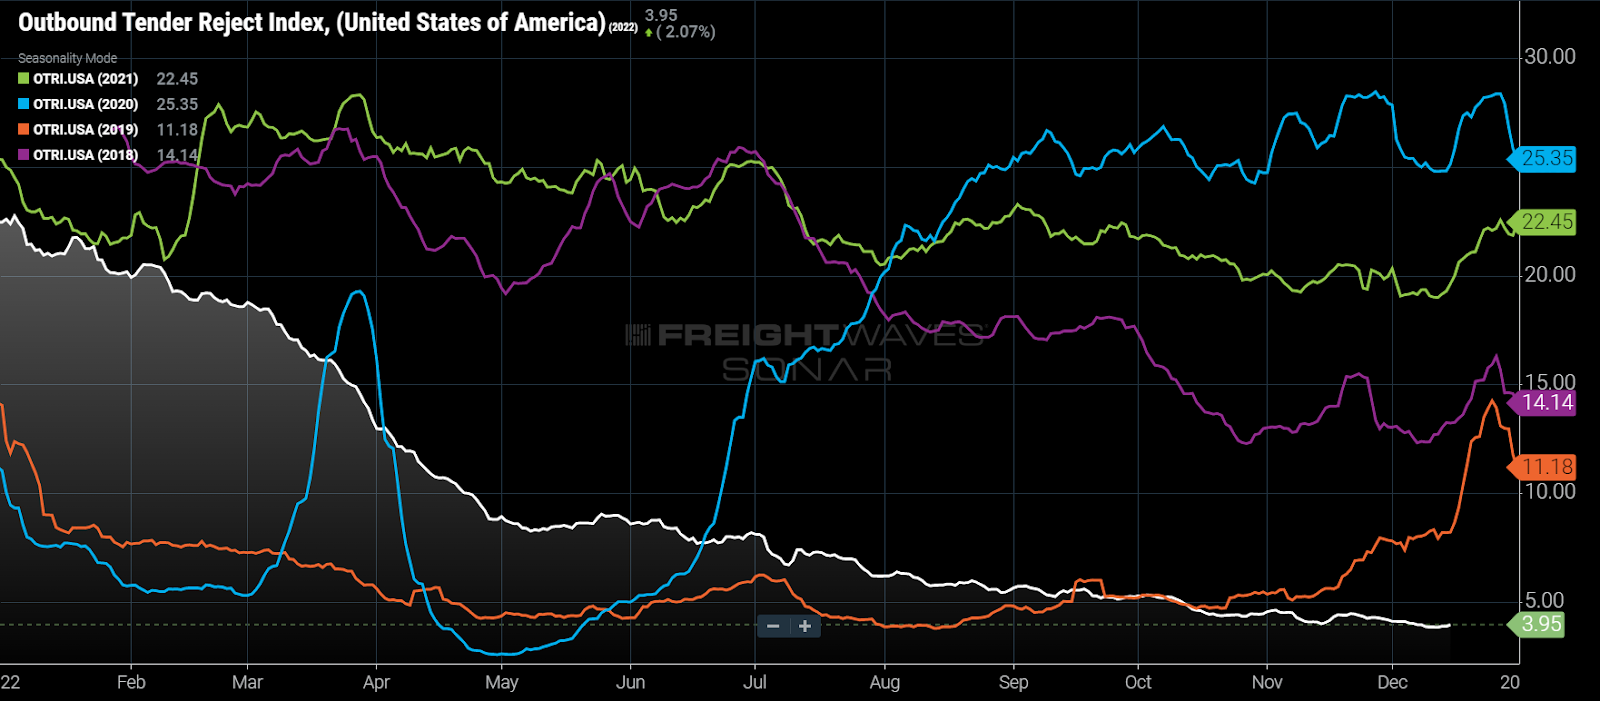
Looking at historical OTRI trends, there should be a noticeable increase in rejection rates over the next few weeks as carrier availability lessens due to vacations and driver-range boundaries are set to get them home. The lack of significant increase around Thanksgiving suggests this year may not see a strong decline in contract compliance.
Spot rates can be influenced by factors other than available capacity. Direct-to-spot loads are typically characterized by having elevated service requirements or inconsistent shipping patterns — either seasonal or low volume. Both characterize the time around the winter holidays, which is probably what pushed the NTI higher. Even with the seasonal push, spot rates remained well below contract.
Looking into the future, as contract rates inevitably fall closer to spot market levels, compliance rates will be more likely to fall and OTRI increases. For this reason, transportation managers should not expect this level of compliance to become the norm but potentially the best achievable result.
Demand side conditions look grim through the winter. The supply side of the equation is due for a historical correction in 2023 if this does not change, meaning the market will once again become exposed to destabilization from demand surges — and the cycle continues.
About the Chart of the Week
The FreightWaves Chart of the Week is a chart selection from SONAR that provides an interesting data point to describe the state of the freight markets. A chart is chosen from thousands of potential charts on SONAR to help participants visualize the freight market in real time. Each week a Market Expert will post a chart, along with commentary, live on the front page. After that, the Chart of the Week will be archived on FreightWaves.com for future reference.
SONAR aggregates data from hundreds of sources, presenting the data in charts and maps and providing commentary on what freight market experts want to know about the industry in real time.
The FreightWaves data science and product teams are releasing new datasets each week and enhancing the client experience.
To request a SONAR demo, click here.