
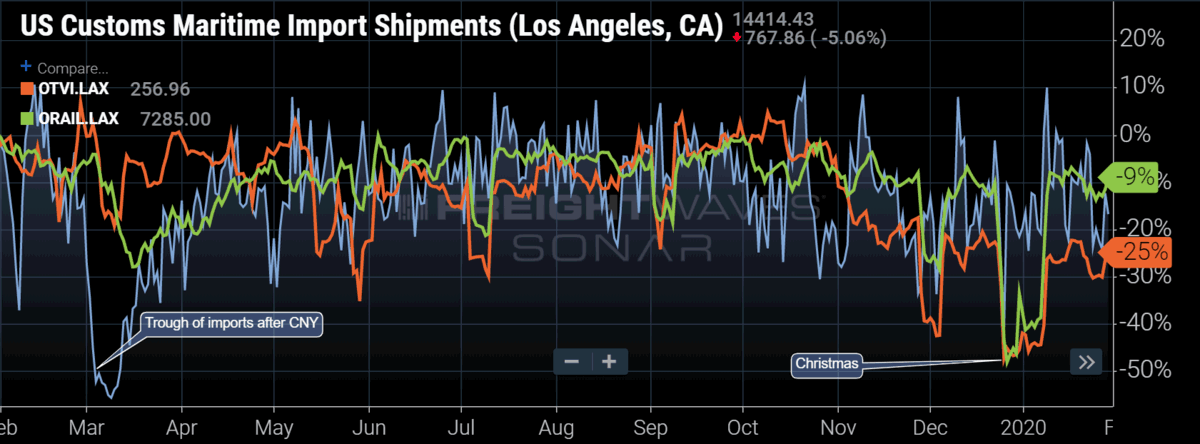
Chart of the Week: US Customs Maritime Import Shipments – Los Angeles, Outbound Tender Volume Index – Los Angeles, Outbound Rail Container Volumes – Los Angeles SONAR:CSTM.LAX, OTVI.LAX, ORAIL.LAX
The coronavirus outbreak which began in the Hubei province of China is creating disruption to the global supply chain. With over 12,000 confirmed infections and growing, the coronavirus, which is a group of viruses that can cross species from animals to humans, has caused countries to ban travel to and from China and shut down local factories and transportation in and out of the primary area of infection.
The Hubei province is roughly 500 miles (800km) from the world’s busiest container port of Shanghai and 650 miles from the Shenzhen province—a huge area for manufacturing and exports to the U.S. north of Hong Kong. Whereas both areas are a good distance from the region where the infections began, the outbreak became more serious as the largest national holiday of the year was beginning in China, Chinese New Year (CNY).
During Chinese New Year people leave the factories, take vacations and visit family. Many workers change jobs as this is a period of transition in the country. CNY is not just celebrated in China but in almost all Asian countries. The reason this is important for Americans is the fact our economy is very connected to Asia’s manufacturing and production cycles due to many companies pushing production to the Far East for lower cost of labor. Many of the goods we consume are produced overseas and are imported into the U.S.
According to FreightWaves lead economist, Anthony Smith, the U.S. economy is only about 12% manufacturing and 70% is consumption driven. Meaning the U.S. does not produce much of what it consumes. Most of the goods originate in China with other Asian countries contributing a healthy amount.
According to FreightWaves customs data, Chinese imports accounted for roughly 40% of the shipments entering the U.S. in the last month. All these goods are transported by rail or truck with most of these shipments entering the ports of L.A. and Long Beach in California. There is a sizable decrease in outbound shipments on both rail and truck about three to six weeks after CNY. Last year outbound L.A. rail volumes dropped 25% in early March and did not recover fully until April. L.A. outbound trucking volumes fell 20% but recovered more quickly by the end of the month.

East Coast imports are also impacted, but a few weeks later and with less immediate or discernible impact to rail or trucking volumes. Freight movements are not as directly tied to the ports on the East Coast due to all the other activity clouding the connection, at least in the short-term.
With 30-40% of the freight that moves in the country having entered through a port at some point — almost half of that freight comes from China — there could be a noticeable decline in freight volumes as a result of the loss of production from CNY and the coronavirus outbreak.
The virus is still not contained, which means we have not seen the peak of the impact just yet. A longer CNY trough is anticipated as the production remains offline and transportation is inhibited.
So far this year, truckload volumes have been on par with 2019 without much deviation, averaging 0.67% higher in January. Capacity has not been an issue, which has kept spot rates low and made it difficult for carriers to utilize their equipment, but even as much as a 1% decline in demand may further inhibit the beleaguered trucking sector and its potential recovery effort this year. Looking at tender rejection and spot market data late last year, there was some reason for optimism as the market appeared to have bottomed and was turning slightly upward. Developments like this may make the first half of 2020 more challenging.
About the Chart of the Week
The FreightWaves Chart of the Week is a chart selection from SONAR that provides an interesting data point to describe the state of the freight markets. A chart is chosen from thousands of potential charts on SONAR to help participants visualize the freight market in real-time. Each week a Market Expert will post a chart, along with commentary live on the front-page. After that, the Chart of the Week will be archived on FreightWaves.com for future reference.
SONAR aggregates data from hundreds of sources, presenting the data in charts and maps and providing commentary on what freight market experts want to know about the industry in real time.
The FreightWaves data science and product teams are releasing new data sets each week and enhancing the client experience.
To request a SONAR demo click here.
Freight Fraud Symposium
Double brokering. AI deepfakes. Identity theft. Freight fraud is an existential threat to the industry. Get ahead of it.
Supply Chain AI Symposium
Past the hype. Join operators, founders, and enterprise leaders figuring out how to deploy AI in supply chain.
Future of Rail Symposium
Reshoring is rewriting freight demand. Join shippers, rail executives, and government officials to shape the next decade.
Double brokering. AI deepfakes. Identity theft. Freight fraud is an existential threat to the industry. Get ahead of it.
Rock & Roll Hall of Fame • Cleveland, OH Register NowPast the hype. Join operators, founders, and enterprise leaders figuring out how to deploy AI in supply chain.
The Old Post Office • Chicago, IL Register NowReshoring is rewriting freight demand. Join shippers, rail executives, and government officials to shape the next decade.
The Signal at Chattanooga Choo Choo • Chattanooga, TN Register Now
NVOCC
here is no specific treatment for coronavirus. Treatment aims to relieve the symptoms