

Chart of the Week: Total Count of Tractors from For Hire Fleets, Outbound Tender Volume Index Monthly – USA SONAR: TCFH.USA, OTVIMTH.USA
The question of how trucking capacity is growing or declining is common in industry, but the reality is that demand fluctuations are far more important to monitor as they swing much more violently.
Since December of 2018, the total tractor count from for-hire fleets (non-private) has grown 18%, according to the FMCSA, but has never shown a monthly change of over 2%. By contrast, the Outbound Tender Volume Index (OTVI), a measure of total truckload demand, has grown 12% over the same period, but monthly fluctuations topped 20% at times.
Volatility
Even before the pandemic, the OTVI had 5-7% monthly swings in demand. Given the OTVI measures total tenders and is not a pure proxy for shipments, it is reflective of how fast demand-side conditions change in trucking.
The point is that capacity shifts are slow and stable, while demand changes much more rapidly and is very unpredictable over time. This is the consummate struggle of supply chains and transportation companies across the globe — how much infrastructure (capacity) is needed to be able to flex up but not have too much overhead when demand softens?
The process of ordering and seating a truck takes close to a year. That truck can haul roughly seven 500-mile loads per week, or 360 loads per year. This only occurs if shipping patterns are consistent and drivers are readily available, and neither are true.
So it isn’t a pure question of how much capacity is available in aggregate, but are those trucks available in the right places at the right times in general? This metric is extremely difficult to attain.
Since demand is uneven and spread unevenly throughout the country, trucks and drivers need to exceed the number of shipments available. So even if capacity grows by 1%, it just increases the chances that loads will be covered marginally.
If you ship it they will come
Demand determines supply in transportation. Trucking companies position their fleets and facilities where there is consistent need for their services. For this reason, knowing where and when demand is changing is critical as it will determine the growth or decline in transportation availability.
Over the past year, total trucking demand has declined roughly 29% at a minimum. But that rate of decline has been extremely varied across the U.S. Texas demand has shrunk roughly 20% over the past year, while California OTVI has dropped around 40%.
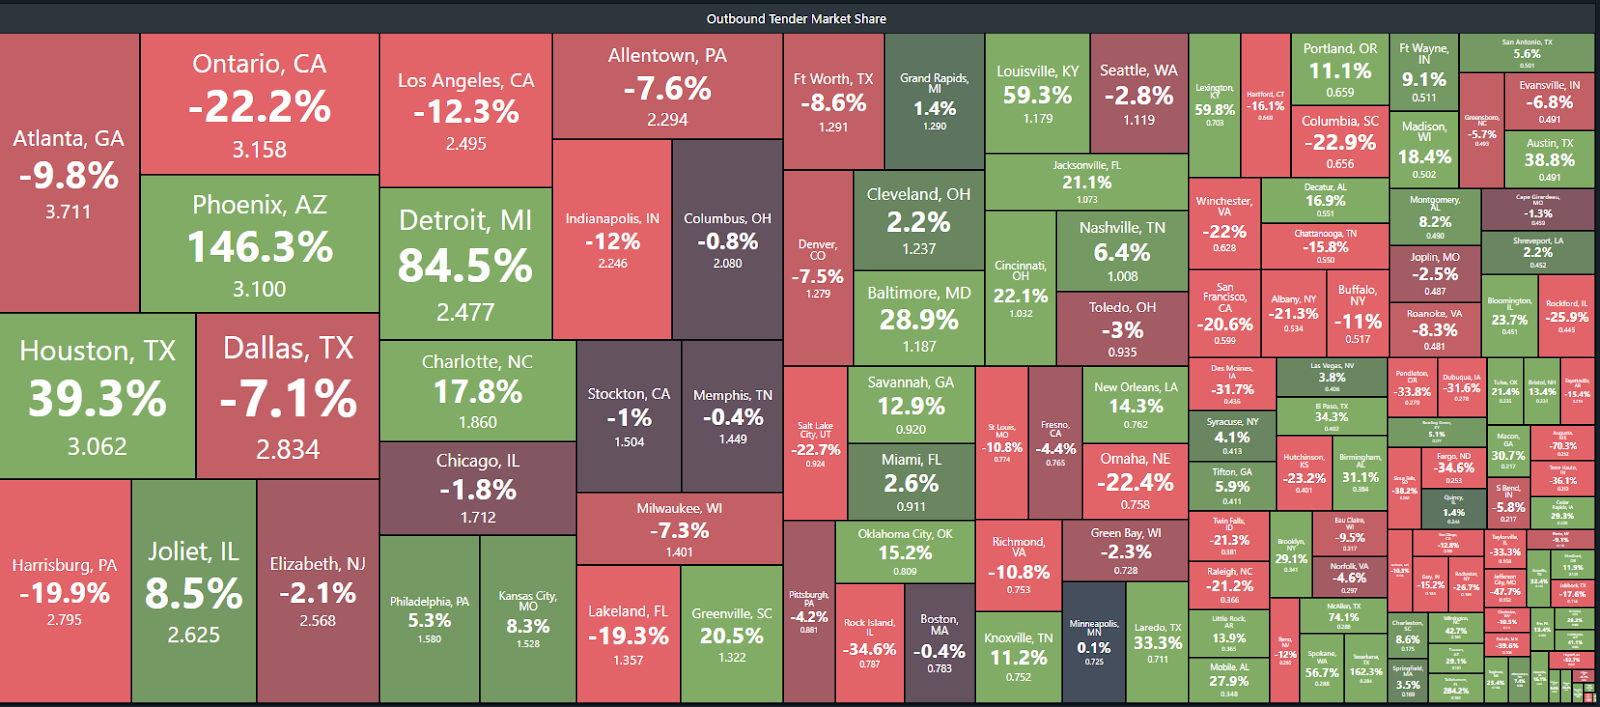
Looking at outbound tender market share values, which measure market demand in relation to each of the 135 markets in the U.S., Southern California volumes are down significantly when compared to Houston and Detroit. Houston is over 1,500 miles away from Los Angeles and it is very difficult to reposition trucks and drivers this quickly.
Changes in relative demand matter just as much if not more than aggregate demand in regard to transportation.
We already have the answer we need
Probably more important than any of the previous points is that there are already measures of the relationship between supply and demand in trucking. Tender rejection rates (OTRI) and spot rates (NTI) measure when capacity is meeting demand in the contract and spot markets, respectively.
There is little use for knowing how much capacity is available in the for-hire freight market other than being interesting. But there is exceptional value in knowing how well capacity and demand are lining up and in what direction they are trending.
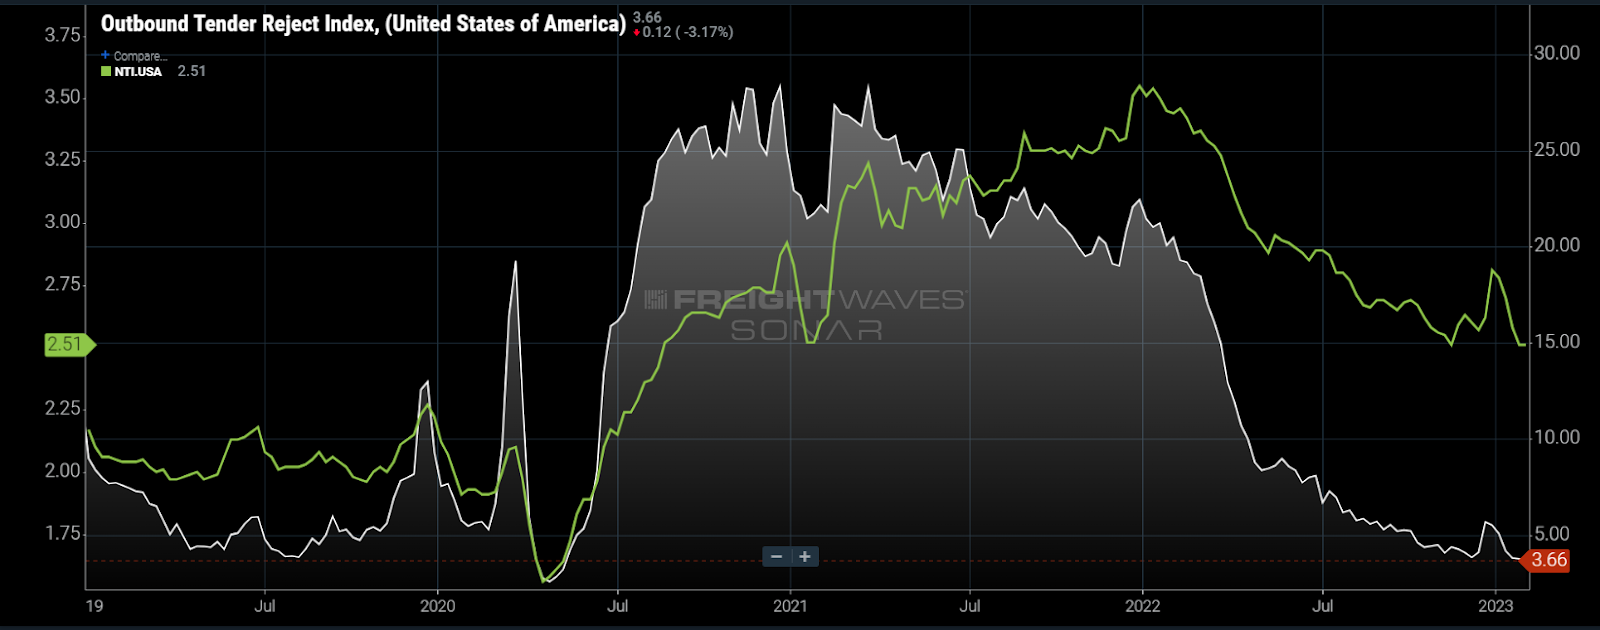
Since December 2021 tender rejection rates have fallen from over 20% to under 4%, while spot rates are down 27%.
Demand-side indicators are probably the most crucial to getting the earliest signs of market shifts, while rejection rates and spot rates answer the two most important questions that companies want answered: Can I get a truck and how much will it cost me?
About the Chart of the Week
The FreightWaves Chart of the Week is a chart selection from SONAR that provides an interesting data point to describe the state of the freight markets. A chart is chosen from thousands of potential charts on SONAR to help participants visualize the freight market in real time. Each week a Market Expert will post a chart, along with commentary, live on the front page. After that, the Chart of the Week will be archived on FreightWaves.com for future reference.
SONAR aggregates data from hundreds of sources, presenting the data in charts and maps and providing commentary on what freight market experts want to know about the industry in real time.
The FreightWaves data science and product teams are releasing new datasets each week and enhancing the client experience.
To request a SONAR demo, click here.
Supply Chain AI Symposium
Past the hype. Join operators, founders, and enterprise leaders figuring out how to deploy AI in supply chain.
F3: Future of Freight Festival
Industry-defining keynotes, rapid-fire technology demos, and industry leaders networking in experiences across Chattanooga - plus the inaugural F3 Awards Dinner featuring the FreightTech and Shipper of Choice reveals.
Past the hype. Join operators, founders, and enterprise leaders figuring out how to deploy AI in supply chain.
The Old Post • Chicago, IL Register NowIndustry-defining keynotes, rapid-fire technology demos, and industry leaders networking in experiences across Chattanooga - plus the inaugural F3 Awards Dinner featuring the FreightTech and Shipper of Choice reveals.
The Signal at Chattanooga Choo Choo • Chattanooga, TN Register Now
MrBigr504
If that driver is doing seven 500 mile loads a week, him & that truck won’t be worth nothing very soon!
🇺🇸Carlos🇺🇸
⚠️Get out of trucking before you get bankrupted by the crooked brokers with unsustainable rates and ridiculous skimming amounts⚠️