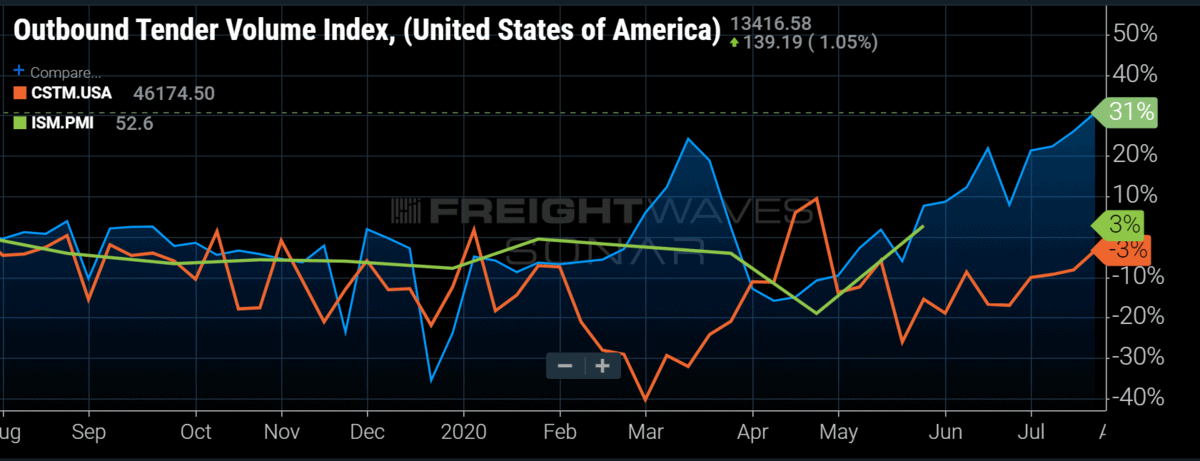
Chart of the Week: Outbound Tender Volume Index, Customs Import Shipments, Purchasing Managers Index – USA SONAR: OTVI.USA, CSTM.USA, ISM.PMI
The Outbound Tender Volume Index (OTVI) continued to expand last week, indicating shippers are requesting more capacity than ever. The index shows volume 30% higher than the previous year. With numerous carriers reporting much stronger-than-expected earnings, there is a noted level of cautious optimism about the rest of the third quarter. There are signs that we have yet to see the strongest freight market of the year.
Total imports for the U.S. have been increasing steadily since mid-June, measuring 3% lower than 2019 levels last week. In June total import shipments were 17% lower than the same period last year.
Many industrial figures, such as durable goods, have started coming in at much higher-than-expected values. The Purchasing Managers Index, which measures manufacturing activity, climbed to its highest value since April 2019 after having two of the worst months in recent history in April and May.
Considering the fact the freight market has been recovering without the aid of the industrial sector and with lower import volumes over the past few months, continued expansion of imports and industrial growth may provide another injection of freight into an already crowded environment.
Many economic and market experts, including me, found it difficult to believe that freight volumes would reach such levels this year and certainly not at the rate that they did. Some still resist the notion that this simply could not be happening because it is such a divergent pattern from what most of us have known. But there are just too many data sources that support a stronger-than-anticipated recovery.
UPS reported a more than 20% increase in volumes in the second quarter, blowing earnings estimates out of the water. While UPS is not a traditional truckload operation, the company commands an enormous amount of freight in the form of LTL and parcel shipments worldwide. Most of these parcel shipments spend some amount of time as part of a full truckload as they are consolidated and transported across the country.
J.B. Hunt’s truckload division reported an 8% increase in revenue on lower margins this past quarter, while Knight-Swift and Werner both posted improvements in profitability during what was supposed to be a disastrous quarter. Not all of these mean they experienced higher volumes, but they do suggest that the market vastly improved throughout the quarter as nearly all were revising Q2 expectations much lower in April.
A lot of the freight moving over the past three months has been driven by food and beverage and CPG. The Logistics Managers Index also suggests there was an inventory management component as inventory levels rose alongside transportation utilization, a trend that suggests consumption or demand is not the main driver for transporting goods.
Import volumes suggest there will still be plenty of freight to position in the near term, while the industrial numbers suggest there is still room to grow. The steady rate of expansion also gives a lot more strength to the sustainability of the OTVI, meaning a large drop-off is unlikely to occur soon. If the third quarter does not have another economic shutdown month like April, it could be one of the best in recent history for trucking.
About the Chart of the Week
The FreightWaves Chart of the Week is a chart selection from SONAR that provides an interesting data point to describe the state of the freight markets. A chart is chosen from thousands of potential charts on SONAR to help participants visualize the freight market in real time. Each week a Market Expert will post a chart, along with commentary, live on the front page. After that, the Chart of the Week will be archived on FreightWaves.com for future reference.
SONAR aggregates data from hundreds of sources, presenting the data in charts and maps and providing commentary on what freight market experts want to know about the industry in real time.
The FreightWaves data science and product teams are releasing new data sets each week and enhancing the client experience.
To request a SONAR demo, click here.


cookie clicker
Just tryna be in this
Tell me how you choose
Can you feel why you’re in this
Can you feel it through