
Remember back in 2021 when inflation was “transitory” and surging consumer prices were blamed on the supply chain crisis? The Fed and macro investors became intensely interested in chaos at the ports. The focus on bottlenecks spurred the Federal Reserve Bank of New York to create a new barometer called the Global Supply Chain Pressure Index (GSCPI) in January.
The implication was that if supply chain pressure reduced, inflation would ease. It hasn’t worked out that way.
The GSCPI (data here), which roughly tracked inflation trends in 2021, has fallen sharply in 2022. The monthly measure has plunged 66% from its peak, from 4.31 standard deviations above average in December to 1.47 standard deviations above average in August.
The monthly U.S. inflation measure (headline Consumer Price Index) has gone in the opposite direction over the same period, up 17%, from 7.04% (year-over-year increase) in December to 8.26% last month.

Other supply chain indicators also fall
It’s not just the GSCPI that’s unmoored from inflation.
Flexport created a measure of supply chain pressures called the Ocean Timeliness Indicator (OTI). The OTI measures the average number of days cargo takes from the time it leaves a factory in Asia to the time it exits the terminal gates in the U.S. or Europe.
The curve of the trans-Pacific eastbound OTI roughly mirrors the GSCPI. After peaking at 113 days in the week ending on Jan. 23, it fell 24% to 86 days on the week ending on Sept. 25.

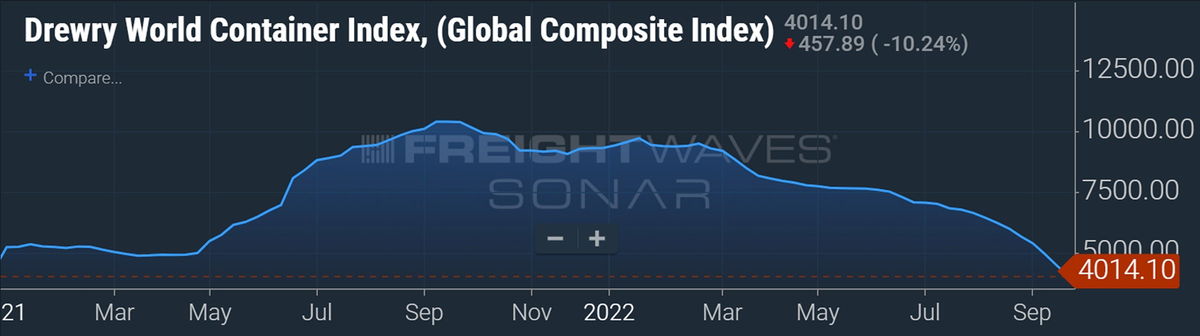
Spot freight rate indexes have likewise trended in the opposite direction from inflation in 2022. The weekly Drewry World Container Index peaked at $10,377 per forty-foot equivalent units (excluding premiums) in the week ending on Sept. 23, 2021. It has since fallen 61% to $4,014 per FEU.
Yet another example: Container bookings have followed a similar downward slope as the GSCPI, OTI and Drewry World Container Index. FreightWaves SONAR’s Container Atlas features a proprietary index of bookings based on scheduled date of departure to the U.S. This index saw a sharp decline starting in May. Between its late April high and Sunday, it has fallen 35%.

Why hasn’t supply chain easing helped inflation?
Unlike in late 2021, when retail execs on conference calls talked about import delays and marking up goods to pass along surging freight costs, they’re now talking about having too much inventory in warehouses and discounting goods to clear the excess.
If the supply chain crunch was such a major driver of inflation, why are so many indicators pointing to an easing of supply chain pressures at the same time inflation remains exceptionally high?
One theory is that the supply chain was at least something of a red herring. Another is that supply chain pressures are indeed easing, but they’re still way above pre-COVID levels. In other words, the supply chain crunch is not over yet, so the positive payoff for inflation is yet to come.
The GSCPI, while down sharply from its peak, is still almost six times higher than it was in 2017-19. Flexport’s OTI is still more than double its pre-COVID level.
The Drewry World Container Index is currently three times higher than it was at this time of year in 2019. The FreightWaves SONAR Container Atlas Ocean TEU index for US-bound cargoes is currently 35% higher than it was at this time in 2019.
Meanwhile, U.S. imports remain near all-time highs and have yet to materially fall. According to Descartes, U.S. imports in August were flat versus July and up 18% versus August 2019, pre-COVID. Customs data on FreightWaves SONAR shows that September imports were very close to September 2021 levels.
Ship-position data and queuing lists showed 109 container vessels waiting off U.S. ports as of Sunday. That’s down from a high of over 150, but still far above the pre-COVID normal in the single digits.
Signs of hope but supply chain crunch not over
Flexport addressed the status of the supply chain squeeze in a presentation on Thursday. The consensus: Yes, it’s winding down, but it’s too soon to declare victory.
Flexport Chief Economist Phil Levy highlighted the role of the supply chain crunch in public policy. “It has fed into a lot of macroeconomic policy and into what the Fed has been doing. To the extent one thought supply chain problems would get fixed, that was part of the rationale for calling [inflation] transitory.”
On a positive note, Levy pointed to the drop in the cargo transit times measured by the OTI. “If you look at the [historical] pattern, it gets better around late spring and early summer and then in late summer, it starts to get worse. We saw that in 2020 and in 2021. We waited to see that in 2022 and it didn’t happen. To me, that’s notable. I would put that down as a sign of hope.”
On the other hand, Levy noted that U.S. consumer spending on durable goods continues to be surprisingly strong. “Durable consumption is down from the peak in the spring, but we’re still consuming 20% more durables [than pre-pandemic]. And nondurables are not even that far off the peak. So, we have not seen a big consumption drop-off. There’s still a lot of demand out there.”
Click for more articles by Greg Miller
Related articles:
- Shipping giant Maersk: ‘Significantly less demand’ but ‘no hard landing’
- West Coast ports sink to lowest share of US imports since early 1980s
- Imports to Los Angeles, America’s largest port, plunged 17% in August
- US imports keep chugging along, still up double digits vs. pre-COVID
- New index measures supply chain pressure — and it’s really high
Freight Fraud Symposium
Double brokering. AI deepfakes. Identity theft. Freight fraud is an existential threat to the industry. Get ahead of it.
Supply Chain AI Symposium
Past the hype. Join operators, founders, and enterprise leaders figuring out how to deploy AI in supply chain.
Future of Rail Symposium
Reshoring is rewriting freight demand. Join shippers, rail executives, and government officials to shape the next decade.
Double brokering. AI deepfakes. Identity theft. Freight fraud is an existential threat to the industry. Get ahead of it.
Rock & Roll Hall of Fame • Cleveland, OH Register NowPast the hype. Join operators, founders, and enterprise leaders figuring out how to deploy AI in supply chain.
The Old Post Office • Chicago, IL Register NowReshoring is rewriting freight demand. Join shippers, rail executives, and government officials to shape the next decade.
The Signal at Chattanooga Choo Choo • Chattanooga, TN Register Now
Jeff Chan
Or, it could be related to printing trillions of dollars.
Super simplified analogy –
If you have ten chickens in the market, and ten dollars in the market, a chicken will tend to cost 1 dollar. If you print 10 more dollars and distribute them in the same market, chickens prices will rise to two dollars.
Though this is a simplistic analogy, sovereign banks around the world have been pumping of trillions of dollars into world economies. The increase in production of goods did not increase when this happened. In fact, the GDPs of the countries controlling the sovereign banks have declined substantially. More dollars chasing fewer goods results in inflation. No way around it.
Tim Thoma
Spot on. Excellent and simple analogy.
John Reagan
Our government has been printing money for as long as I can remember.. Under Trump, we had the Covid Relief program, PPP loan program (I can’t find anyone that actually had to repay any of it..) and of course, his massive trickle-down Tax Cuts…
I keep coming back to ‘corporations are gouging us’… Taking just Big Oil, which is a large part of inflation, and which has seen 200-300% profits while actually producing less product, or pumping less oil, it’s apparent that they’re perfectly OK with that.. Who wouldn’t be? Imagine being paid 2 to 3 times more for doing 1/2 the work you used to do. It’s a no-brainer.. And other critical sectors of our economy are picking up on it as well.. Like food.
Robert Cooper
Like food? How so?
And before you beat the “Hate Trump” drum too hard, remember that Democrats voted for that, too. Nobody, regardless of political affiliation, has clean hands in the overspending by government at any level. If you’re in government as an elected official or a faceless bureaucrat, you’re to blame.
Robert Cooper
Supply chain is only cog in the wheel driving inflation. The major factor is simply the supply of petroleum vs demand. And the crunch in the supply isn’t the amount of drilling or how much we’re pumping but the lack of refining capacity.
When the Philadelphia refinery fire happened a few years ago, that refinery was never rebuilt. It had a capacity of about 800,000 barrels per day. COVID hit and demand plummeted so the immediate impact of that single refinery being lost wasn’t immediately felt. Now demand is up and reports consistently show the Northeast is under supplied by roughly…..you got it….800,000 barrels per day. Lower supply, higher demand equals higher prices. In transportation, heating and power generation, it impacts every aspect of the economy and our daily lives.
So, until either demand for petroleum is brought down or the supply of finished products is increased, we’re going to continue to see higher inflation.
John Reagan
Yup! That is a large part of the issue.. And you have to ask if Oil Companies are happy with higher profits for doing less work..