
After “blanking” (canceling) around 20% of Asia-to-U.S. capacity this month and next, it now appears almost certain that carriers will cut fewer sailings in July.
Ocean carriers had previously blanked about 10% of July capacity and there have been no additional trans-Pacific reductions for that month over recent weeks.
On the contrary, a number of previously canceled sailings have been “unblanked.” THE Alliance (Hapag-Lloyd, ONE, Yang Ming) has reinstated four China-Los Angeles voyages, for arrivals on May 25, June 10, June 20 and June 30, and the Ocean Alliance (CMA CGM, COSCO, Evergreen, OOCL) has reinstated two China-U.S. sailings departing in June.
“We appear to have reached the bottom of the demand downturn in container shipping,” said Lars Jensen, CEO of SeaIntelligence Consulting.
Jensen pointed out that the service reinstatements show that carriers “would rather proactively cancel too much capacity and then later reinsert in case there is more demand.”
If carriers had planned to cancel services in July to the same degree as in May and June, they would probably have made more announcements by now — particularly if they’re strategically opting to over-cancel and reinsert.
Not only have they not done so, but new blank-sailing data provided to FreightWaves by Copenhagen-based eeSea shows that carriers have actually slightly decreased July cancellations over the past 10 days.
Fewer cancellations mean container lines have received enough bookings for their ships to keep slot utilization at acceptable levels.
This is a positive leading indicator for U.S. import demand and the economy in general — with two important caveats. First, upward momentum could quickly reverse due to a resurgence of coronavirus cases or fallout from unemployment, debt and/or business failures.
Second, despite the recent greenshoots, the number of unblankings is negligible compared to the number of blankings, U.S. import volumes will remain very depressed in May and June, and this drop in imports — the result of order pullbacks starting in late March due to the virus lockdown — will almost certainly translate into emptier store shelves during the reopening period.
In the latest edition of Sea-Intelligence’s Sunday Spotlight, Murphy put the recent sailing reinstatements into context.
“This is purely a very small change to the overall development in blank sailings. It cannot be seen as a rebound in demand, nor can it be construed as ‘strong’ demand,” Murphy maintained. “It can only be seen as another indication that the carriers’ approach is to blank sailings aggressively to ensure decent utilization on the vessels that do indeed sail, and in the process avoid rate declines.”
Blank sailing data
Container-schedule mapper eeSea provided data on weekly sailing cancellations, measured in terms of U.S. arrival dates and updated as of Friday. “We’re definitely seeing a slowdown in announcements in terms of trade-lane capacity and blank sailings,” said Simon Sundboell, founder and CEO of eeSea.
According to eeSea data, the number of canceled Asia-U.S. sailings trails off in July.

The percentage of reduced sailings declines from 18% for voyages arriving in the U.S. during the week beginning June 29 to just 9% during the week starting July 13 and only 2% during the week starting July 20.

Looking at the data in terms of ship capacity measured in twenty-foot equivalent units (TEUs), canceled sailings will reduce trans-Pacific capacity by 17% for U.S. arrivals during the week starting June 22, but by only 5% in the week starting July 13.

What’s encouraging about the eeSea blank-sailing data for July is that the capacity cuts have slightly declined over time. When eeSea gave FreightWaves the same dataset on May 12, there were three more July sailings blanked than on Friday.
Managing rates
Carriers are not just canceling sailings to save on fuel; they’re also doing so to prop up freight rates.
Data on the spot prices to move forty-foot equivalent unit (FEU) containers on various routes are tracked by the Freightos Baltic Index. Rates on the Asia-to-West Coast route (SONAR: FBXD.CNAW) are up 28% since early March, and are also at least 28% above levels seen in each of the past two years.

Rates on the Asia-to-East Coast route (SONAR: FBXD.CNAE) are flat since early March, down slightly from last year’s levels but 17% above rates at this time two years ago

Sundboell told FreightWaves, “There’s a lot of talk about how carriers are managing this. They’re handling it well, I’d say — particularly in view of their track record in the past five to 10 years, when freight rates have eroded quickly even at smaller signs of low utilization factors.
“Now that things are starting to open back up, it’ll be interesting to see how well carriers manage not just the shutdown but also the reopening,” he said, implying the possibility that carriers might become more competitive on rates as volumes rebound. “It’s way too early to claim that carriers have gotten the upper hand in the perpetual supply/demand-balance game,” he cautioned.

Near-term pain for U.S.
Because of the time lag between cutbacks in Asian orders and actual throughput at U.S. ports, America hasn’t felt the brunt of the import plunge until this month.
“The effects are only starting to be felt now,” said Sundboell. “Ports on the receiving end must be starting to feel the activity drop.”
Import volume trends can be clearly seen in U.S. customs filing data, which FreightWaves’ SONAR platform tracks daily on a seven-day, moving-average basis.
Customs-filing data is a telling market signal despite the fact that filing frequency diverges from cargo volume (each filing can relate to any volume), the timing of customs declarations in relation to port arrivals differs between cargoes, and the filings also cover noncontainerized goods.
Through May 17, the number of filings countrywide (SONAR: CSTM.USA) was down 15% year-on-year and 32% since the latest peak on April 26 (which resulted from catch-up cargoes finally arriving after the restart of exports from China). Given the high level of blank sailings through June, the customs filings could fall considerably more in the weeks ahead.

U.S. imports continue to track closely with customs filings for cargoes from China (SONAR: CSTM.CHNUSA). The data shows that the nationwide decline in early March, the rise in April and the fall this month have all been overwhelmingly driven by imports from China.

West Coast versus East Coast
The trend in customs filings at the Port of Los Angeles (SONAR: ICSTM.USLAX) was much worse than the national average in February after the shutdown in Wuhan, China. The port did better than average in late March and early April but has fallen below the national average this month and was down 29% year-on-year as of May 17.

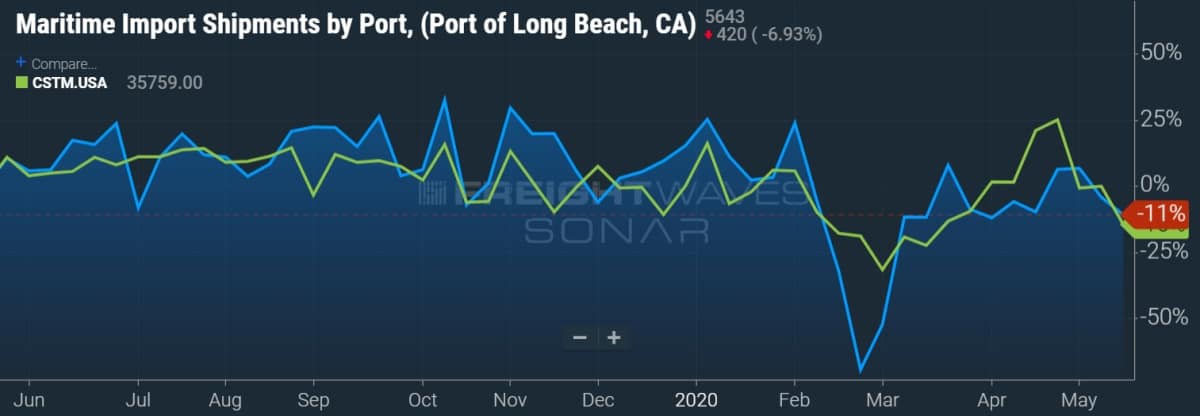
Neighboring Long Beach (SONAR: ICSTM.USLGB) underperformed the average in April but was doing slightly better than the national average this month. Long Beach fared even worse than Los Angeles in late February, according to customs data.
Imports on the West Coast are particularly important to intermodal rail. Customs filings in the Port of Los Angeles are highly correlated to the volume of outbound loaded 40-foot containers on rail lines from Los Angeles to Chicago (SONAR: ORAIL40L.LAXCHI) and from Los Angeles to Dallas (SONAR: ORAIL40L.LAXDAL).

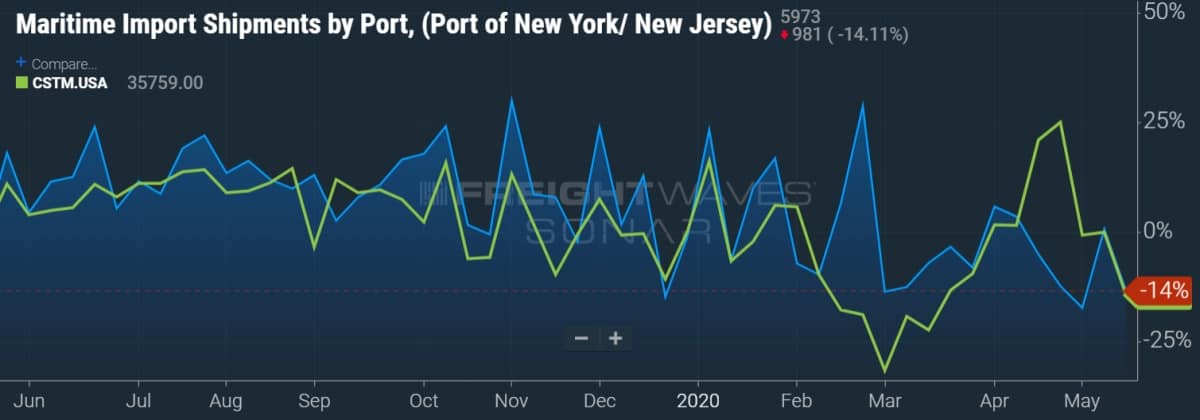
Meanwhile, on the East Coast, the customs-filings pattern is different, which makes sense given that the sailing time from China is much longer and East Coast ports have more diversified sourcing. In the Port of New York/New Jersey (SONAR: ICSTM.USNYC), shipments did not fall as quickly as on the West Coast and were much higher in February. As of mid-May, filing frequency was in line with the national average.
In Savannah, Georgia (SONAR: ICSTM.USSAV), customs filings have fallen well below the national average and were down 25% year-on-year as of May 17.

Customs filings by cargo category
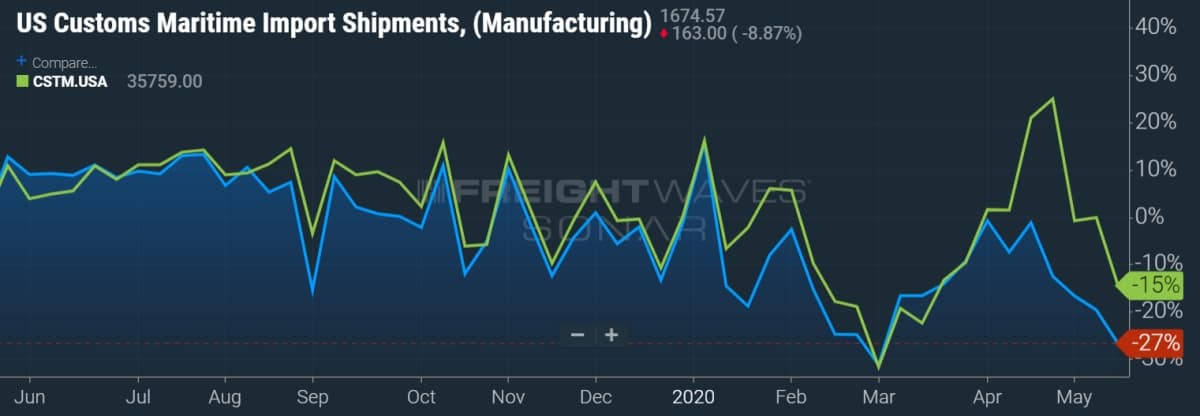
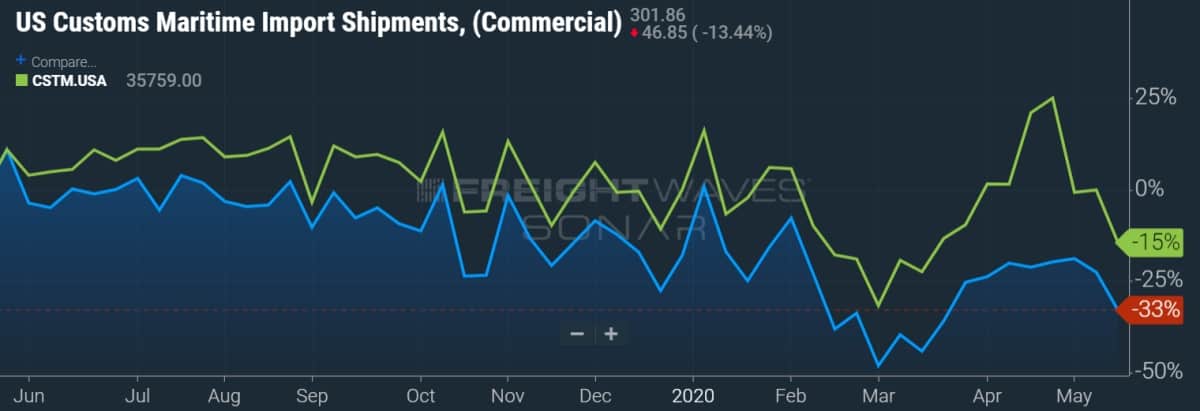
Coronavirus fallout is widespread across all categories of containerized imports, underscoring the potential for shortages during at least the early phase of state reopenings.
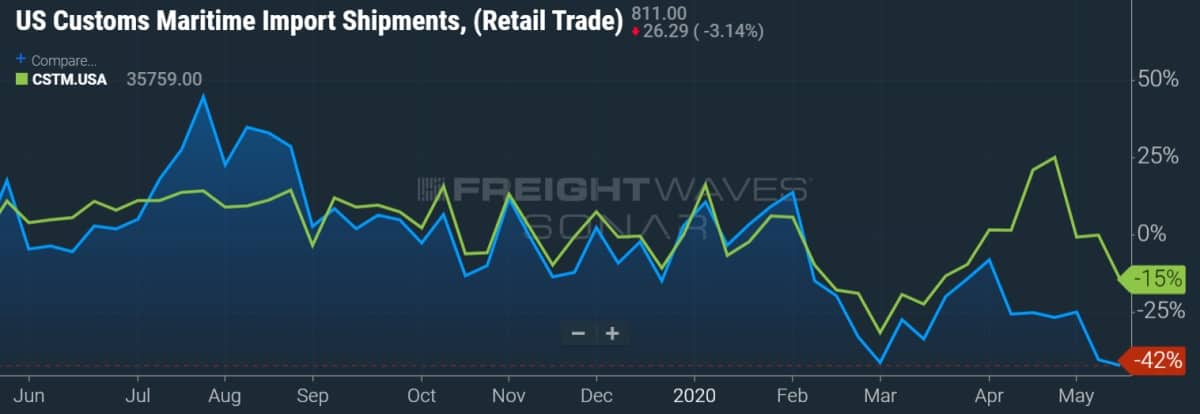
The number of customs filings for cargo declared as computers and electronics (SONAR: CSTM.COMP) was down 13% year-on-year as of May 17, with manufacturing goods (SONAR: CSTM.MFTG) down 27%, nondurable goods (CSTM.NDG) 28%, commercial goods (SONAR: CSTM.COMM) 33%, durable goods (SONAR: CSTM.DG) 35%, and retail (SONAR: CSTM.RETL) down an alarmingly high 42%. Click for more FreightWaves/American Shipper articles by Greg Miller


Freight Fraud Symposium
Double brokering. AI deepfakes. Identity theft. Freight fraud is an existential threat to the industry. Get ahead of it.
Supply Chain AI Symposium
Past the hype. Join operators, founders, and enterprise leaders figuring out how to deploy AI in supply chain.
Future of Rail Symposium
Reshoring is rewriting freight demand. Join shippers, rail executives, and government officials to shape the next decade.
Double brokering. AI deepfakes. Identity theft. Freight fraud is an existential threat to the industry. Get ahead of it.
Rock & Roll Hall of Fame • Cleveland, OH Register NowPast the hype. Join operators, founders, and enterprise leaders figuring out how to deploy AI in supply chain.
The Old Post Office • Chicago, IL Register NowReshoring is rewriting freight demand. Join shippers, rail executives, and government officials to shape the next decade.
The Signal at Chattanooga Choo Choo • Chattanooga, TN Register Now