
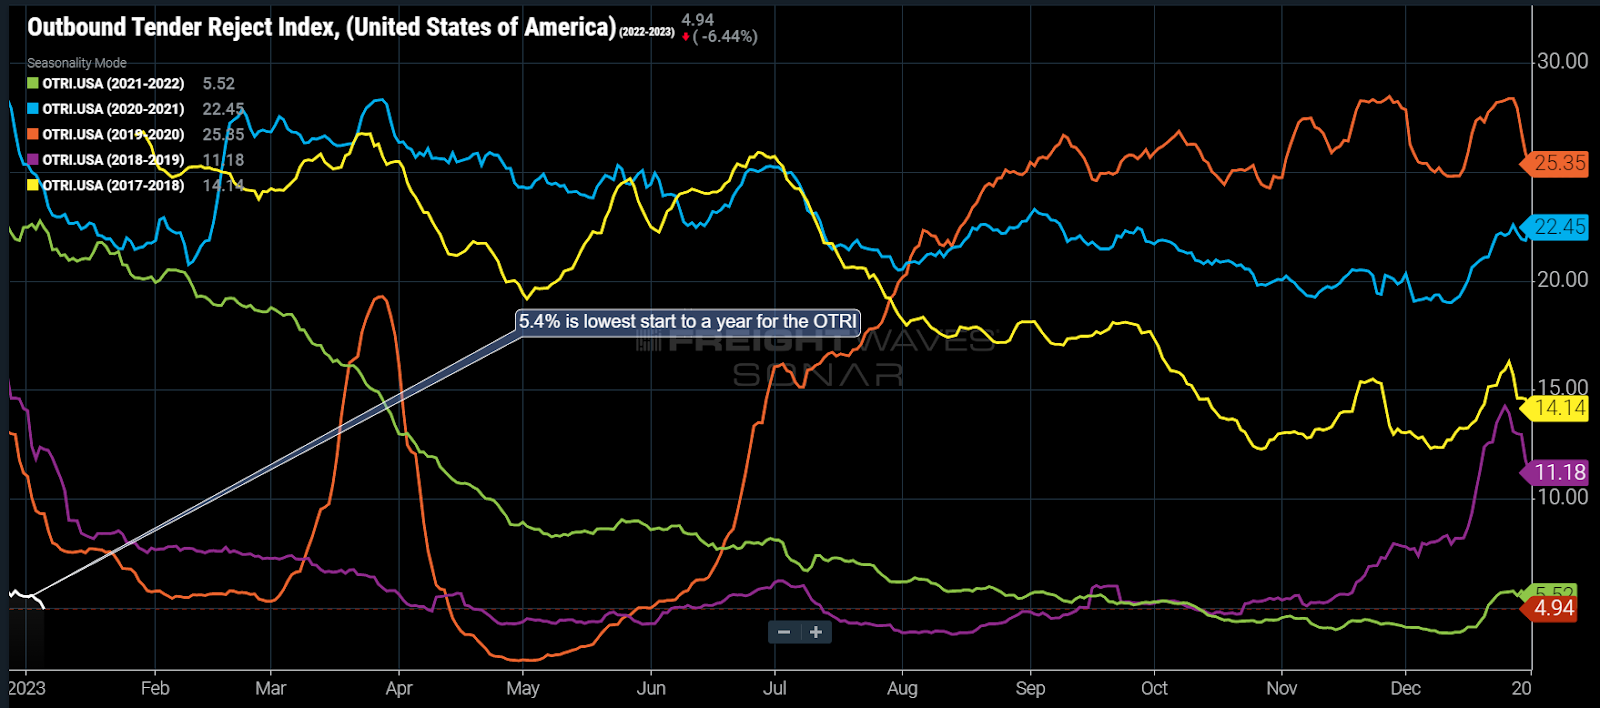
Chart of the Week: Outbound Tender Reject Index, National Truckload Index – USA SONAR: OTRI.USA Seasonality View
The national Outbound Tender Rejection Index (OTRI) failed to rise above 6% during the week of Christmas for the first time in its five-year history. With little to no disruption to carrier networks, the spot market will become a wasteland of discount freight in what is typically the slowest time of the year for domestic trucking. And while shippers may breathe a sigh of relief with transportation sourcing, the implications are not all that rosy.
The OTRI measures the percentage of loads rejected by carriers tendered by shippers with existing rate agreements or contracts in place. Most shippers look at the inverse of this figure in the form of a compliance rate — for example, a 5% OTRI is a 95% carrier contract compliance rate.
Higher OTRI values (lower compliance rates) indicate a higher probability of loads falling into the transactional spot market and capacity becomes tighter. Every holiday season over the past five years, rejection rates have risen above 14%. The softest year before this one was 2019, when the OTRI topped 14.3% on Christmas Eve.
Rapid demand erosion resulting from overstuffed inventories and eroding consumption coming out of an overstimulated goods economy are the main factors driving the weakening transportation markets. Those conditions are forecast to persist through the first half of 2023 at a minimum.
Relatively low OTRI figures are good for companies that have struggled with supply chain issues over the past few years. Values below 6% are indicative of a loose sourcing environment where it is fairly easy to secure truckload capacity. Christmas and New Year’s are typically characterized as being the tightest holiday periods due to a lack of capacity availability and retail demand.

Spot rates did increase during the holiday season as they typically do but were nowhere close to the annual highs normally seen in this period. The National Truckload Index (NTI) measures spot rates for dry van loads moving more than 250 miles from FreightWaves TRAC contributors. The NTI fell 30% from January to mid-November but only recovered just over 13% to finish the year 20% lower than where it started.
These rates include fuel, which finished the year 30% higher than where it began on the retail market. Accounting for the rise in fuel costs, spot rates actually finished the year 30% lower than where they started. Either way, the freight market deteriorated significantly in 2022.
So while shippers can take a break from capacity sourcing problems, a more concerning problem is the rapid slowdown in the goods economy that is providing this relief.
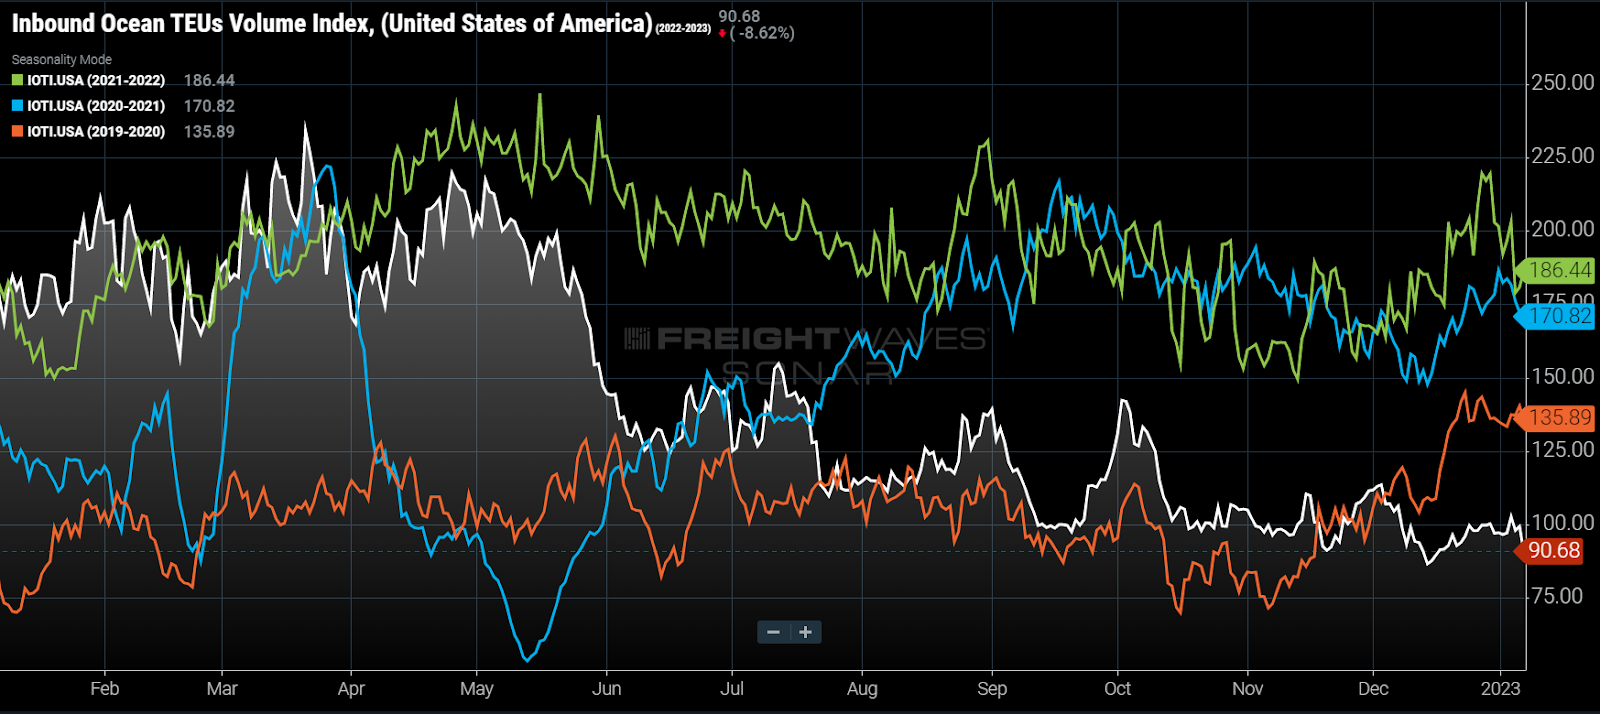
Looking into the near future, it appears most shippers are not expecting demand to recover. The Inbound Ocean TEUs Index (IOTI) measures booking of twenty-foot equivalent containers destined for the U.S. based on departure date from ports of origin around the world. Most of the containers originate in Asia and have transit times between 14-25 days before they hit the American ports.
The IOTI, like the OTRI, sits at a multiyear low — ~30% lower than early 2020 and ~50% lower than last year — during a period where activity should be ramping up leading into the Chinese New Year. While there is still some noise around comparing the current period to previous ones, the implication is there is no expectation for significant change in demand for the next quarter.
About the Chart of the Week
The FreightWaves Chart of the Week is a chart selection from SONAR that provides an interesting data point to describe the state of the freight markets. A chart is chosen from thousands of potential charts on SONAR to help participants visualize the freight market in real time. Each week a Market Expert will post a chart, along with commentary, live on the front page. After that, the Chart of the Week will be archived on FreightWaves.com for future reference.
SONAR aggregates data from hundreds of sources, presenting the data in charts and maps and providing commentary on what freight market experts want to know about the industry in real time.
The FreightWaves data science and product teams are releasing new datasets each week and enhancing the client experience.
To request a SONAR demo, click here.
Supply Chain AI Symposium
Past the hype. Join operators, founders, and enterprise leaders figuring out how to deploy AI in supply chain.
F3: Future of Freight Festival
Industry-defining keynotes, rapid-fire technology demos, and industry leaders networking in experiences across Chattanooga - plus the inaugural F3 Awards Dinner featuring the FreightTech and Shipper of Choice reveals.
Past the hype. Join operators, founders, and enterprise leaders figuring out how to deploy AI in supply chain.
The Old Post • Chicago, IL Register NowIndustry-defining keynotes, rapid-fire technology demos, and industry leaders networking in experiences across Chattanooga - plus the inaugural F3 Awards Dinner featuring the FreightTech and Shipper of Choice reveals.
The Signal at Chattanooga Choo Choo • Chattanooga, TN Register Now