


Citing strong spot market fundamentals and low retail inventories, UBS (NYSE: UBS) freight transportation analyst Tom Wadewitz raised his forecasts for truckload (TL) carriers for the back half of the year.
“Truckload spot market data have shown a better-than-normal seasonal pattern with continuing strength in spot loads in July and August,” stated Wadewitz in a Friday note to clients. The analyst pointed to a low retail inventory-to-sales ratio as well as recent reports of declining inventories from big-box retailers as reasons to raise estimates. He also said the improved demand trends have sparked a 30% increase in spot rates recently.
Earnings per share (EPS) estimates for TL carriers Knight-Swift Transportation Holdings (NYSE: KNX) and Werner Enterprises (NASDAQ: WERN) were raised 16%, with estimates for Schneider National (NYSE: SNDR) and Heartland Express (NASDAQ: HTLD) increasing 6% to 7%. The tightness in the TL markets is expected to lead to improved revenue and margin performance for the group.
“The combination of strong freight volumes and rising pricing translate to stronger 2H20 EPS for the truckload names,” Wadewitz said. “We expect a strong peak season, which should support a boost to trucker revenue from project freight, mini-bids and strong spot rates.”
Census Bureau data shows the seasonally adjusted retailers’ inventory-to-sales ratio declined to a new low at 1.23x in June. This was down from 1.35x in May and 1.68x in April, when COVID-related shutdowns halted large portions of the retail economy.
“We note that inventory replenishment is a key driver of truckload and intermodal demand and low inventories point to strength in demand in 2H20 and likely into 2021,” Wadewitz continued.
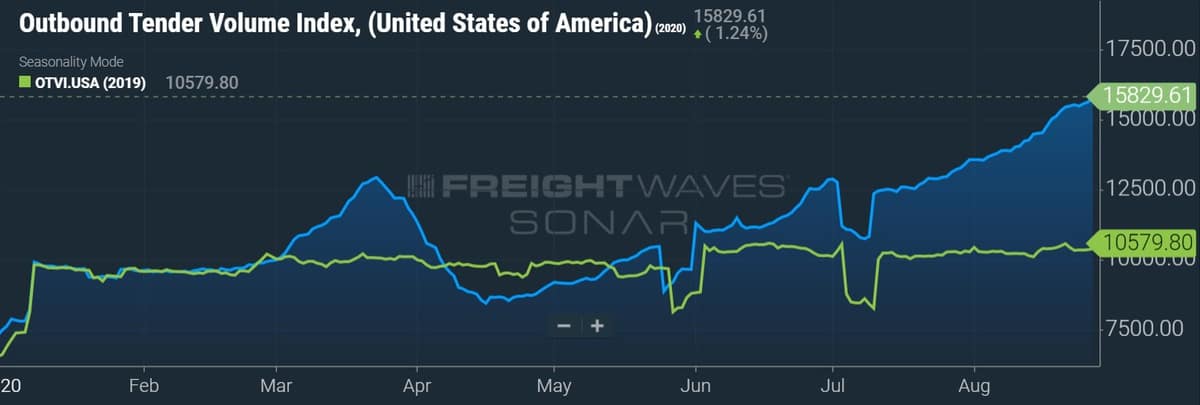
The race to restock has been evident in FreightWaves’ Outbound Tender Volume Index (SONAR: OTVI.USA), as recent volumes are up nearly 50% compared to 2019. The index has maintained the positive year-over-year inflection since mid-May as various components of the economy, namely manufacturing, have come back online.
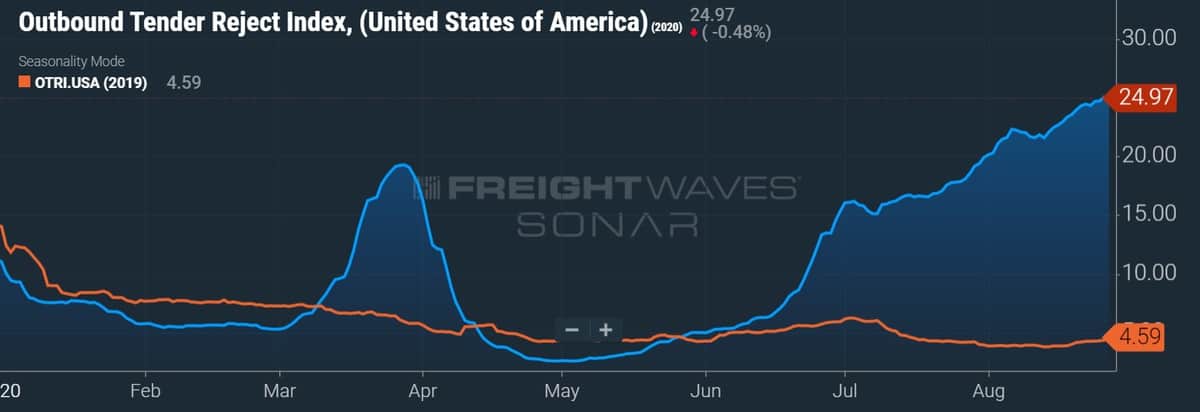
Capacity is constrained as well. Tractor purchasing has remained below replacement levels for a sustained period and some carriers have been forced to the exits as cost inflation, rising insurance premiums and increased regulation have taken a toll on the supply side. The Outbound Tender Reject Index (SONAR: OTRI.USA), a measure of the number of loads tendered to and rejected by carriers, stands at almost 25%.
Expired stimulus payments a headwind?
Wadewitz cited the expiration of stimulus payments as a potential headwind to his bullish TL thesis. He said the payments drove personal income significantly higher year-over-year in April through June. However, he contends that the government data points to the “resilience of income levels during the pandemic” even if the stimulus payments were stripped out of the equation. Excluding the payments, wages were nearly flat year-over-year in April, rebounding to almost 3% higher by June.
He said the figures may prove elevated “given they do not account for a potential negative multiplier effect on incomes and consumption from the expiration of stimulus,” but noted that total stimulus payments have actually declined each month since April while consumer spending has increased.
On Friday, the Commerce Department reported a 1.9% seasonally adjusted increase in consumer spending from June to July. This followed sequential improvements of 6.2% in June and 8.6% in May. Consumer spending declined 12.9% in April and 6.7% in March. The data was only slightly positive in the months leading up to the pandemic.
The Commerce Department also released personal income data for July on Friday. Wages increased 8.2% year-over-year during the month inclusive of the stimulus, higher than the revised June increase of 7.9%.
Wadewitz noted that the TL stocks, while up 25% to 30% year-to-date, have lagged other transports since the end of June. He believes the increase in Class 8 orders, a sign of increasing capacity, has been a headwind to the group’s share price performance. Wadewitz said TL capacity in the spot market normally bottoms year-over-year approximately one year after orders turn positive year-over-year, implying “trucks available in the spot market could bottom in January 2021, which is similar to the 2017-2018 cycle when TL spot capacity bottomed year-over-year in January 2018.”
“However, we believe the current strength and tightness in the truckload market along with a favorable outlook for freight (due to low retailer inventories) are not fully reflected in the stocks,” Wadewitz concluded.
Albert Ferguson
“…tightness in the TL markets is expected to lead to improved revenue and margin performance for the group.”
You bet it has. With Covid-19, Geo. Floyd riots, unemployment, etc., cutting credit and raising insurance for small time trucking, the big boys gonna get that big load contract. Look for their market share to rise, fo’ sho’. NOT BIG NEWS, FREIGHT WAVES!