
This week’s FreightWaves Pricing Power Index: 70 (Carriers)
Last week’s FreightWaves Pricing Power Index: 70 (Carriers)
Three-month FreightWaves Pricing Power Index Outlook: 65 (Carriers)
The FreightWaves Pricing Power Index uses the analytics and data in FreightWaves SONAR to analyze the market and estimate the negotiating power for rates between shippers and carriers.
The Pricing Power Index is based on the following indicators:
Accepted freight volume rises year-over-year despite a tepid OTVI
Tender volumes continue to fluctuate, undoing last week’s growth and returning to levels from two weeks prior. The Outbound Tender Volume Index (OTVI) is currently at its lowest level since mid-January, when freight volumes were impacted by a federal holiday.

SONAR: OTVI.USA: 2021-22 (blue), 2020-21 (green) and 2019-20 (orange)
To learn more about FreightWaves SONAR, click here.
OTVI declined by 4.07% over the past week, despite a strong start. Even though OTVI is down 8.51% year-over-year (y/y), regular readers will remember last week’s discussion on the distinction between OTVI and accepted freight volumes. OTVI, which includes both accepted and rejected tenders, can be inflated by high rejection rates. Rejection rates last year were well above 25%, initially elevated due to the severe winter storms of 2021 and sustained by a boom in e-commerce. To put that number in perspective, more than one-in-four contracted loads were being rejected by carriers that were attracted by steep rates on the spot board.
Looking at accepted tender volumes, which is OTVI adjusted by the Outbound Tender Reject Index (OTRI), we see growth by 2.52% y/y but also a decline by 2.76% week-over-week (w/w). Inflationary pressures are starting to squeeze the consumer, who is seeing rising prices at the pump and the grocery store.
Everyday encounters with inflation, however, are not equal among all income levels. In particular, rising gas prices tend to affect lower-income consumers more, as their jobs typically do not offer an option to work from home and thus their demand for gas is inelastic to higher prices. As a result, lower-income households will focus more of their spending on gas, food and housing. The key drivers for retail will therefore be middle- and upper-class households going into the spring shopping season.

SONAR: Outbound Tender Volume Index – Weekly Change (OTVIW).
To learn more about FreightWaves SONAR, click here.
Most of the larger markets saw a contraction in freight volume this week, while tender volumes rose across smaller markets. Of the 135 total markets, only 50 reported weekly increases. Atlanta, the largest market in the country by outbound tender volume, posted a 6.6% decline in volume w/w. Ontario, California, the second-largest outbound market, saw a 2.1% decline w/w as shippers continue to divert imports to Eastern seaports.
The Texas cross-border market of Laredo, which ranks fourth in the nation by yearly import value, saw volumes jump by almost 23% w/w. While Laredo handles a variety of products coming from Mexico, like machinery and electronics, freight volume in the region is currently being driven by produce season. Looking toward the coming months, more produce volume will be shipping out of Florida and California.
By mode: Following the overall OTVI, both reefer and dry van volumes are down this week. The Van Outbound Tender Volume Index (VOTVI) is down 3.2% w/w, slightly outperforming OTVI. Although VOTVI is down 7.1% y/y, accepted van volumes are up 3.9% y/y, mirroring the trends with the general OTVI.
The Reefer Outbound Volume Index (ROTVI) is similarly stable, down only 2.1% w/w after last week’s rebound from the lull in late February. It might be shocking that ROTVI is down by 25.5% y/y, but the comparison with year-ago levels is a difficult comp for two reasons. First, shippers that would otherwise have shipped their freight by dry van took measures to protect their goods against inclement weather, raising reefer volumes in the process. Second, and more importantly, carriers rejected almost 50% of contracted reefer loads last year, thus inflating ROTVI. Accepted reefer volumes are up 5.1% y/y, thanks in large part to lowering reefer rejection rates.
Rejection rates dip significantly to lowest levels since July 2020
OTRI has finally dropped below 18%, descending to its lowest level in 20 months. Given that contract rates are at all-time highs, an increase in carrier compliance is unsurprising though welcome.

SONAR: OTRI.USA: 2021-22 (blue), 2020-21 (green) and 2019-20 (orange)
To learn more about FreightWaves SONAR, click here.
Over the past week, OTRI, which measures relative capacity in the market, dipped to 17.42%, a change of 112 basis points (bps) from the week prior. OTRI is now 911 bps below year-ago levels: a comforting thought for shippers who feared that 2021 heralded a new norm for rejection rates.
Despite OTRI falling across consecutive weeks so far in 2022, capacity is still largely unable to meet demand, hindered by an inability for new trucking equipment to be produced and by spiraling costs for used trucking units. Until the semiconductor crisis is resolved, solutions for which remain quite a ways in the future, capacity will primarily loosen in response to shipper demand. Given that produce season is warming up in Texas and southern Florida, it is unclear how OTRI will respond to demand in the spring months.

SONAR: WRI (color)
To learn more about FreightWaves SONAR, click here.
Speaking of Florida, the Lakeland market is feeling the screws tighten from capacity challenges. The map above shows the Weighted Rejection Index (WRI), the product of the Outbound Tender Reject Index-Weekly Change and Outbound Tender Market Share, as a way to prioritize rejection rate changes. As capacity is generally finding freight, there are only a handful of blue markets, which are the ones to focus attention on.
Of the 135 markets, only 42 reported higher rejection rates over the past week as carriers compete for loads among quieter freight demand.
Because of the region’s small manufacturing base, southern Florida is generally seen as an unattractive destination for carriers, which often deadhead upward of 250 miles to find freight from neighboring states. During the spring, however, carriers flock to the region like so many college students, vying to get loads. The first two weeks of Florida’s produce season are an awkward period of adjustment, as the region shows signs of increased demand yet without carriers having caught up. As a result, the market will suffer from tight coverage for the time being, but capacity will soon meet demand.

To learn more about FreightWaves SONAR, click here.
By mode: Rejection rates fell across all three modes this week, though flatbed capacity still remains the tightest among the equipment types. The spring usually sees a surge in housing starts, which drives demand for flatbeds due to their ability to haul construction materials. Coupled with a potential increase in domestic oil drilling spurred by rising gas prices, flatbed rejection rates are likely to face another round of upward pressure in the coming weeks. As of now, the Flatbed Outbound Tender Reject Index (FOTRI) sits at 37.69%, though it could soon return to levels above 40%.
Van rejection rates are driving the decline in the overall OTRI, as the Van Outbound Tender Reject Index (VOTRI) is currently at 17.12%, a full 100 bps lower w/w. Capacity conditions in the reefer market are also easing, as the Reefer Outbound Tender Reject Index (ROTRI) fell 225 bps to 28.35%.
Spot rates decline further as record-high contract rates encourage compliance
The spot rate data available in SONAR from Truckstop.com is updated every Tuesday with the previous week’s data.
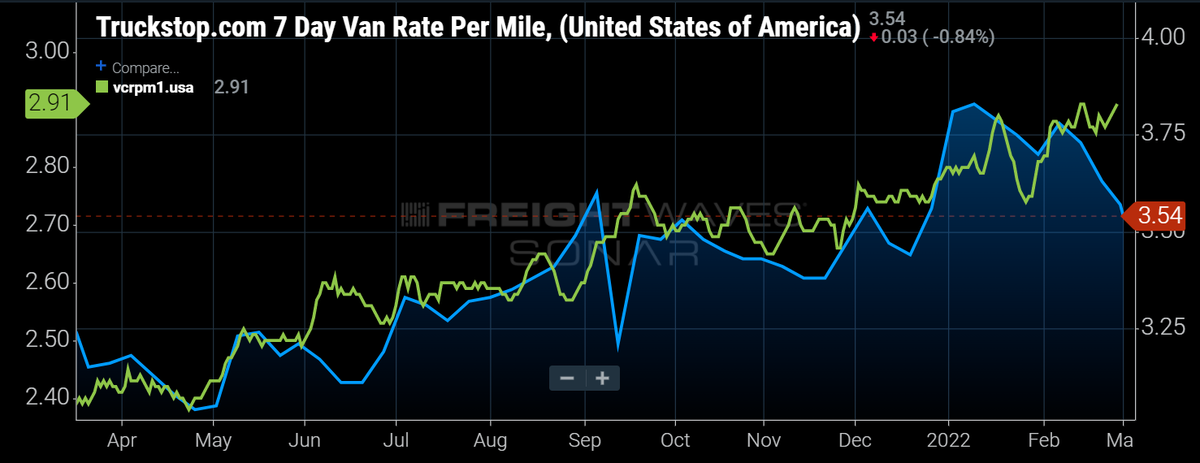
SONAR: Truckstop.com’s national spot rate (blue, right axis) and dry van contract rate (green, left axis).
To learn more about FreightWaves SONAR, click here.
The Truckstop.com national spot rate, based on the top 100 lanes on Truckstop.com’s load board, continued to drop as capacity loosened across the markets. The national spot rate, which was creeping up closer to $4 per mile at the beginning of 2022, has since fallen to $3.54 a mile, which includes fuel surcharges and other accessorials.
Of the 102 lanes from Truckstop.com’s load board, 42 reported spot rate increases last week, up from 31 lanes the week prior. Despite a falling OTRI, spot rates are likely to follow the rising costs of diesel fuel, which has spiked to $4.85 a gallon.
Contract rates set a high of $2.91 per mile in mid-February and have not budged far from that price point since. Contract rates, which are the base linehaul rate excluding fuel surcharges and other accessorials that are included in spot rates, have since returned to that record-high of $2.91 a mile, rising 5 cents per mile w/w.
Although FreightWaves’ Trusted Rate Assessment Consortium (TRAC) spot rate from Los Angeles to Dallas continues to fall, the same cannot be said for movement in the opposite direction. Rates from Dallas to Los Angeles are among the lowest in the nation, meaning that carriers are covering loads on this lane at rates near to their operational cost. Because of that razor-thin margin, spot rates (which include fuel surcharges) on this lane are heavily affected by rising diesel prices. As a result, spot rates on this lane have increased by 4 cents per mile to $1.62 a mile.

To learn more about FreightWaves TRAC, click here.
The FreightWaves TRAC spot rate from Atlanta to Philadelphia has fallen since last week, though only by 2 cents per mile. Freight demand in Atlanta is falling, as tender volumes are down by 6.6% w/w. Rejection rates for loads coming out of Atlanta have also fallen somewhat, easing capacity conditions and putting a modest amount of downward pressure on rates in the region.

To learn more about FreightWaves TRAC, click here.
Rising diesel prices will, however, continue to place upward pressure on spot rates, especially on lanes where spot rates are already close to carriers’ operating costs. Looking into the near future, capacity will likely ratchet tighter in markets that produce volume flows: most importantly, southern Texas, Florida and California. Even shippers that do not require temperature-controlled units for their freight will find tighter capacity, since dry vans will also be tasked with moving packaged goods for the produce season.
For more information on the FreightWaves Freight Intel Group, please contact Kevin Hill at khill@www.freightwaves.com or Tony Mulvey at tmulvey@www.freightwaves.com.
Freight Fraud Symposium
Double brokering. AI deepfakes. Identity theft. Freight fraud is an existential threat to the industry. Get ahead of it.
Supply Chain AI Symposium
Past the hype. Join operators, founders, and enterprise leaders figuring out how to deploy AI in supply chain.
Future of Rail Symposium
Reshoring is rewriting freight demand. Join shippers, rail executives, and government officials to shape the next decade.
Double brokering. AI deepfakes. Identity theft. Freight fraud is an existential threat to the industry. Get ahead of it.
Rock & Roll Hall of Fame • Cleveland, OH Register NowPast the hype. Join operators, founders, and enterprise leaders figuring out how to deploy AI in supply chain.
The Old Post Office • Chicago, IL Register NowReshoring is rewriting freight demand. Join shippers, rail executives, and government officials to shape the next decade.
The Signal at Chattanooga Choo Choo • Chattanooga, TN Register Now