


This week’s FreightWaves Supply Chain Pricing Power Index: 55 (Carriers)
Last week’s FreightWaves Supply Chain Pricing Power Index: 55 (Carriers)
Three-month FreightWaves Supply Chain Pricing Power Index Outlook: 40 (Shippers)
The FreightWaves Supply Chain Pricing Power Index uses the analytics and data in FreightWaves SONAR to analyze the market and estimate the negotiating power for rates between shippers and carriers.
The Pricing Power Index is based on the following indicators:
Accepted volumes finally below year-ago levels over consecutive days
Merely unseasonable dips in freight demand have cemented into a downward trend, reflecting shippers’ overfull inventories and consumer concerns about rising inflation. Even after adjusting for tricky comps, the Outbound Tender Volume Index (OTVI) continues to underperform against year-ago levels.
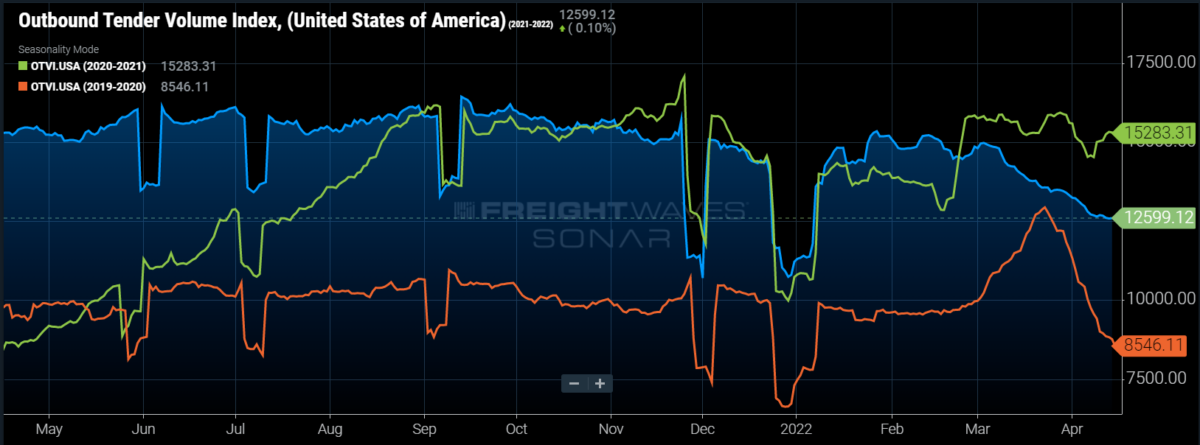
SONAR: OTVI.USA: 2021-22 (blue), 2020-21 (green) and 2019-20 (orange)
To learn more about FreightWaves SONAR, click here.
OTVI declined by 0.93% over the past week and is down 17.6% on a year-over-year (y/y) basis. Comparisons on a y/y basis can be thorny, however, because OTVI does not necessarily measure true freight flow in the market, since it can be inflated by an uptick in tender rejection rates. At this time last year, OTVI was greatly inflated by rising tender rejections, whereas tender rejections are currently in free fall.
Looking at accepted tender volumes, which is OTVI adjusted by the Outbound Tender Reject Index (OTRI), we see a decline of 1.08% y/y and slight growth by 0.48% week-over-week (w/w). In fact, Thursday marked a period of three consecutive days in which accepted volume was down y/y. A y/y dip of even two consecutive days has not been seen since the week following last Thanksgiving, when drivers elected to extend their holidays after a year of record profit.
According to the monthly release by the Department of Commerce, retail sales, including gasoline, were up 0.5% in March. Spending at gasoline stations increased by 8.9% m/m and 37% y/y. Retail sales, ex. gasoline fell by 0.3% m/m. Unfortunately, these figures aren’t adjusted for inflation, thus the headline numbers turn negative on an inflation-adjusted basis. Beyond increased spending on household necessities such as gasoline, food and utilities, consumer demand is also shifting more broadly from goods to services, the latter of which is a relatively insignificant driver of freight volume.
The reasons behind this shift are many, though a few can be easily described. First, prior to the pandemic, consumer demand was weighted heavily in favor of services. When stay-at-home measures were put in place to restrict the spread of COVID, however, these services — restaurants, movie theaters and airline travel, for example — became extremely inaccessible if they did not shut down altogether. With January’s surge of the omicron variant growing distant, lockdown measures have generally been lifted or lessened across the country, allowing consumers to resume spending on services.
Second, stimulus checks from the government spurred demand for goods, giving a jolt to e-commerce. Put simply, many people were quarantined at home with little to occupy them and an excess of stimulus money, and so bought consumer goods via online shopping platforms. This period, of course, was the golden age for carriers: a sudden influx of demand outstripping capacity, enabling carriers to charge steep rates on the spot market. But after almost two years of retail spending, consumers have effectively purchased whatever they wanted by now. With a sufficient amount of personal goods, consumers are now turning to travel and dining — luxuries not widely indulged since the pandemic’s beginning.
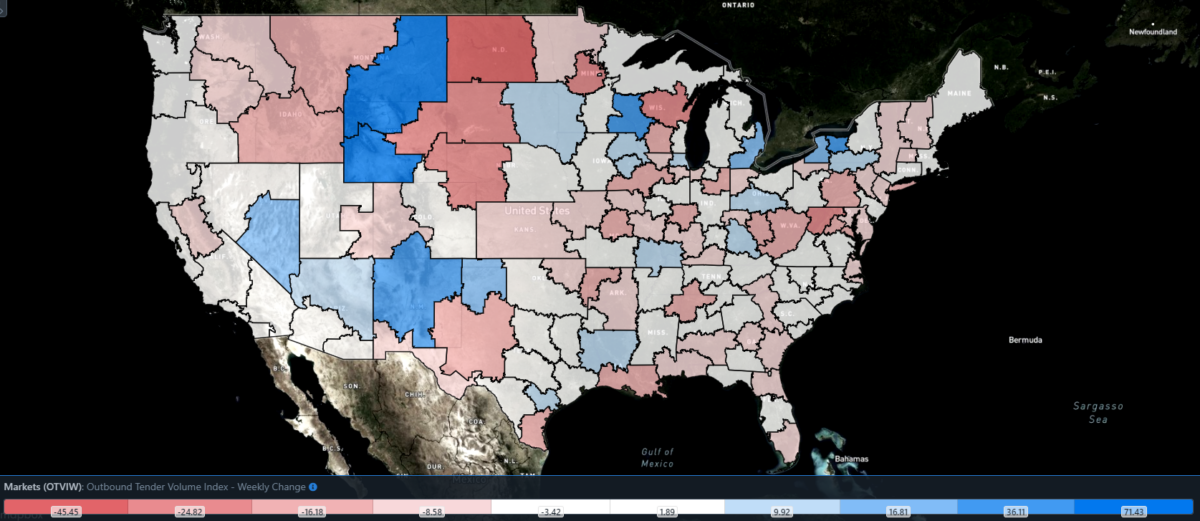
SONAR: Outbound Tender Volume Index – Weekly Change (OTVIW).
To learn more about FreightWaves SONAR, click here.
Of the 135 total markets, however, only 55 reported weekly increases, with most of the growth occurring in smaller markets.
After a period of consecutive decline since the end of March, freight demand has risen in Ontario, California. Formerly the largest freight market by outbound volume, Ontario is driven by ocean imports that come through the nearby ports of Long Beach and Los Angeles. At present, outbound tender volume is up 4.95% w/w in Ontario.
Texan cross-border markets suffered a contraction in outbound volume this past week, in large part due to a protracted dispute between Texas Gov. Greg Abbott and governors of four neighboring Mexican states. Last week, Abbott called for additional inspections on trucks crossing the border, which prompted Mexican drivers to protest the measure by blockading key bridges of entry into Texas. As a result, the cross-border markets of McAllen and El Paso took a hit in freight demand, which was down 12.84% w/w and 7.68% w/w, respectively.
By mode: As is the case with the overall OTVI, both reefer and dry van volumes are down on a w/w basis. The Reefer Outbound Tender Volume Index (ROTVI) is down 4.56% this week and down 31% y/y against an inflated ROTVI from last year. Accepted reefer volumes, however, are currently up 2.95% y/y. The picture of the Van Outbound Tender Volume Index (VOTVI) is bleaker; it is down 1.46% w/w and 18.11% y/y. Unlike reefer, accepted van volumes are down 1.13% y/y.
Stormy headwinds threaten small carriers’ straw houses
Though we at FreightWaves have discussed market cycles in the trucking industry, which typically last three or four years, OTRI’s current rate of decline is far steeper than the previous bust in 2019.
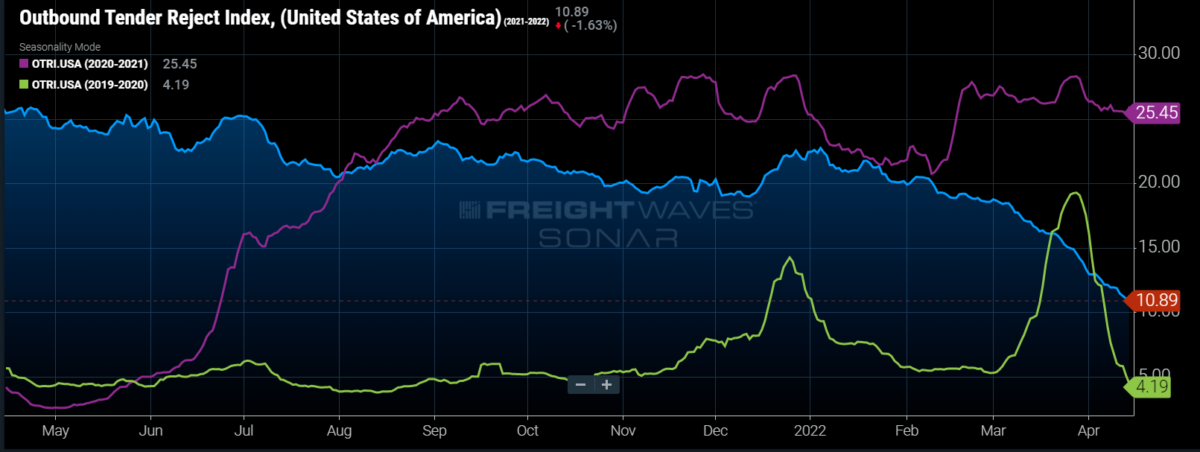
SONAR: OTRI.USA: 2021-22 (blue), 2020-21 (purple) and 2019-20 (green)
To learn more about FreightWaves SONAR, click here.
Over the past week, OTRI, which measures relative capacity in the market, fell to 10.89%, a change of 125 basis points from the week prior. OTRI is now 1,498 bps below year-ago levels as it rapidly approaches single-digit percentages.
Undoubtedly, there are several similarities between 2019 and the present day: low rates of unemployment, an overheated market for used trucking equipment and rising prices of oil and diesel fuel. But there is an important dissimilarity: Tender volumes were already on a steady decline in the second half of 2018, a trend that carried over into 2019. Likewise, OTRI first had a significant decline in mid-2018 before sinking at the beginning of 2019. In contrast, OTRI in 2022 did not begin a downward trend until early Q1; tender volumes were correspondingly stable until early March.
Some of the contrast can be explained by the extraordinary effects of the pandemic, which threw a wrench into even the most well-oiled markets. Some of it can also be explained by the shift in consumer spending from goods to services, as well as oversupply by retailers who feared disruptions in their supply chains. Still other points of contrast can be explained by an adverse conflux of geopolitical affairs, such as the development of the Russia-Ukraine conflict as well as recent surges of COVID cases (and responsive lockdown measures) in Chinese manufacturing bases. In short, the “crutch-like rod” of circumstance signals bad news for small carriers exposed to the spot market, as the worst is likely yet to come.
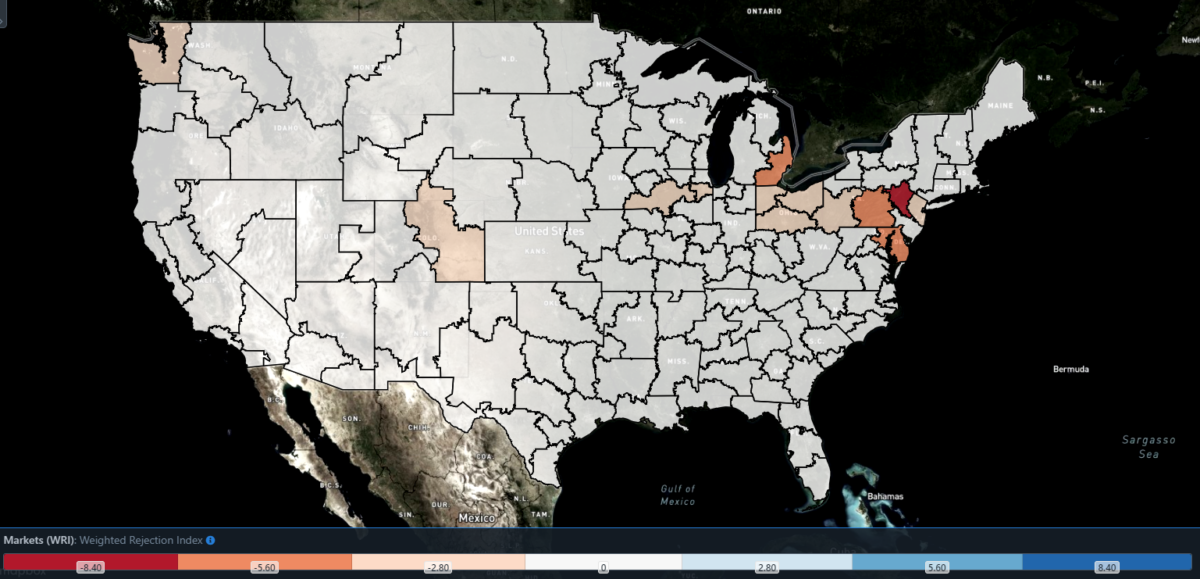
SONAR: WRI (color)
To learn more about FreightWaves SONAR, click here.
The map above shows the Weighted Rejection Index (WRI), the product of the Outbound Tender Reject Index — Weekly Change and Outbound Tender Market Share, as a way to prioritize rejection rate changes. As capacity is generally finding freight, there are only a handful of blue markets, which are the ones to focus on.
Of the 135 markets, only 31 reported higher rejection rates over the past week as carriers compete for loads amid quieter freight demand.
Earlier this week, middle Tennessee was barraged with severe wind gusts, hailstorms and flash flooding, which led to road closures and power outages in the region. As usually occurs after extreme weather, rejection rates in the Nashville market spiked by 598 bps w/w to 16.6% on Wednesday. The weather has since cleared, and no significant damages from the earlier storms have been reported.
To learn more about FreightWaves SONAR, click here.
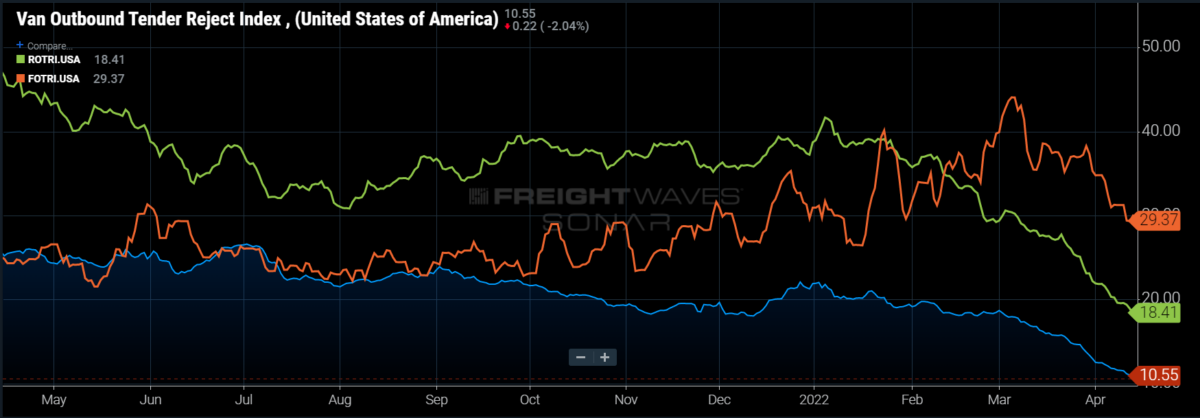
By mode: Rejection rates fell once again across all modes this week, though flatbed rejections remain higher on a y/y basis. The Flatbed Outbound Tender Reject Index (FOTRI) currently sits at 29.37%, 433 bps on a y/y basis. In reefer, however, rejection rates are down an incredible 2,875 bps y/y as the Reefer Outbound Tender Reject Index (ROTRI) is now at 18.41%. When making comparisons on a w/w basis, FOTRI and ROTRI fell 191 bps and 183 bps, respectively.
Van rejection rates are the most significant driver behind the decline in the overall OTRI, as the Van Outbound Tender Reject Index (VOTRI) is now at 10.55%, a full 121 bps lower w/w. Throughout most of Q1, OTRI has been lagging behind VOTRI by only a brief window. If you are curious about OTRI’s downward trend, particularly when it will fall to the single-digits, you can predict a couple of days into the future by looking at VOTRI.
Spot rate decline looks more like a black diamond than the bunny slope
The spot rate data available in SONAR from Truckstop.com is updated every Tuesday with the previous week’s data.
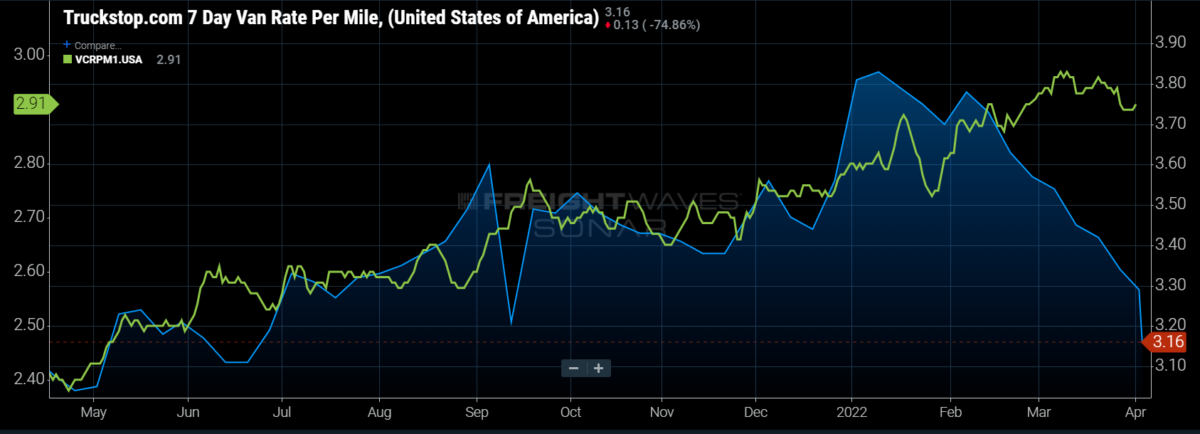
SONAR: Truckstop.com’s national spot rate (blue, right axis) and dry van contract rate (green, left axis).
To learn more about FreightWaves SONAR, click here.
Presently, Truckstop.com’s national spot rate resembles more of a ski slope than the mountainous trek on which it set forth some 22 months ago. In the past week, the Truckstop.com national spot rate, which is based on the top 100 lanes from Truckstop.com’s load board, continued adjusting to rapidly changing market conditions as the all-in rate fell another 13 cents, to $3.16 per mile. The decline brings the national spot rate to levels not experienced since June, retreating from the high of $3.83 per mile set in early January.
Of the 102 lanes from Truckstop.com’s load board, just 17 reported weekly increases, down from last week’s already staggeringly low 30 lanes that reported increases. Only the cross-border market of Laredo, Texas, saw outbound rates increase across the board as rejection rates rose in the week of April 4.
Contract rates haven’t suffered the same fate as spot rates as new contract rates continue to come online, though they have come slightly off their recent highs. Contract rates, which are reported on a two-week lag and are the base linehaul rate, dipped 5 cents per mile in the final week of Q1 to $2.90 per mile.
Contract rates continue to perform admirably compared to the previous year, currently up 20% y/y, a gap that has been maintained for much of the past six months. Contract rates are slower to react to market conditions, but as spot rates cross over contract rates, the rate of growth for contract rates will stall or could turn negative after the dramatic increase.
The changes in the freight market can be highlighted by changes out of a backhaul market like Denver moving into headhaul lanes like Los Angeles and Dallas. Typically, Los Angeles is a hotbed for freight in early spring; as a result, rates on backhaul lanes into Los Angeles are fairly low because carriers know they will get loaded at favorable rates leaving the market.
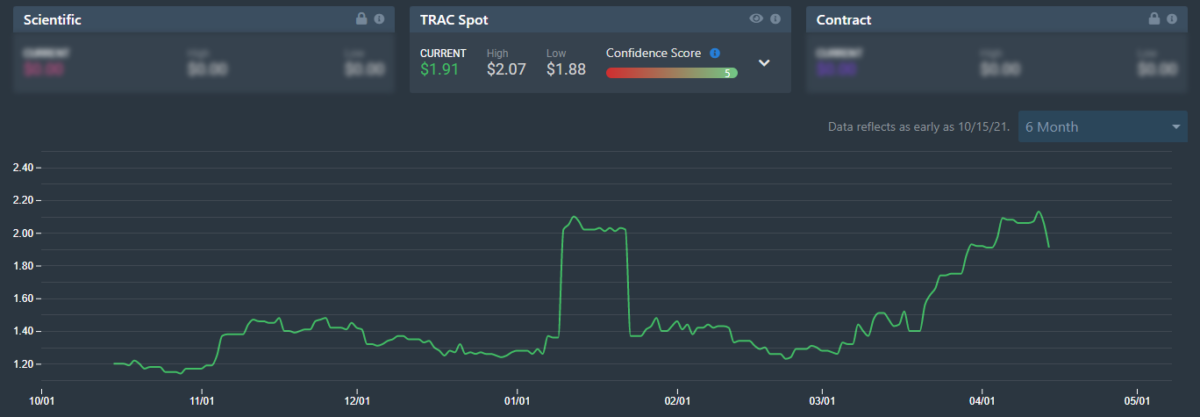
To learn more about FreightWaves TRAC, click here.
The FreightWaves Trusted Rate Assessment Consortium (TRAC) spot rate from Denver to Los Angeles tells quite the opposite story of normal freight markets. Since the beginning of March, the FreightWaves TRAC rate has increased by 53 cents, to $1.91 per mile, an increase of 38% in six weeks. The rate is now the highest it has been at any point in the past six months, indicating that carriers aren’t thinking favorably of going into Los Angeles. That isn’t a surprise given that the rejection rate has fallen below 5%.
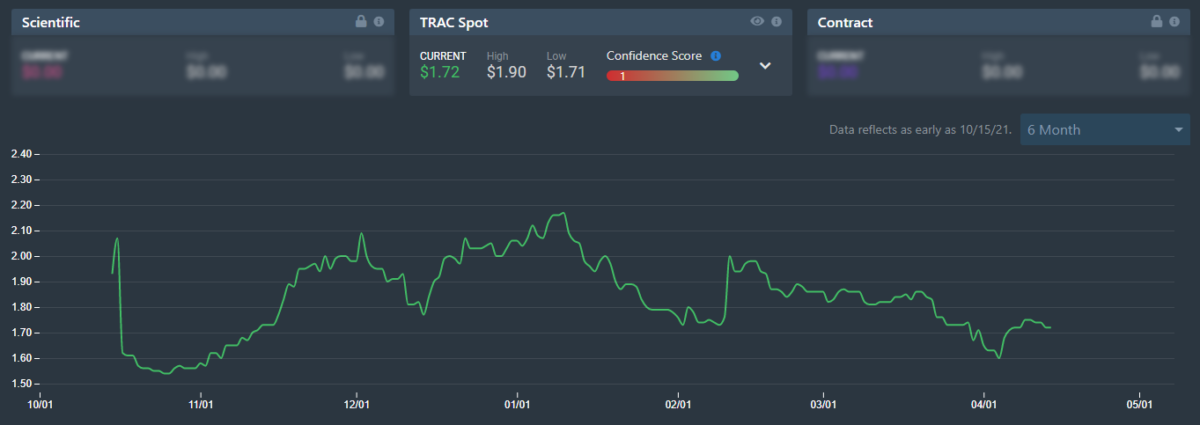
To learn more about FreightWaves TRAC, click here.
Rates heading east, into the major central U.S. market of Dallas, are trending the way the rate into Los Angeles would normally act during this time. Over the past six months, the FreightWaves TRAC rate on the Denver to Dallas lane has largely retreated from its highs at the beginning of the year. Since March 1, the rate from Denver to Dallas has fallen by 14 cents per mile to $1.72. The decline in spot rates indicates that, while the rate into Los Angeles is climbing, carriers view heading east as more favorable for rates.
With Southern California being the bellwether for how the freight market operates, if the trends established there take hold across the entire market, the ride down could get bumpy for carriers. That said, there have been some signs of rate stabilization out of Los Angeles, especially on one of the densest lanes: Los Angeles to Dallas. The FreightWaves TRAC rate along this lane dipped 4 cents per mile, to $2.86, roughly in line with where it was two weeks ago.
Ultimately, the slope that rates are currently on hasn’t shown signs of slowing down in the data, especially as rejection rates move rapidly toward 10%. As rejection rates continue to slide and tender volumes follow suit, look for spot rates to continue down the ski slope started in mid-February.
For more information on the FreightWaves Freight Intel Group, please contact Kevin Hill at khill@freightwaves.com or Tony Mulvey at tmulvey@freightwaves.com.
