Trucking Industry Crime Surge: 50 High-Stakes Incidents

The trucking industry is under siege from a relentless wave of criminal activity that threatens its stability and safety. In 2024, cargo theft incidents surged to 3,625 across North America, a 27% year-over-year increase, with losses exceeding $455 million and an average loss per theft of $202,364. The economic toll of cargo theft alone is estimated at $15–$35 billion annually, disrupting supply chains and inflating costs for businesses and consumers. Beyond financial losses, violent crimes—armed hijackings, assaults on drivers, and deadly smuggling operations—are escalating, endangering lives and exposing critical vulnerabilities in security protocols.

50 High-Value and Violent Criminal Incidents in the Trucking Industry Over the Past Year

Cargo Theft Incidents

  1. Nintendo Switch 2 Theft (Suspected Inside Job)
    • Location: Bennett, CO, USA
    • Date: June 8, 2025
    • Value: $1.4 million
    • Details: Thieves stole 2,810 Nintendo Switch 2 consoles from a trailer at a Love’s Travel Stop en route from Nintendo’s headquarters in Redmond, Washington, to a GameStop distribution center in Grapevine, Texas. The heist, requiring specialized equipment like a pallet jack, suggests meticulous planning.
    • Context: Electronics, comprising 24% of 2024 U.S. cargo thefts, are prime targets due to their resale value. Colorado’s growing logistics activity and lack of truck stop monitoring enabled this felony theft, likely an inside job exploiting shipment data.
  2. Glendale Organized Crime Cargo Thefts
    • Location: Glendale, CA, USA
    • Date: 2024–2025
    • Value: Over $200 million
    • Details: Organized crime groups in Glendale orchestrated a series of thefts targeting high-value shipments like electronics and copper from distribution centers, using double brokering and identity fraud. Stolen goods were smuggled to black markets, often across state lines.
    • Context: Glendale’s proximity to Los Angeles, a logistics hub, attracts crime, with strategic theft up 430% in 2024. California’s 45% share of U.S. thefts underscores the region’s vulnerability, exacerbated by port access and digital fraud.
  3. Strategic Cargo Theft (Identity Fraud)
    • Location: Los Angeles, CA, USA
    • Date: Q1 2024
    • Value: $250,000
    • Details: Criminals impersonated a carrier using forged motor carrier numbers to steal consumer electronics, diverting them to a warehouse.
    • Context: Los Angeles is a hotspot due to its port access, with digital load boards vulnerable to fraud, reflecting organized crime’s sophistication.
  4. Relay-Style Hijacking
    • Location: Dallas, TX, USA
    • Date: Q3 2024
    • Value: $180,000
    • Details: A theft ring used hacked GPS data to steal a copper load at a rest stop, transferring it to another truck in under 30 minutes.
    • Context: Dallas’s 78% theft spike highlights copper’s value and organized crime’s precision.
  5. Fictitious Pickup (Document Forgery)
    • Location: Chicago, IL, USA
    • Date: Q4 2023
    • Value: $150,000
    • Details: Thieves used a forged bill of lading to steal food and beverages, selling them on the black market.
    • Context: Chicago’s logistics network is prone to forgery, with automated systems missing discrepancies.
  6. Cyber-Enabled Theft
    • Location: Las Vegas, NV, USA
    • Date: Q2 2024
    • Value: $300,000
    • Details: Hackers redirected a cryptocurrency mining hardware load via a compromised load board.
    • Context: Cyber theft, often overseas, exploits digital platforms, with Nevada’s tech sector a target.
  7. Insider-Facilitated Theft
    • Location: Phoenix, AZ, USA
    • Date: Q1 2024
    • Value: $200,000
    • Details: A warehouse employee leaked pharmaceutical load schedules, enabling a theft during a rest stop.
    • Context: Insider threats are rising, amplified by Arizona’s border proximity.
  8. Massive TV and Energy Drink Theft
    • Location: Tucson, AZ, USA
    • Date: May 2025
    • Value: $3.1 million
    • Details: Four men stole $100,000 in energy drinks and $3 million in TVs, likely for international smuggling.
    • Context: Arizona’s border facilitates smuggling, with electronics and consumables prime targets.
  9. Rail Pilferage
    • Location: Phoenix, AZ, USA
    • Date: June 2024
    • Value: $500,000
    • Details: Criminals pilfered electronics from a rail shipment, with partial recovery.
    • Context: Rail theft, up 40% in 2024, exposes intermodal vulnerabilities.
  10. High-End Audio Theft
    • Location: San Bernardino, CA, USA
    • Date: Q3 2024
    • Value: $400,000
    • Details: A theft ring used stolen identities to steal audio systems from a warehouse.
    • Context: San Bernardino’s 47% theft increase targets electronics for black-market sales.
  11. Copper Theft Spree
    • Location: Great Lakes Region, USA
    • Date: Q2 2024
    • Value: $600,000
    • Details: Thieves targeted copper shipments, transporting them to Chicago.
    • Context: Copper’s value drives thefts, with Chicago aiding distribution.
  12. Avocado Load Theft
    • Location: Houston, TX, USA
    • Date: Q4 2023
    • Value: $200,000
    • Details: A load of avocados was stolen via a fraudulent pickup, costing the brokerage $200,000.
    • Context: Consumables are stolen for quick resale, with Houston’s port amplifying risks.
  13. Electronics Heist
    • Location: Atlanta, GA, USA
    • Date: Q3 2024
    • Value: $350,000
    • Details: A trailer burglary yielded high-end servers due to lax security.
    • Context: Atlanta’s logistics hub status makes it a theft target.
  14. Pharmaceutical Theft
    • Location: Memphis, TN, USA
    • Date: Q2 2024
    • Value: $250,000
    • Details: Thieves stole a pharmaceutical load at a truck stop.
    • Context: Memphis’s 14% theft increase targets pharmaceuticals for black-market sales.
  15. Hard Liquor Theft
    • Location: Louisville, KY, USA
    • Date: Q3 2024
    • Value: $180,000
    • Details: A trailer of premium liquor was stolen using forged documents.
    • Context: High-end consumables are targeted for illicit markets.
  16. Footwear Heist
    • Location: Los Angeles, CA, USA
    • Date: Q3 2024
    • Value: $220,000
    • Details: Thieves stole branded footwear at a port, exploiting overwhelmed staff.
    • Context: Footwear thefts reflect fashion market demand.
  17. Cryptocurrency Hardware Theft
    • Location: Dallas, TX, USA
    • Date: Q1 2024
    • Value: $280,000
    • Details: A load was redirected via hacked load board instructions.
    • Context: Dallas’s tech cargo fuels cyber-theft.
  18. Cosmetics Theft
    • Location: Miami, FL, USA
    • Date: Q4 2024
    • Value: $150,000
    • Details: A trailer was burglarized at a port, with cosmetics stolen.
    • Context: Miami’s ports are hotspots for consumer goods theft.
  19. Protein Powder Theft
    • Location: Chicago, IL, USA
    • Date: Q2 2024
    • Value: $170,000
    • Details: Thieves used insider information to steal supplements.
    • Context: Consumables are stolen for fitness markets.
  20. Last-Mile Courier Theft
    • Location: Memphis, TN, USA
    • Date: December 2024
    • Value: $100,000
    • Details: A courier van delivering electronics was robbed by impostors.
    • Context: Last-mile thefts spiked 13% during holiday season.
  21. Jewelry Heist
    • Location: California, USA
    • Date: 2022 (Indictments in 2025)
    • Value: $100 million
    • Details: A gang stole jewelry from trucks, with indictments in 2025.
    • Context: Long-term organized crime targets luxury goods.
  22. Amazon Cargo Theft
    • Location: Nationwide, USA
    • Date: 2024–2025
    • Value: $83 million
    • Details: A crime ring stole Amazon cargo, including TVs and grills.
    • Context: E-commerce giants are prime targets for fraud.
  23. Electronics Cargo Heist
    • Location: California, USA
    • Date: Q3 2024
    • Value: $1.6 million
    • Details: Thieves exploited CDL vetting loopholes to steal electronics.
    • Context: Regulatory gaps enable fraud.
  24. Nut Load Theft
    • Location: Fresno, CA, USA
    • Date: Q1 2024
    • Value: $200,000
    • Details: A load of almonds was stolen via a fictitious pickup.
    • Context: Agricultural goods are targeted for export.
  25. Swimwear Interception
    • Location: Nevada to Texas, USA
    • Date: Q1 2024
    • Value: $150,000
    • Details: A swimwear load was intercepted
    • Context: Seasonal goods are vulnerable to theft.
  26. High-End Server Theft
    • Location: Seattle, WA, USA
    • Date: Q2 2024
    • Value: $320,000
    • Details: Thieves stole servers from a tech warehouse.
    • Context: Tech hubs face equipment thefts.
  27. Trailer Burglary
    • Location: New York City, NY, USA
    • Date: Q4 2024
    • Value: $190,000
    • Details: A trailer of consumer goods was burglarized.
    • Context: NYC’s logistics network sees elevated thefts.

Drug Smuggling Incidents

  1. Cocaine Smuggling (Commercial Truck)
    • Location: US-Canada Border, Ontario, Canada
    • Date: November 2024
    • Value: $40 million (street value)
    • Details: Drivers were caught with 1,146 pounds of cocaine in a truck.
    • Context: Borders are key smuggling routes.
  2. Cocaine in Empty Trailer
    • Location: Laredo, TX, USA
    • Date: June 2025
    • Value: $4.8 million
    • Details: CBP found 363 pounds of cocaine in an “empty” trailer.
    • Context: Laredo’s border is a smuggling hub.
  3. Cocaine Across Border
    • Location: Peel, Ontario, Canada
    • Date: June 2025
    • Value: $47.9 million
    • Details: A group smuggled 479 kg of cocaine and handguns via trucks.
    • Context: Peel is a Canadian smuggling hotspot.
  4. Cocaine in Dashboard
    • Location: El Paso, TX, USA
    • Date: June 2025
    • Value: $500,000
    • Details: CBP detected 20 pounds of cocaine in a truck’s dashboard.
    • Context: Detection tech is critical at borders.
  5. Cocaine in Tractor Trailer
    • Location: Harlingen, TX, USA
    • Date: June 2025
    • Value: $496,000
    • Details: A Mexican citizen was caught with 15.5 pounds of cocaine.
    • Context: K9 units uncover hidden drugs.
  6. Methamphetamine Seizure
    • Location: Manitoba, Canada
    • Date: February 2025
    • Value: $50 million
    • Details: CBSA seized $50 million in meth; the driver was arrested.
    • Context: Meth smuggling is rising in Canada.
  7. Fentanyl Smuggling
    • Location: Nogales, AZ, USA
    • Date: Q1 2025
    • Value: $10 million
    • Details: CBP intercepted 200 pounds of fentanyl in a produce truck.
    • Context: Fentanyl’s potency drives smuggling.
  8. Marijuana Smuggling
    • Location: Buffalo, NY, USA
    • Date: Q4 2024
    • Value: $2 million
    • Details: A truck with 500 pounds of marijuana was stopped.
    • Context: Legalization disparities fuel smuggling.
  9. Heroin Smuggling
    • Location: San Diego, CA, USA
    • Date: Q3 2024
    • Value: $1.5 million
    • Details: CBP found 50 pounds of heroin in a truck’s fuel tank.
    • Context: San Diego’s proximity to Mexico drives trafficking.
  10. Cocaine in Produce Load
    • Location: Pharr, TX, USA
    • Date: Q2 2024
    • Value: $3 million
    • Details: CBP seized 100 pounds of cocaine in a vegetable shipment.
    • Context: Produce loads are smuggling covers.
  1. Double Brokering Scam
    • Location: Nationwide, USA
    • Date: Q2 2024
    • Value: $175,000
    • Details: Criminals double-brokered an electronics load, leaving carriers unpaid.
    • Context: Double brokering surged 400%, targeting small fleets.
  2. Cross-Dock Diversion
    • Location: Phoenix, AZ, USA
    • Date: Q1 2024
    • Value: $200,000
    • Details: A fictitious carrier diverted a computer load to a warehouse.
    • Context: Arizona’s fraud reflects cross-border risks.
  3. Broker Impersonation
    • Location: Houston, TX, USA
    • Date: February 2025
    • Value: $150,000
    • Details: Criminals posing as a broker diverted an energy drink load.
    • Context: Impersonation scams exploit broker trust.
  4. Double Brokering (Pharma Load)
    • Location: Atlanta, GA, USA
    • Date: Q3 2024
    • Value: $180,000
    • Details: A pharmaceutical load was re-brokered and stolen.
    • Context: Pharma loads are prime fraud targets.
  5. Hostage Load Scam
    • Location: Los Angeles, CA, USA
    • Date: Q4 2024
    • Value: $200,000
    • Details: Thieves demanded ransom for a stolen load.
    • Context: Hostage loads are a growing theft tactic.
  6. Impostor Pickup Fraud
    • Location: Chicago, IL, USA
    • Date: Q2 2024
    • Value: $160,000
    • Details: Thieves posed as drivers to steal cosmetics.
    • Context: Impostor pickups exploit busy warehouses.
  7. Fraudulent Carrier Scam
    • Location: Dallas, TX, USA
    • Date: Q1 2024
    • Value: $190,000
    • Details: A fake carrier stole audio equipment.
    • Context: Credential theft enables fraud.
  8. Double Brokering (Food Load)
    • Location: Miami, FL, USA
    • Date: Q3 2024
    • Value: $140,000
    • Details: A food load was re-brokered, leaving the broker unpaid.
    • Context: Food thefts rose to 22% of incidents.
  9. Online Impersonation Fraud
    • Location: Nationwide, USA
    • Date: Q4 2024
    • Value: $170,000
    • Details: Scammers used VoIP to steal supplements.
    • Context: Remote fraud targets digital systems.
  10. Broker Credential Theft
    • Location: Memphis, TN, USA
    • Date: Q2 2024
    • Value: $200,000
    • Details: Hackers stole credentials to divert a pharmaceutical load.
    • Context: Cyber fraud hits brokers’ systems.

Violent Incidents and Other Crimes

Double Brokering and Fraud Incidents

  1. Armed Hijacking
    • Location: Long Beach, CA, USA
    • Date: Q4 2024
    • Value: $150,000
    • Details: Armed thieves held a driver at gunpoint, stealing consumer goods at a port.
    • Context: Violent pilferage is rising near ports, endangering drivers.
  2. Human Smuggling Conviction
    • Location: Texas, USA
    • Date: 2022 (Convictions in 2024)
    • Value: Loss of life
    • Details: Two men were convicted for a deadly 2022 human smuggling attempt.
    • Context: Human smuggling prompts stricter penalties.
  3. Violent Warehouse Break-In
    • Location: Toronto, Canada
    • Date: Q3 2024
    • Value: $300,000
    • Details: Armed criminals assaulted a guard to steal electronics.
    • Context: Toronto’s logistics hub faces violent thefts.

Causes of the Surge in Cargo Theft and Violent Crime

The surge in cargo theft and violent crime, exemplified by the $1.4 million Nintendo Switch heist and Glendale’s $200 million-plus cargo thefts, stems from interconnected factors:

  1. Economic Pressures and Freight Recession: The freight downturn has strained small carriers, pushing some toward crime. Economic desperation fuels insider threats, as seen in the suspected inside job in the Nintendo theft, and violent acts at truck stops.
  2. Sophistication of Organized Crime: Groups like those in Glendale use advanced tactics—double brokering, identity fraud, and GPS hacking—to steal high-value loads. Violent incidents, such as armed hijackings, reflect their boldness, with low prosecution risks yielding high rewards.
  3. Technological Vulnerabilities: Digital tools like load boards and GPS systems are exploited by cybercriminals.
  4. Inadequate Security Infrastructure: Truck stops, like the one in Bennett, and warehouses often lack surveillance or personnel. Violent incidents in Long Beach and Toronto expose these gaps, leaving drivers and cargo vulnerable.
  5. Lax Enforcement and Prosecution: Weak prosecution and underreporting hinder deterrence. Cross-state thefts complicate recovery, with lenient penalties failing to curb crime.
  6. Geographic and Operational Risks: Hubs like California and Texas are prime targets due to shipment volumes. The Nintendo theft in Colorado shows risks spreading, with rest stops enabling violent thefts.
  7. Rise in Violent Tactics: Armed hijackings and assaults, as in Long Beach and Toronto, show criminals’ aggression.
Why You Don’t Need 10 Trucks to Make 7 Figures

How Intentional Planning and a Lean Operation Can Beat Market Volatility

There’s this belief floating around that 10 trucks is the magic number. That once you hit double digits, you’ve made it. That it somehow guarantees seven figures, financial freedom, or a smooth operation.

But the truth is—and I say this as someone who’s coached hundreds of carriers—there are folks with three trucks doing $1.1M in gross, and folks with twelve trucks scrambling to cover payroll every Friday.

In a market like this—where diesel is unstable, brokers are holding margins tight, and volume can swing 20% week to week—you don’t win by stacking equipment. You win by building a business that’s lean, strategic, and focused on what matters: profit, control, and repeatability.

The Market Won’t Carry You Anymore

During the 2021–2022 run-up, you could be sloppy and still stay afloat. Rates were high. Load boards were hot. And even the worst-run operations were making money.

That season’s over.

In 2025, you’re dealing with:

  • Volatile diesel costs
  • Extended days-to-pay
  • More competition per posted load
  • Tighter broker margins
  • Compliance crackdowns and audit pressure

That means every decision—from the truck you buy to the lane you run—has to be intentional.

Seven figures is no longer a milestone you stumble into. You have to plan for it, price for it, and operate into it.

Truck Count ≠ Profit

Let’s start with a mindset shift.

Truck count is not a business plan. It’s not even a meaningful metric without context.

I’ve seen two-truck operations with 35% net margin and no debt. I’ve seen ten-truck operations hemorrhaging $25,000/month because their back-office couldn’t scale, their fuel was unmanaged, and their drivers weren’t retained.

You want to grow? Good. But what are you growing into?

  • Are your trucks profitable?
  • Is your dispatch tight?
  • Do you know your net per truck per week?
  • Is your breakeven dialed in?

If you don’t have those answers yet, adding more trucks is not scaling—it’s multiplying risk.

The Math Still Works—But You Have to Work It

Let’s go beyond the theory. Here’s how two trucks can cross a million in gross revenue with the right discipline.

Assume:

  • 2,800 miles per week, per truck
  • $2.85/mile all-in
  • That’s $7,980/week per truck
  • Two trucks = $15,960/week
  • $15,960 x 52 weeks = $829,920/year

Now layer in one dedicated lane, brokered run, or subcontracted specialty job that adds $3,500/week in recurring revenue:

  • $3,500 x 52 = $182,000
  • $829,920 + $182,000 = $1,011,920/year

That’s seven figures—with two or three trucks and one specialty angle.

But here’s the key: You only get there if you’re tracking every cost, maximizing every mile, and avoiding the distractions that come with chasing load boards 24/7.

Goal-Setting: What’s Your Target and Why?

Before you set a truck goal, set a business goal.

  • Are you chasing $1M in revenue? Or $250K in take-home?
  • Do you want to be home weekly? Or run regional?
  • Are you building to sell? Or building to stay lean?

Too many carriers scale without intention. They buy more trucks because they think revenue equals success, without realizing that growth without margin is just busier bankruptcy.

Ask yourself:

  • What’s my margin goal per truck?
  • What’s my ideal net at 2 trucks vs 4?
  • Can I maintain service and compliance if I double fleet size?

Don’t just chase growth—chase growth you can manage, sustain, and repeat.

The Danger of Scaling Into a Broken System

I’ve seen it too many times: a carrier starts making money with one or two trucks and decides to scale—but their operation is still being held together with spreadsheets and phone calls.

  • Dispatch is scattered
  • Billing is late
  • Maintenance is reactive
  • Driver onboarding is improvised
  • There’s no SOP, no process, and no plan

Adding more trucks just multiplies the cracks.

If your first truck isn’t profitable, your fourth won’t save you. If you can’t invoice cleanly today, ten trucks won’t help you get paid faster. Every inefficiency gets amplified as you grow.

What Real Scaling Looks Like

Scaling isn’t about the number of trucks—it’s about what your business can handle with precision.

Smart carriers scale like this:

  • They document dispatch and billing workflows
  • They automate load tracking and driver check-ins
  • They set clear KPIs per lane and per truck
  • They run a real orientation process—even if they only have one new driver
  • They aren’t dependent on spot freight to survive
  • They know how to say no to bad freight, no matter how many trucks they have

These are the carriers that actually stay in business when the market shifts.

How to Set Seven-Figure Goals That Actually Work

If your goal is to build a million-dollar trucking business, here’s how to think about it:

  1. Reverse-engineer your revenue
    • How many loads per week?
    • What’s your average margin per load?
    • How much of that can be locked in via contract or recurring lanes?
  2. Track your operational capacity
    • How many trucks can you support before needing more admin help?
    • Can you survive if 20% of your fleet is down for a week?
    • What’s your ideal weekly dispatch rhythm?
  3. Forecast based on breakeven, not top-line
    • Know your cost per mile
    • Know your cost per week per truck
    • Know your annual fixed costs (insurance, software, compliance)
  4. Grow your systems before your size
    • Set up your back-office to handle volume BEFORE it comes
    • Create driver SOPs before hiring
    • Set KPIs for every part of your operation

Bottom line: Don’t plan to grow. Plan to be ready for growth.

Final Word

You don’t need 10 trucks to hit seven figures.
What you need is:

  • A clean system
  • A margin-first mindset
  • The ability to say no to bad freight
  • The discipline to operate like a company, not a hustle

Three trucks with control will outperform ten trucks with chaos every time.

If you’re thinking about growth, start with questions—not purchases:

  • Is my dispatch process repeatable?
  • Do I know my net profit by lane?
  • Can I support another truck without breaking operations?

If the answer is yes, you’re ready to scale. If not—build foundation first.

Because real growth in this market isn’t about truck count. It’s about operating on purpose, not impulse.

Want seven figures? Great.

But make sure it’s seven figures worth keeping. Not just seven figures worth bragging about.

Vay and Kodiak partner to integrate assisted autonomy technology

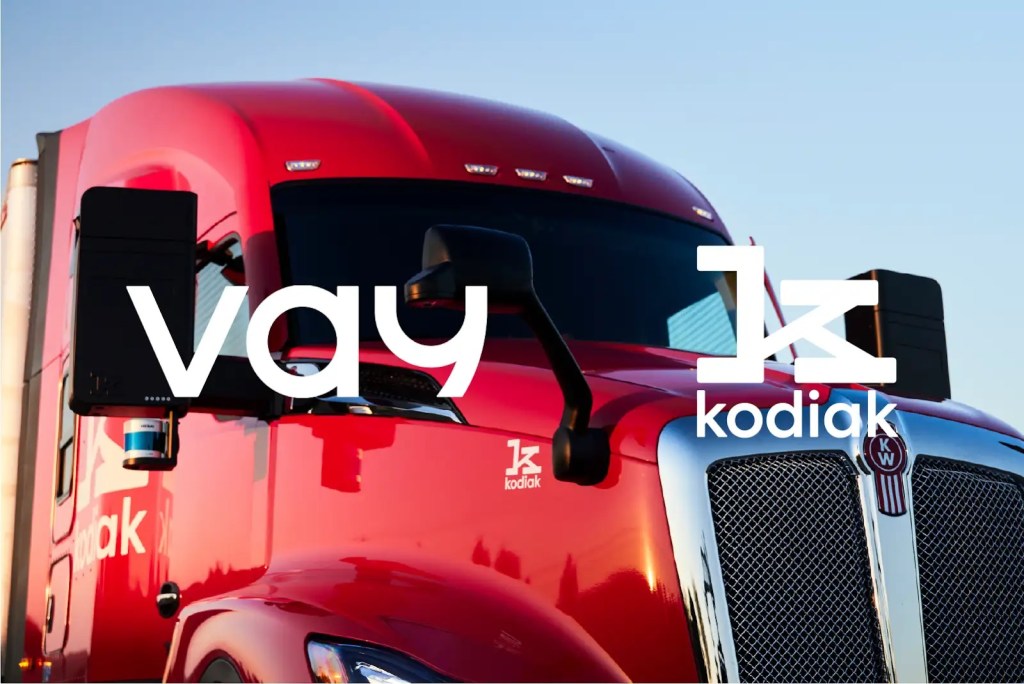
Kodiak autonomous truck

Vay, a maker of automotive-grade remote driving technology, recently announced a strategic partnership with Kodiak Robotics to incorporate Vay’s remote driving technology into Kodiak’s autonomous tech stack. The partnership, announced on Wednesday, enables Kodiak’s Assisted Autonomy technology to remotely control driverless trucks with a human operator for specific scenarios like low-speed navigation via a human operator.

Assisted Autonomy is part of the broader Kodiak Driver functionality. Through this collaboration, Kodiak has deployed Vay Stations and software tools that enable low-latency communications between the stations and Kodiak Driver-powered vehicles. 

“Assisted Autonomy provides the Kodiak Driver with more flexibility to deliver our customers’ freight in a greater range of locations and scenarios,” said Don Burnette, founder and CEO of Kodiak in a press release. “No matter the maturity of an autonomous driving system, there are still scenarios that will benefit from human assistance, if only as a backup.”

Kodiak is using Vay’s technology as part of its Permian Basin autonomous operations in West Texas and Eastern New Mexico, where their driverless trucks are operating. The technology being used in low-speed operations at customer facilities and complex interactions such as interpreting law enforcement hand signals.

“Over the last year, Vay has proven the use cases for remote driving—both in B2C and B2B settings. The strategic partnership with Kodiak will expand the B2B use cases to trucks,” said Thomas von der Ohe, co-founder and CEO of Vay in the release. “We are excited to partner with Kodiak to help make trucking and freight delivery safer and more efficient by marrying the value of human decision-making with autonomous operations.”

Vay’s stations allow for real-time streaming of a near 360-degree view around Kodiak trucks. All Assisted Autonomy drivers hold Commercial Driver’s Licenses and undergo rigorous training. The system employs multiple redundant communications protocols to ensure connectivity with the trucks.

Torc expands with new engineering center in Michigan

(Photo: Torc Robotics)

Self-driving truck tech maker Torc Robotics announced on Tuesday the establishment of a new engineering center in Ann Arbor, Michigan.

The strategic expansion aims to speed up the company’s efforts toward its 2027 commercialization goal while taking advantage of the region’s robust automotive and technology talent pool.

As part of this expansion, Torc collaborated with the Michigan Economic Development Corporation to secure incentives supporting its growth in the state. The company plans significant hiring to enhance its technical capabilities in the region.

“This strategic location is a natural fit for Torc as we continue to advance our autonomous technology,” said Jamie Swaim, chief people officer at Torc in a press release. “Ann Arbor’s proximity to the Detroit automotive industry and a wealth of high-tech talent, combined with the exceptional concentration of high-caliber universities and colleges, makes it an ideal environment for our growth and productization strategy.”

The new 32,000-square-foot facility, in northeast Ann Arbor, will feature multiple collaboration spaces and hardware-in-the-loop labs. The center will host a diverse range of engineering roles, including experts in machine learning, software, hardware, and systems engineering, alongside positions in product engineering and safety.

Torc’s Ann Arbor facility complements its existing operations in Blacksburg, Virginia (headquarters), Austin, Texas, Montreal, Canada, and the Dallas-Fort Worth area. 

You’re halfway there! To read the rest of the Truck Tech newsletter, subscribe below. It’ll be delivered to your inbox every Friday at 11am eastern.

While you’re at it, check out this week’s episode.

How to Budget Weekly Pay When Freight is Inconsistent

Inconsistent freight isn’t just a market trend—it’s a reality every small fleet owner has to face head-on. One week you’re running $3.20/mile on solid round trips. The next, you’re fighting for $2.10/mile spot market loads and dealing with detention that doesn’t pay. But your bills? They don’t care. Driver pay, insurance, maintenance, truck payments, and fuel all come due whether rates are up or down.

The key to surviving this market isn’t chasing perfect loads—it’s building a budget system that works even when things get volatile. This isn’t about spreadsheets you forget to update. It’s about tactical, real-world money management that gives you control week after week.

Step 1 — Build Your Fixed Weekly Overhead

Before you even start looking at loads or lanes, you need to know what your bare minimum weekly costs are. These are the numbers that don’t change whether your truck rolls 500 miles or 2,500 miles.

Your fixed overhead includes:

  • Truck payment (divide monthly payment by 4.33 to get weekly)
  • Insurance (physical damage, cargo, liability, occupational)
  • Trailer payment (if financed)
  • ELD and tech subscriptions
  • Permit and license fees (spread out over the year)
  • Back office support or dispatch fees (if applicable)

Create a list and total it up. That’s your weekly baseline. Let’s say it’s $1,900. That means before fuel, tolls, or food, you owe $1,900 just to exist.

Tactical Tip:

Use a whiteboard in your office or cab with that number written in red. You should see it every Monday morning.

Step 2 — Know Your Variable Costs by the Mile

Next, calculate your per-mile variable expenses, which fluctuate based on how much you run:

  • Fuel (based on current MPG and price per gallon)
  • Maintenance reserve (set aside $0.15–$0.20/mile minimum)
  • Tires and repairs
  • Driver pay (if not salaried)
  • Tolls and scales

Track this over a 30-day rolling period to get your real average. If you’re running 2,200 miles a week and spending $2,000 on fuel and $300 on driver pay, your variable cost per mile might be close to $1.20–$1.40.

Multiply that by your target miles each week. That gives you your operating cost floor.

Step 3 — Set a Weekly Revenue Target (Not Just RPM Goals)

Instead of chasing “good paying loads,” set a minimum weekly revenue target that keeps your business above water. It’s not just about getting to $2.50/mile. It’s about generating enough revenue to cover your fixed and variable costs and put profit in your pocket.

Here’s a formula that works:

(Fixed Costs + Variable Costs + Profit Goal) = Weekly Revenue Target

If your fixed cost is $1,900 and you expect to run 2,200 miles at $1.30/mile in variable costs, that’s $2,860. Add a $1,200 profit goal. You now need $5,960 in gross revenue that week.

This number is your true benchmark—not whatever the rate boards are throwing at you.

Step 4 — Build in a Flex Budget for Slow Weeks

Some weeks you won’t hit your target—and that’s where most carriers fall apart. Instead of scrambling and cutting pay or skipping bills, plan for the inconsistency.

How to build a flex budget:

  • Allocate 10–15% of weekly profit into a savings buffer
  • Hold back one week of payroll in reserve at all times
  • Use a separate business savings account for slow-week coverage

This buffer becomes your shock absorber when brokers cancel, weather hits, or rates crash mid-week.

Bonus Tip:

Name the account something motivational like “Freight Survival Fund” or “Keep the Wheels Turning.” You’re more likely to protect it.

Step 5 — Track Cash Flow Weekly, Not Monthly

Too many small carriers only look at cash flow once a month—by then, it’s too late. Weekly review gives you real-time clarity.

Your weekly cash flow checklist:

  • Total gross revenue collected (not invoiced—collected)
  • Fuel spend (from receipts or fuel card data)
  • Repairs and unexpected costs
  • Driver pay issued
  • Outstanding invoices (watch your aging!)

This review takes 30 minutes every Sunday. Do it like it’s your pre-trip.

Step 6 — Adjust Pay Systems for Flexibility

If you pay yourself or your drivers a fixed amount each week, but your revenue swings wildly, you’re going to burn out—or go broke.

Instead, create a tiered pay system that adjusts based on weekly gross:

  • Under $4,000 — minimum survival pay only
  • $4,000–$6,000 — base pay + % bonus
  • Over $6,000 — full pay + performance incentives

This protects your cash on weak weeks and rewards strong performance on better ones.

Communicate clearly with drivers so they understand the structure—and always be transparent about why it exists.

Final Word

Budgeting in trucking isn’t about spreadsheets or perfection—it’s about discipline and visibility. When the market is unpredictable, your budget is your stability. Build a real system that covers fixed costs, manages variable ones, and creates margin even when freight is inconsistent.

Don’t let the market write your paycheck. Take control. Build a weekly system that keeps you in the black—no matter what the boards look like.

Because when you manage your money like a carrier with 20 trucks, you won’t just survive the ups and downs. You’ll start building the kind of operation that outlasts them.

CarriersEdge launches new assessment to address English proficiency requirements

Online driver training provider CarriersEdge recently announced the release of an English Language Proficiency Assessment designed to help carriers prepare for enforcement of U.S. regulations under 49 CFR §391.11(b)(2). The assessment, released Thursday, is in response to recent regulatory changes that allow drivers to be placed out of service if they fail a roadside English proficiency interview.

The new assessment tool serves as a diagnostic resource for carriers concerned about compliance with the language proficiency requirements. “Many of our customers have contacted us to say they are very worried about the new enforcement rules and the ambiguity regarding how they will be applied,” said Jane Jazrawy, CEO of CarriersEdge. “The easy-to-administer assessment is a diagnostic tool carriers can use to understand what sort of risk they are facing with their drivers.”

The tool is available to all CarriersEdge customers. The assessment uses visual cues and audio questions to evaluate a driver’s ability to comprehend and respond to typical roadside inspection scenarios. Test components include identifying road sign meanings and responding to common inspection questions.

CarriersEdge cautions that passing their assessment does not guarantee a driver will pass an actual roadside inspection. The company recommends carriers evaluate their specific risks and develop plans, given the remaining uncertainties about enforcement implementation. To address these concerns, CarriersEdge executives recently conducted a webinar titled “Inside The US Language Proficiency Requirements” to discuss the rule and planning strategies.

Current CarriersEdge customers can access the test by logging into their system and searching for the English Proficiency Test. Non-customers interested in the assessment can sign up for a free trial on the CarriersEdge website.

Fleetworthy launches industry-first expedited inspection in Nevada

(Photo: Jim Allen/FreightWaves)

Fleetworthy on Tuesday officially launched its Expedited Inspection feature, only available through Drivewyze by Fleetworthy, starting with deployment in Nevada. The announcement follows successful pilot programs and is initially available to fleets using Geotab or Platform Science electronic logging devices (ELDs).

The industry-first solution, according to Fleetworthy, securely and automatically transfers fleet and vehicle registration data to pre-fill inspection forms while streamlining the delivery of a driver’s Electronic Record of Duty Status directly to enforcement personnel. Through the reduction of manual data entry requirements, the technology speeds up roadside inspection. Faster inspections means decreased time at inspection sites, and helps reduce the risk of violations, particularly those related to Hours of Service data.

“We’re thrilled to announce this industry-first capability, starting with Nevada,” said Shay Demmons, Chief Product Officer at Fleetworthy in the release. “Our PreClear weigh station bypass customers can activate Expedited Inspection through their ELD, and once done, they’re set with Nevada and any new states as they come on board.”

Nevada Highway Patrol Lieutenant Tappan Cornmesser added, “Nevada is proud to lead the way with technology that benefits the entire industry by helping keep freight moving safely and efficiently. By partnering with Drivewyze by Fleetworthy on Expedited Inspection, we’re empowering our officers with tools that reduce manual tasks and accelerate inspections.”

The technology works by integrating with Drivewyze PreClear, which provides weigh station bypasses based on safety scores across North America. Even when drivers are randomly pulled in for inspection, Expedited Inspection is expected to deliver significant time and cost savings by automating traditionally manual elements of the inspection process.

Fleetworthy plans to expand the technology to additional states soon, marking what Demmons calls “a significant step forward for Fleetworthy and the broader transportation industry” by removing manual HOS data handoffs and automating inspection workflows.

You’re halfway there! To read the rest of the Loaded and Rolling newsletter, subscribe below. It’ll be delivered to your inbox every Thursday at 2pm eastern.

Most recent episode

Three Load Planning Mistakes That Drain Fuel and Profit

You don’t need to be a freight analyst to know that profit in trucking is made—or lost—between the loads. It’s not just about what you haul. It’s about how you move between hauls. That’s where fuel gets wasted, hours get chewed up, and your driver’s clock gets burned with nothing to show for it. Bad load planning doesn’t just cost you time—it drains profit from every mile you run.

Inconsistent dispatching, poor planning, and ignoring data will put even the most experienced small fleet owners in the red. Let’s break down the top three load planning mistakes we see week after week—and more importantly, how to fix them before they cost you another week’s profit.

Mistake 1 — Planning Loads Without Looking at Empty Miles

Most carriers look at the rate per mile on the loaded leg and think they’re making money. They’re not. Because they didn’t calculate the all-in cost, which includes every single mile the truck moves.

Let’s look at a real example:

  • Load A pays $3.00/mile from Charlotte to Atlanta (245 miles)
  • Then you deadhead 100 miles to grab your next load
  • That next load pays $2.10/mile going back to Charlotte

On paper, it looks good—because both loads pay decently. But when you calculate the empty miles and divide the total revenue by the total miles run (loaded + empty), your all-in RPM drops under $2.40.

That’s not enough when your fixed costs and variable costs, they are all rising.

Fix It:

Pro Tip:

Use Google Maps in hybrid satellite mode to plan fuel stops, avoid traffic choke points, and identify safer rest areas near load origins. Wasted fuel often comes from poor routing—not just high prices.

Mistake 2 — Accepting Loads That Kill Your Clock

You can have the best rate on paper—but if it burns your clock with detention, tight appointment windows, or long check-in times, you’re losing money.

A carrier we worked with ran a load from Dallas to Kansas City for $3,100 on a tight timeline. Good rate. But:

  • The pickup took 5 hours (2 of them unpaid)
  • The driver sat at the receiver 6 hours waiting to unload
  • That delay pushed back their next load pickup by 10 hours

That single scheduling failure blew the week’s rhythm. The carrier had to settle for a weaker reload, and they lost a $3/mile return trip to another carrier who got there first.

Fix It:

  • Vet the facility on Dock411 
  • Look for Google reviews of shippers/receivers and call them if you’ve never been there
  • Always ask the broker about dwell time and whether detention is guaranteed in writing
  • Avoid first-come-first-serve docks that take longer than 2 hours unless detention pay is baked in

Pro Tip:

Avoid facilities that don’t respect your hours—it’s death by a thousand cuts.

Mistake 3 — Planning Loads Without a Weekly Net Profit Target

Too many carriers plan one load at a time instead of mapping out a weekly profit plan. That’s like trying to run a marathon one step at a time without knowing where the finish line is.

Let’s say you run two loads that both pay $2,000. Sounds good. But after factoring, fuel, tolls, and food, you’re left with $1,200 net.

But what if your weekly fixed expenses—insurance, truck payments, permits—are $1,000? You just ran all week and cleared $200.

This happens more than you think, especially when you’re not tracking all-in net.

Fix It:

  • Start your week by writing your weekly net profit target (ex: “I need $1,500 NET after expenses this week.”)
  • Reverse-engineer your load planning based on that number—not just RPM
  • Track all fixed and variable expenses and build in a buffer

Pro Tip:

Use a rolling average of net profit per truck, not gross revenue. Gross looks pretty on Instagram—net keeps the lights on.

Real Talk From the Podcast – Why EF Routing Can Make You  Rethink Load Planning

Smarter Loads, Stronger Margins – efRouting on Fixing the Routing Problem in Trucking

On The Playbook Long Haul podcast, we had a solid conversation with the folks over at EF Routing—and it really hit home just how much money small carriers are leaving on the table because of poor planning.

What stood out wasn’t just the tech, but the mindset shift. Instead of chasing the next decent-paying load, they talked about building your entire week around net profit, not just revenue. EF Routing helps break down routes based on deadhead, timing, and fuel—not just rate-per-mile. And when you hear how some carriers were able to tighten up their entire operation just by reworking how they plan from Monday through Friday, it clicks.

It wasn’t a sales pitch—it was a conversation about how to stop running in circles. If you’ve ever looked back at your week and wondered why you worked so hard for so little, that episode’s worth a listen. It’ll make you rethink how you plan your next move.

Bonus Mistake — Not Using Your Own Data to Plan Smarter

Many small carriers run loads and never look back. But the best carriers analyze their own patterns to plan better over time.

Are you tracking:

  • Best lanes by RPM and net profit?
  • Worst brokers by deadhead or wait times?
  • Facilities that delay you or cost detention hours?

Fix It:

  • Create a load planning log for every load: pickup, delivery, RPM, detention, broker name, facility score
  • Review weekly to see what’s working
  • Build a “preferred” and “avoid” list

Final Word

Load planning isn’t dispatching. It’s not just about finding freight—it’s about controlling cost, preserving time, and protecting margin. One bad load can cancel out the gains from three good ones. But when you plan based on efficiency—not just rate—you create consistency. And consistency is what keeps small fleets alive.

Start tracking your real miles. Vet your facilities. Protect your clock. And plan for net, not just revenue.

Because in this market, surviving isn’t about how many loads you haul. It’s about how many dollars you actually keep.

Driver Shortage Myths Debunked: Freight Demand Drives Trucking Jobs

truck driver

The trucking industry’s “driver shortage” debate has persisted for decades. The American Trucking Associations (ATA) claims a chronic shortage since 1987, citing nine studies. Yet, researchers and industry experts argue the labor market functions well when freight demand is strong. A December 2024 study by Professors Jonathan Phares, Jason Miller, and Stephen Burks, published by the Association for Supply Chain Management, shows carriers hire drivers when freight demand rises and reduce staff when it falls.

Carriers respond rationally to demand. Strong freight needs prompt hiring, often with higher wages to attract drivers. Weak demand leads to job cuts. The persistent shortage narrative, driven by ATA-sponsored studies, oversimplifies the role of freight demand.

The COVID-19 pandemic cut trucking jobs by 84,500 (5.6%) from March to April 2020—the largest monthly drop on record. This disruption highlighted how freight demand shaped state-level recovery from May 2020 to December 2021. Seven factors influenced job creation.

How Freight Demand Creates Trucking Jobs

Major points in the study:

  1. Natural Resource Extraction: Fracking and mining generate significant freight. A single fracking well requires over 1,145 heavy truck trips for materials like sand. The 2020 oil price decline reduced drilling by 41% and mining by 10%, cutting freight in North Dakota and Wyoming, where trucking jobs fell 18% and 15% by 2021. Low demand halted hiring, as specialized trucks couldn’t shift to other freight.
  2. Warehousing Expansion: E-commerce drove warehousing jobs up 14% in 2020 and 38% in 2021. In California and Arizona, this increased drayage and local freight, boosting trucking payrolls by 8%. High demand spurred carriers to hire more drivers.
  3. Container Ports: A 17% rise in 2021 retail imports at ports like California and Georgia fueled drayage and transloading jobs. Strong freight volumes encouraged hiring, with minimal competition from port labor.
  4. Construction, Wholesaling, Couriers: These sectors added freight without competing for drivers. Florida’s 2.6% construction growth by 2021 supported an 11.8% rise in trucking jobs, as material hauls drove demand. Wholesaling and couriers, linked to e-commerce, sustained freight without pulling drivers.
  5. Manufacturing: Generating 60% of for-hire trucking ton-miles, manufacturing sustains freight demand. Michigan’s auto sector recovery by 2021 increased jobs in states like Ohio, as carriers hired to transport factory goods.
  6. Retail and Consumer Goods: A 17% surge in 2021 retail imports drove distribution needs. In Florida, retailers’ demand for trucks to deliver goods spurred hiring.
  7. Energy and Macroeconomic Factors: Refining and petrochemical freight declined in 2020, slowing job growth. Holiday retail peaks and oil price recoveries in 2021 increased freight, prompting carriers to hire.

Why Construction Doesn’t Compete with Trucking

Contrary to popular belief, construction does not significantly compete with trucking for labor. The study shows construction generates freight that supports trucking jobs. In Florida, a 2.6% rise in construction employment from 2019 to 2021 aligned with an 11.8% increase in trucking jobs, as projects like nonresidential building required material hauls (Page 9). Construction’s labor needs—carpenters, electricians—differ from truck drivers’ skills, reducing rivalry. Unlike extraction, where specialized equipment limits flexibility, construction freight uses standard trucks, enabling carriers to hire without losing drivers to construction roles. This complementary demand refutes assumptions of labor competition.

Labor and Competition Dynamics

High freight demand drives carriers to offer competitive wages, attracting drivers. Young firms hire actively during manufacturing or retail surges but reduce staff when freight slows. E-commerce and ports created jobs with little labor competition, as construction and courier roles differ from driving.

Implications for Trucking

Regulators should focus on freight demand, not labor competition. E-commerce, ports, and manufacturing drive job growth by increasing transport needs. Extraction-heavy regions face hiring challenges when demand is low. Managers must plan for freight spikes, like holiday seasons, and oil price shifts. Policymakers should support freight-generating sectors—e-commerce, manufacturing, retail—over shortage-focused policies like younger driver programs.

Key Takeaway

States with robust warehousing, ports, manufacturing, and retail saw rapid job growth post-COVID, while extraction declines limited hiring. Construction supports trucking without labor rivalry. The bottom line: Want more truck drivers? Add more freight, carriers will figure out a way to find them. Freight demand, not driver supply, drives trucking jobs, challenging shortage myths and guiding industry and policy strategies.

Running on Ice: World Refrigeration Day brings about the future of cold chain

Thursday, June 26 was World Refrigeration Day. It’s not a major holiday, but it is a great reason to bring awareness and continue the conversation around safe and sustainable temperature-controlled supply chains. This year’s theme, “Cool Skills,” shines a light on the broad array of competencies essential to modern cooling. From refrigeration system design and low‑carbon technology to data analytics and regulatory compliance.

President & CEO of The Global Cold Chain Alliance (GCCA), Sara Stickler, said in an American Journal of Transportation article, “Over the coming decades we can expect global food supply chain resilience to become increasingly dependent on temperature-controlled logistics, particularly as populations face disruptions as a result of geopolitical uncertainties, fast changing populations, and changing weather patterns. Skill areas such as data analysis, automation management, energy efficiency, and the development and operation of AI-driven systems will be increasingly important to the cold chain of the future.”

Various professional bodies and organizations are stepping up, such as the American Society of Heating, Refrigerating and Air‑Conditioning Engineers (ASHRAE), part of the global “Cool Skills” initiative, which advocates for education and certification programs covering refrigerant management, energy efficiency, and cutting‑edge building systems like low‑carbon heat pumps.

Through its partnership with the UN Environmental Programme’s OzonAction team, ASHRAE is offering free tools like sustainability checklists for plant managers and technicians, helping to benchmark plant performance and ensure regulatory alignment.  

Although initiatives are often led by U.S. and European bodies, their impact is felt worldwide, aligning with GCCA programs like the Cold Chain Institute to upskill professionals across regions.

World Refrigeration Day 2025’s “Cool Skills” campaign signals a new era where skilled professionals are the linchpin of a clean, efficient, resilient cold chain, safeguarding food safety and enabling global trade. 

Get the full newsletter in your inbox every Friday by subscribing to Running on Ice

Werner wins big: Court reverses $100 million nuclear verdict

sideview of a parked Werner tractor-trailer with a driver

Werner Enterprises v. Blake: Texas Supreme Court Reverses $100 Million Verdict

Introduction to the Case

In a significant legal decision, the Texas Supreme Court ruled in favor of Werner Enterprises, Inc. and its driver, Shiraz A. Ali, reversing a $100 million verdict previously upheld by an appellate court. The case stemmed from a 2014 fatal crash near Odessa on Interstate 20 during hazardous winter weather conditions. The accident involved a pickup truck driven by Trey Salinas, with Jennifer Blake and her three children as passengers. After losing control on icy roads, Salinas’s F-350 crossed a 42-foot median and collided with Werner’s 18-wheeler traveling in the opposite direction. The collision killed seven-year-old Zackery Blake, left twelve-year-old Brianna Blake permanently quadriplegic, and caused traumatic brain injuries to fourteen-year-old Nathan Blake and Jennifer Blake.

Trial and Verdict

In 2018, a Houston jury delivered one of the highest monetary judgments against a motor carrier in Texas history. The jury found Werner and Ali liable for the accident, apportioning 70% of the responsibility to Werner employees other than Ali, 14% to Ali, and 16% to Salinas, the pickup driver. The jury awarded substantial damages: $16,500,000 to Jennifer Blake, $5,000,000 to Nathan Blake, and $68,187,994 to Brianna Blake. The district court entered judgment against Werner and Ali for these amounts, plus court costs and interest, though the defendants received credit for a settlement the plaintiffs reached with Salinas before trial.

Court of Appeals Proceedings

Werner appealed the jury verdict in October 2018 to the Texas Fourteenth Court of Appeals in Houston. The company challenged the legal and factual sufficiency of the jury’s negligence findings against both Ali and Werner, as well as jury charge issues, apportionment, admission of evidence, and the award of future medical expenses. The case was initially assigned to a three-justice panel, but before that panel issued a decision, the court voted to consider the case en banc.

In a divided 5-4 decision, the en banc court of appeals affirmed the district court’s judgment. The four dissenting justices, writing across two opinions, agreed with the majority that sufficient evidence supported the jury’s negligence finding against Ali but disagreed on other aspects of the case. The first dissent argued that the district court erred in submitting the “direct” theory of Werner’s liability to the jury, while the second dissent would have rendered a take-nothing judgment regarding derivative theories of liability against Werner based on the “Admission Rule.”

Supreme Court of Texas Decision

On June 27, 2025, the Texas Supreme Court reversed the appellate court’s decision and rendered judgment for the defendants. Chief Justice Blacklock delivered the opinion of the Court, focusing primarily on the issue of proximate cause. The Court held that Ali’s negligence, if any, was not a proximate cause of the plaintiffs’ injuries.

The Court’s analysis hinged on the principle that “a negligent actor incurs liability only for damages proximately caused by his negligence.” While the plaintiffs proved at trial that the accident might not have occurred, or the injuries might have been less severe, if not for the 18-wheeler’s speed (which was below the speed limit but considered unsafe for the icy conditions), the Court determined this was insufficient to establish that the defendant’s negligence was a “substantial factor” in bringing about the injuries.

The opinion stated: “This awful accident happened because an out-of-control vehicle suddenly skidded across a wide median and struck the defendant’s truck, before he had time to react, as he drove below the speed limit in his proper lane of traffic. That singular and robustly explanatory fact fully explains why the accident happened and who is responsible for the resulting injuries.”

Legal Analysis of Proximate Cause

The Court’s decision rested on a careful examination of proximate cause, which requires both “but-for” causation and “substantial-factor” causation. While the defendant’s presence and speed might satisfy the “but-for” test (without the truck being there, the collision would not have occurred), the Court emphasized that “it is not enough that the harm would not have occurred had the actor not been negligent.”

Drawing on established precedent, the Court noted that within the concept of proximate cause, there “always lurks the idea of responsibility.” The substantial-factor requirement compels an inquiry into whether the defendant is “actually responsible for the ultimate harm” given the nature of their causal connection to the accident.

The Court determined that Ali’s presence on the highway, combined with his speed, merely “furnished the condition that made the injuries possible” but did not proximately cause them. Instead, “the sole proximate cause of this accident and these injuries—the sole substantial factor to which the law permits assignment of liability—was the sudden, unexpected hurtling of the victims’ vehicle into oncoming highway traffic, for which the defendants bore no responsibility.”

The Court emphasized that, compared to the “central and defining fact” of the pickup careening across a wide median into oncoming traffic, anything the defendant did or did not do was “too attenuated to qualify as the substantial factor necessary for proximate causation.”

Implications

The Texas Supreme Court’s decision in Werner Enterprises v. Blake establishes an important precedent regarding proximate cause in highway collision cases. By distinguishing between creating a condition for harm and being a substantial factor in causing harm, the Court has clarified when motor carriers can be held liable for accidents involving vehicles crossing medians.

DOT Secretary Duffy: Nationwide non-domiciled CDL audit; ELP enforcement | WHAT THE TRUCK?!?

On episode 855 of WHAT THE TRUCK?!? Dooner is joined by U.S. Transportation Secretary Sean Duffy. Duffy is here to announce a new pro-trucker package and nationwide audit of non-domiciled CDLs. The pro trucker package addresses parking, bad brokers, removes speed limiters and more. We’ll learn how Secretary Duffy plans to Make Trucking Great Again. 

Cleo’s Frank Kenny stops by to talk about the trade deal deadline. With China saying they have framework for a new deal and a July 9th deadline rapidly approaching, what will it all mean for retail and shippers? 

According to studies, 51% of truck drivers smoke. It’s still a nasty habit that has a hold on our industry. Nic Nac Naturals Nicco Magnatto says he has developed an alternative. 

Catch new shows live at noon EDT Mondays, Wednesdays and Fridays on FreightWaves LinkedIn, Facebook, X or YouTube, or on demand by looking up WHAT THE TRUCK?!? on your favorite podcast player and at 6 p.m. Eastern on SiriusXM’s Road Dog Trucking Channel 146.

Watch on YouTube

Check out the WTT merch store

Visit our sponsor

Subscribe to the WTT newsletter

Apple Podcasts

Spotify

More FreightWaves Podcasts