Telematics on the rise in trucking insurance underwriting
Trucking insurance premiums have increased roughly 5% year over year across the board for the past few years. Despite carriers’ attempts to reduce premiums, rates are still increasing, mostly due to the fact that trucking insurance market has not been profitable for 10 of the past 11 years.
Some of the main factors causing insurance companies to lose money are the rise in cargo theft and nuclear verdicts, which have pushed insurers to increase premiums, making coverage costs a larger burden for motor carriers.
Carriers are looking for ways to reduce premiums, and insurance companies are looking to return to profitability. That’s where the wider use of telematics in underwriting for insurance companies comes in. This advancement has enabled carriers to secure competitive rates while encouraging safer driving practices.
When it comes to external factors that affect motor carriers’ premiums, Jackson Alexander, executive vice president of sales at Reliance Partners, said, “Unfortunately for trucking companies, there is almost no correlation between insurance costs and external economic factors like increased fuel prices and decreased revenue per mile.”
Alexander adds: “From an insurance company’s perspective, whether a trucking company was paid $2 per mile or $3 per mile doesn’t really impact their exposure. The chances of being involved in a liability claim, the cost to repair any damage to the insured’s truck and/or trailer, the value of the cargo, etc. are all the same regardless of how much you were paid to run that load. The same can be said for the cost of fuel. This is why trucking has been so tough for the last couple of years – there is pressure from all angles.”
Insurance companies look to mitigate risk and reduce the likelihood of having to pay out a claim. That is where the use of telematics has become so popular. Insurers are looking for data around harsh braking, sharp turns, speeding and following too closely. These factors are analyzed more critically than others because data shows they are frequent causes of truck accidents.
The wide adoption of telematics is predominant in the new space of insurtechs. Insurtechs are insurance companies that heavily utilize technology. They believe that analyzing individual driving behavior through telematics is the most important factor in weighing risk.
“Some insurtechs, HDVI and Nirvana for example, do a holistic look back at the last 90 days of telematics data prior to even offering an insurance quote,” Alexander said. “If you are not willing to share your historical telematics data, you aren’t eligible for a quote from them.”
“While it’s not a guarantee that using an insurance provider that incorporates telematics in their underwriting will reduce a trucking company’s premiums right away, there are several insurtechs out there that are offering aggressive rates,” he says. “They believe the additional data points they have from the telematics gives them a leg up on insurance carriers who rely more on traditional sources of underwriting information (loss run reports, CSA scores, driver records, etc.) and allows them to better price risk. Of course, even if the telematics data is favorable, other red flags to an insurance company could still cause insurance rates to rise.”
The adoption of telematics in insurance underwriting represents a critical step toward addressing the challenges facing the trucking insurance industry. For motor carriers, the integration of telematics offers an opportunity to control rising insurance costs while fostering a culture of safety and efficiency. Meanwhile, insurers can use telematics to build more sustainable business models, ensuring the long-term viability of coverage for the trucking sector.
Growth in air cargo demand to decelerate in 2025, IATA says
Air cargo volume growth will be halved in 2025, but it will still be a good year for carriers behind continued ocean shipping delays, tight freighter capacity and strength in cross-border e-commerce, the International Air Transport Association forecast.
Cargo volumes are expected to reach 80 million tons, a 5.8% increase from 2024, the trade association said. Cargo demand this year has grown year over year between 10% and 13%, depending on whether it is measured by traffic (cargo ton kilometers) or tons, with the consensus growth rate at 12%. Volumes during the third quarter were second only to the fourth quarter of 2021, when the coronavirus pandemic supercharged airfreight shipping.
The growth projection closely aligns with recent predictions by other market watchers. Freight data provider Xeneta recently said air cargo demand will grow 4% to 6% next year, while capacity increases in the 4% to 5% range. Consultancy Rotate pegs demand growth at about 4%. And logistics giant DSV suggested air cargo growth could be flat.
“It should also be noted that the 2024 year-on-year growth rates have been off an overall weak 2023 market. So sustaining these double annual growth rates is going to become just a little bit harder,” said IATA economist Ghislaine Lang during an online media briefing last week.
The current fourth quarter is on track for a record high. The only reason it doesn’t appear as a normal peak season leading to holiday shopping events is that volumes have been strong all year, without any seasonal ebbs. In other words, demand this quarter could reach levels not seen since the pandemic-fueled boom in 2021 but sequentially since the summer upward activity has been less pronounced.
Industry analysts say pricing has remained rational in the face of heavy demand because businesses have been proactive about moving shipments ahead of the usual crunch time and executing short-term contracts for guaranteed space instead of booking on demand.
IATA forecast that air cargo traffic, a measure of combined weight and distance flown, for the full 2024 will grow 11.8% and flirt with the all-time high.
IATA’s outlook calls for member passenger and cargo airlines to achieve cargo revenue of $157 billion in 2025, up 5.4% from the current year. At that level, cargo will represent 15.6% of airlines’ total revenues compared to 12% in 2019. It said average yields should remain stable at 30% above pre-pandemic levels.
During the coronavirus pandemic, freighters became the dominant form of air cargo as passenger aircraft were largely sidelined. The ratio of freighter to belly traffic has since normalized to about 55/45 with the full recovery of global air travel, but demand for dedicated widebody freighters exceeds capacity as factory-built and converted freighters face production delays.
Most of the imbalance is in the trans-Pacific trade lane where the share of dedicated freighter capacity (89%) is higher today than at the height of the pandemic and belly capacity between the U.S. and China is still low because of diplomatic disputes. As lower-deck capacity moves away from China, all-cargo airlines have moved assets from other regions to the Asia-Pacific and the center of e-commerce activity.
Direct-to-consumer e-commerce shipments have been the primary driver of air cargo growth in recent years, with muted growth in other commodities. Experts attribute more than 50% of air cargo volumes out of Asia this year to e-commerce. The influx of large online marketplaces, executing direct-to-consumer fulfillment strategies from China, has elbowed out more traditional freight like apparel, electronics and automotive parts, and influenced the upward move in yields. The traditional B2B airfreight market is likely to rebound next year, supported by demand for semiconductors to power AI, advanced computer processing and electric vehicles, freight data provider Xeneta predicts in its 2025 air cargo outlook.
Global yields in October were about 50% higher than in 2019 and up 11% year over year, primarily because of rates on westbound routes out of Asia and the Middle East to Europe and the Americas. The strengthening of average rates led IATA to forecast a smaller-than-expected decline of -3.5% for 2024 and flat yields for 2025 – but still one-third above pre-pandemic levels.
(Airlines will achieve $157 billion in cargo revenue next year, up 5.4% from the expected total this year. (Photo: Jim Allen/FreightWaves)
The air logistics sector has also benefited from businesses pivoting to air transport because of attacks pushing container vessels away from the Suez Canal and around Africa. Red Sea diversions continue to result in delays and are putting upward pressure on ocean rates on key trade corridors, with global spot prices up 200% year over year. Escalation in ocean rates has narrowed the price gap with airfreight, which is now only five times more expensive than ocean shipping versus 10 to 15 times more expensive historically.
Demand has been strong on all trade corridors, with some growth on secondary lanes attributed to logistics providers routing goods through the Middle East, Africa and Europe to take advantage of transshipment options rather than simply using trans-continental options, said Lang.
Meanwhile, aircraft cargo capacity continues to grow but at a slower pace than demand. With China fully reopening borders and passenger airlines resuming full international schedules, aircraft cargo capacity will end the year up 9.6% from 2023. Next year, capacity growth will decelerate to 6.4%, IATA said. The way the forecasts stack up suggests there could be more capacity entering the market than demand, which could put downward pressure on rates.
The overall economy remains favorable for air cargo, with the World Trade Organization predicting merchandise trade growth of 3% (on par with GDP) in 2025, up from 2.7% this year. But the growth trend could be impacted by several gathering storm clouds.
U.S. President-elect Donald Trump has already threatened widespread tariffs, which is likely to trigger retaliation from other countries. A trade war will be inflationary and dampen consumer spending, economists say. Meanwhile, an increased regulatory focus on import security and duty-free e-commerce shipments could also act as a drag on international air shipping.
Industry stakeholders will be watching how airfreight demand responds if ocean shipping rates drop back to pre-pandemic levels, especially if the Red Sea conflict is resolved, or if e-commerce respond to regulatory pressure by moving to a hybrid model based on a mix of direct fulfillment by air and pre-stocking forward warehouses in the U.S. and other markets.
Conversely, the air logistics sector could see a spike in shipments to the United States if a threatened strike by dockworkers shuts down U.S. East Coast and Gulf Coast ports, forcing businesses to make alternative import/export plans for high-value goods and critical industrial components.
Airline industry outlook as a whole
The overall airline industry is expected to hit the $1 trillion revenue mark next year after rising 6.2% to $965 billion this year, a gain that will help deliver net profit of $36.6 billion. That’s an improvement from the estimated $31.5 billion net profit in 2024 and 3.3% margin, IATA said. Average net profit per passenger is anticipated to be $7.
Expenses are expected to grow by 4% to $940 billion, before interest and taxes.
The outlook for better financial performance is a function of lower jet fuel prices and efficiency gains. The price of jet fuel fell to $70 per barrel in September for the first time since the start of the Russia-Ukraine War nearly three years ago, due to oversupply by the United States. IATA said jet fuel is expected to average $87 a barrel (down from $99 a barrel in 2024), based on a jet fuel crack spread of $12 per barrel and a crude oil price of $75 per barrel (Brent). As a result, airlines’ cumulative fuel spend is expected to be $248 billion, a decline of 4.8% despite a 6% rise in the amount of fuel expected to be consumed. Fuel is expected to account for 26.4% of operating costs in 2025, down from 29% in 2024.
Further gains are being stymied by supply chain troubles at aircraft and engine manufacturers, which is limiting airlines’ ability to modernize or grow their fleets and driving up costs in areas such as aircraft leasing and maintenance.
Net profitability will also be squeezed as airlines are expected to exhaust their tax losses carried forward from the pandemic era, leading to an increase in tax rates in 2025, IATA said.
A primary area for cost escalation is labor as pilots, flight attendants and mechanics achieved sizable wage increases in recent contracts. In 2025, labor costs are expected to total $253 billion, up 7.6% from 2024. With productivity gains, however, average labor unit costs are likely to rise by only 0.5% in 2025 compared to 2024.
Overall nonfuel unit costs rose 1.3% in 2024 for a total of $643 billion. Nonfuel unit cost increases in 2025 are expected to inch up to $692 billion.
The return of Trump as president is creating uncertainty for the airline sector. On the one hand, tariffs could lead to slower economic growth, but a more business-friendly Trump approach to regulation and taxation could help U.S. carriers. It is also unclear whether a Trump administration will support production incentives for sustainable aviation fuel.
Profits “will be hard-earned as airlines take advantage of lower oil prices while keeping load factors above 83%, tightly controlling costs, investing in decarbonization, and managing the return to more normal growth levels following the extraordinary pandemic recovery. All these efforts will help to mitigate several drags on profitability which are outside of airlines’ control, namely persistent supply chain challenges, infrastructure deficiencies, onerous regulation and a rising tax burden,” said IATA Director General Willie Walsh.
“The buffer between profit and loss, even in the good year that we are expecting of 2025, is just $7 per passenger. With margins that thin, airlines must continue to watch every cost and insist on similar efficiency across the supply chain — especially from our monopoly infrastructure suppliers who all too often let us down on performance and efficiency,” he said.
More challenging capacity conditions ahead of the holidays
This week’s FreightWaves Supply Chain Pricing Power Index: 35 (Shippers)
Last week’s FreightWaves Supply Chain Pricing Power Index: 35 (Shippers)
Three-month FreightWaves Supply Chain Pricing Power Index Outlook: 40 (Shippers)
The FreightWaves Supply Chain Pricing Power Index uses the analytics and data in FreightWavesSONAR to analyze the market and estimate the negotiating power for rates between shippers and carriers.
This week’s Pricing Power Index is based on the following indicators:
Volumes continue to recover, but challenged year over year
The truckload market has recovered from the Thanksgiving holiday, but with less than two weeks until Christmas, the rebound is likely to be short-lived. Throughout December, tender volumes have actually held up better than previous years, but it appears it has to do with the timing between Thanksgiving and Christmas this year compared to previous years.
SONAR: Outbound Tender Volume Index — Seasonality View: 2024 (white) and 2023 (pink) To learn more about SONAR,click here.
The Outbound Tender Volume Index (OTVI), a measure of national freight demand that tracks shippers’ requests for trucking capacity, has continued to rebound from the Thanksgiving holiday, increasing by 7.46% over the past week and is up over 2% in the past month. Compared to this time last year, the OTVI is still down 5.29%. Part of the reason for the limited growth in the OTVI has been the growth in loaded intermodal volumes, which are up 11% year over year.
Volumes across the mileage band are continuing to rebound from the Thanksgiving holiday, but only the local length of haul, or loads moving less than 100 miles, has seen volumes grow over the past year. Volumes for local length of haul are up 3.12% year over year, while long-haul volumes or loads moving 800 miles or more are down nearly 10% y/y.
SONAR: Contract Load Accepted Volume – Seasonality View: 2024 (white) and 2023 (pink) To learn more about SONAR,click here.
Contract Load Accepted Volume (CLAV) is an index that measures accepted load volumes moving under contracted agreements. In short, it is similar to OTVI but without the rejected tenders. Looking at accepted tender volumes, the recovery is far less pronounced, rising 6.9% over the past week, driven by an upward movement in tender rejection rates. Compared to this time last year, CLAV is down 6%.
November’s retail sales data is set to be released later this week, but early reads on spending in November were strong. Bank of America’s card spending report showed that spending was up 0.6% year over year in November. Even with the late Thanksgiving holiday that pushed Cyber Monday into December, expectations are for sales to grow by 0.5% m/m.
SONAR: Outbound Tender Volume Index – Weekly Change To learn more about SONAR,click here.
As volumes continue to rebound out of the Thanksgiving holiday, the vast majority of the markets in the country have higher volumes week over week. Of the 135 freight markets tracked within SONAR, 108 have seen tender volumes increase over the past week.
Volumes in the largest markets in the country have increased fairly significantly over the past week. In Atlanta, tender volumes have increased by over 10% w/w while farther up the East Coast, volumes out of Harrisburg, Pennsylvania, increased by 8.1%.
In the center of the country, it was more of a mixed bag as tender volumes out of Dallas increased by 9% but volumes out of Chicago fell by 12.6% week over week.
On the West Coast, tender volumes out of Los Angeles increased by 9.43% w/w, driven by significant increases in volumes ranging from 100 miles to 800 miles (short haul, midhaul and tweener lengths of haul). Long-haul volumes out of Los Angeles increased by 5.76% over the past week and are up 7.6% y/y.
SONAR: Van Outbound Tender Volume Index (white, right axis) and Reefer Outbound Tender Volume Index (green, left axis) To learn more about SONAR,click here.
By mode: The dry van market is leveling off at a higher level than it was in November. Over the past week, the Van Outbound Tender Reject Index increased by 7.3%. Some of that increase is a result of noise around the Thanksgiving holiday, but dry van volumes are up 1.7% over the past month, which shows there has been some growth since early November. Still, van volumes are down 5.8% year over year.
The reefer market continues to show it is holding up quite well as volumes are now near the highest level of the year. The Reefer Outbound Tender Volume Index has increased by 7.4% over the past week and is 5.8% higher than it was a month ago. Reefer volumes are up 7.5% year over year, suggesting that the reefer market is firmly out of its freight recession.
Rejection rates rebound, could reach double digits in coming weeks
After a brief decline following the Thanksgiving holiday, tender rejection rates are back on the rise. That is expected given the timing of the holidays and primes the next two weeks for a fairly significant increase, likely pushing double digits as tender rejection rates nearly doubled in the final two weeks in both 2019 and 2023.
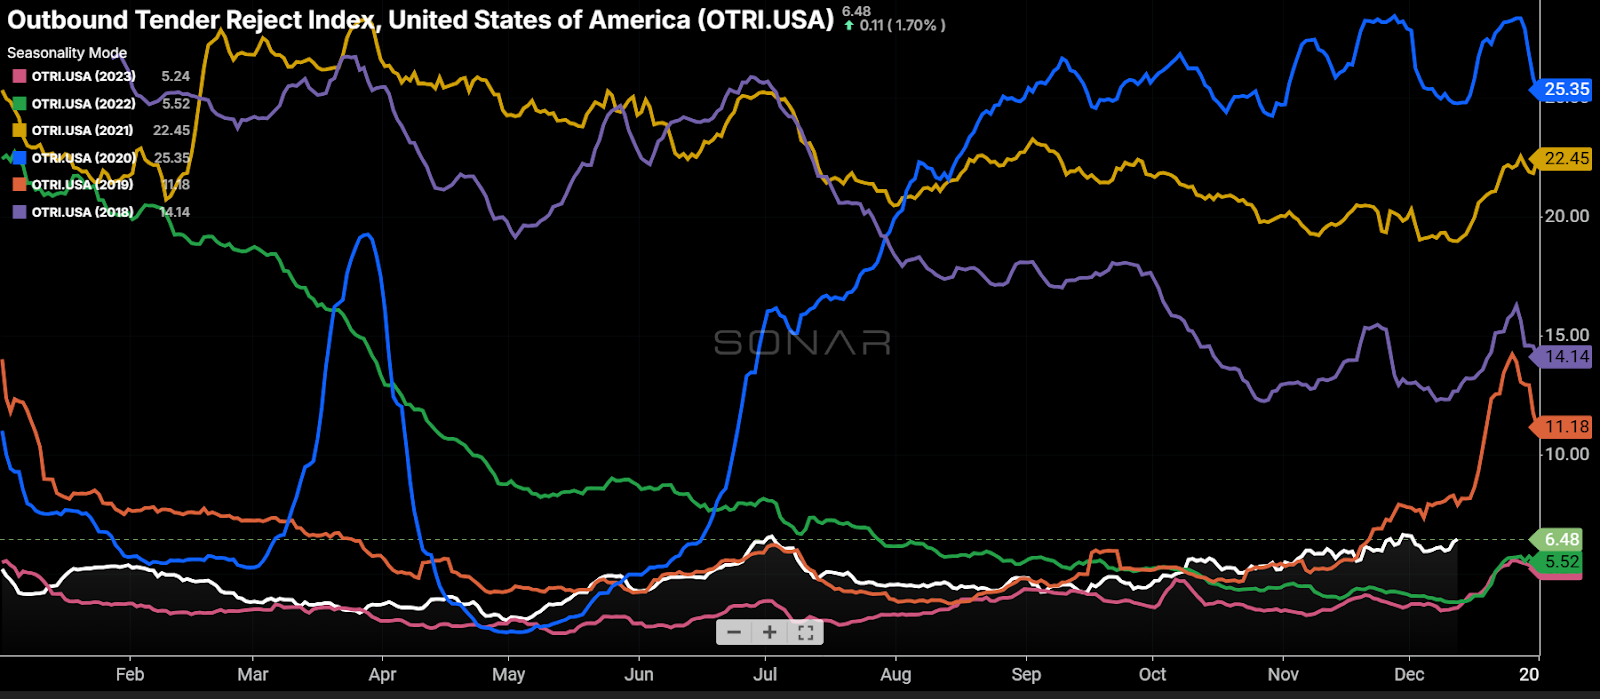
SONAR: Outbound Tender Reject Index – Seasonality View: 2024 (white), 2023 (pink) and 2019 (orange) To learn more about SONAR,click here.
Over the past week, the Outbound Tender Reject Index (OTRI), a measure of relative capacity, rose by 50 basis points to 6.48%. The OTRI is 253 basis points higher than it was this time last year, a sign that the market is tighter now than it was then. While tender rejection rates remain below 2019 levels, the increase in tender rejection rates has been steady as opposed to only around the holidays, which suggests that 2025 is likely to be a tighter environment than the past two years.
SONAR: Outbound Tender Reject Index – Weekly change To learn more about SONAR,click here.
The map above shows the Outbound Tender Reject Index — Weekly Change for the 135 markets across the country. Markets shaded in blue and white are those where tender rejection rates have increased over the past week, whereas those in red have seen rejection rates decline. The bolder the color, the more significant the change.
Of the 135 markets, 88 reported higher rejection rates over the past week, up from the 50 that saw tender rejection rates rise in last week’s report.
The largest increases in rejection rates are stemming from fairly small markets in the Northeast, so not areas of the country that tend to impact the overall freight market. The Harrisburg, Pennsylvania, market, the largest freight market in the Northeast, did see tender rejection rates increase by 195 basis points over the past week.
Tender rejection rates in the Southern California markets of Los Angeles and Ontario increased by 68 basis points over the past week, rising back above 5%, which is an important level for the heartbeat of the U.S. freight economy.
SONAR: Van Outbound Tender Reject Index (white), Reefer Outbound Tender Reject Index (green) and Flatbed Outbound Tender Reject Index (orange) To learn more about SONAR,click here.
By mode: The dry van market is waking up as tender rejection rates have now surpassed Thanksgiving holiday levels, though they are still below the Fourth of July holiday peak. The Van Outbound Tender Reject Index increased by 63 basis points over the past week to 5.87%, less than 100 basis points from the YTD high set July 2. Dry van tender rejection rates are 213 basis points higher than they were this time last year.
The reefer market is still tighter than it was this time last year, but reefer tender rejection rates have retreated over the past week. The Reefer Outbound Tender Reject Index has fallen by 69 basis points over the past week to 14.2%. Compared to this time last year, reefer tender rejection rates are more than double, up 751 bps.
The Federal Open Market Committee meets this week for the final time in 2024, and expectations are for the third consecutive cut to the federal funds rate. The first two interest rate cuts haven’t had a significant impact on the housing market, but flatbed tender rejection rates have moved higher since the first cut. The Flatbed Outbound Tender Reject Index fell by 69 bps over the past week to 12.96%, but even so flatbed rejection rates are 313 bps higher than they were this time last year.
Spot rates rebound to highest level of the year
As the end of the year approaches and capacity is coming off the road, spot rates are continuing to move higher, setting new year-to-date highs seemingly daily. Much of the movement in recent weeks can be attributed to seasonal pressures, but spot rates have largely been moving higher since the beginning of October. There will likely be downward pressure on spot rates at the beginning of 2025, again driven by seasonal pressures, but the higher spot rates move in the next two weeks, the higher the baseline likely to be set to start 2025.
SONAR: SONAR National Truckload Index – Linehaul Only (white, right axis) and Initially Reported Van Contract Rate (green, left axis) To learn more about SONAR,click here.
The National Truckload Index – which includes fuel surcharge and various accessorials – rebounded over the past week, rising 14 cents per mile to $2.52, the highest level of the year. The NTI is now 24 cents per mile higher than it was this time last year.The linehaul variant of the NTI (NTIL) – which excludes fuel surcharges and other accessorials – matched the overall increase in the NTI, rising 14 cents per mile to $1.97. The NTIL is 32 cents per mile higher than it was this time last year, a sign that diesel fuel has put deflationary pressure on all-in spot rates as there is a gap between the y/y increase in the NTI and the NTIL.
Initially reported dry van contract rates, which exclude fuel, have broken out of the high side of the range that they have been in throughout much of 2024. This breakout is likely a result of seasonal pressures, though contract rates have actually been moving higher since the end of the second quarter. The initially reported dry van contract rate comes in at $2.37 per mile, an increase of 3 cents per mile from the previous week and 5 cents per mile y/y.
SONAR: RATES.USA To learn more about SONAR,click here.
The chart above shows the spread between the NTIL and dry van contract rates is trending back to pre-pandemic levels. The spread remains wide, but with the recent stronger positive momentum in spot rates compared to contract rates, the spread has continued to narrow. Over the past week, the spread between contract and spot rates narrowed by 3 cents per mile. It is 22 cents narrower than it was this time last year.
SONAR: SONAR TRAC rate from Los Angeles to Dallas. To learn more about SONAR,click here.
The SONAR Trusted Rate Assessment Consortium spot rate from Los Angeles to Dallas was back on the rise over the past week. The TRAC rate from Los Angeles to Dallas increased by 4 cents per mile to $2.75, erasing some of last week’s decline. Spot rates along this lane are 28 cents per mile above the contract at present, which is why rejection rates out of Los Angeles are on the rise, now above 5%.
SONAR: SONAR TRAC rate from Atlanta to Chicago. To learn more about SONAR,click here.
From Chicago to Atlanta, spot rates have been volatile, but they really haven’t moved significantly since the beginning of November. The TRAC rate for this lane decreased over the past week, falling by 1 cent per mile to $2.69. Spot rates are 9 cents per mile below the contract rate, but that spread is at a level where spot rates offer optionality for carriers and can make the market feel tighter for shippers than it was just a few months ago when the spread was in the 40-cent range.
In a stunning turn of events, California-based trucking company Kal Freight Inc. has filed for Chapter 11 bankruptcy protection, unveiling a web of fraudulent activities that have sent shockwaves through the industry. The company faces serious allegations of financial misconduct and asset mismanagement.
Who is Kal Freight?
According to a filing with the Federal Motor Carrier Safety Administration, Kal Freight employs 600 drivers and has 580 power units. The company was founded in 2014 and has locations in California, Texas, New Jersey, Indiana, Tennessee, Georgia, Arizona and Arkansas.
Chapter 11 and fraud accusations
Kal Freight filed Chapter 11 with nearly $325 million in long-term debt. Unsecured claims total at least $24 million, according to court filings. Among the largest unsecured creditors are CIMC Reefer Trailer Inc., owed more than $12 million; Continental Tire, owed more than $1 million; and Cargo Solution Express, owed more than $950,000.
However, court documents reveal a far more troubling picture of Kal Freight’s operations. Daimler Truck Financial Services USA, LLC, the company’s largest vehicle finance lender, has uncovered evidence of massive fraud perpetrated by Kal Freight against its creditors.
The $16.8 million ghost trailers
In a shocking revelation, Daimler alleges that Kal Freight fraudulently obtained approximately $16.878 million to purchase 164 trailers from Vanguard. However, the company never actually paid Vanguard or received the trailers. Instead, Kal Freight somehow managed to provide Daimler with fraudulent certificates of title for these non-existent trailers, complete with recorded liens. To add insult to injury, Kal Freight continued to make monthly payments on this loan as if the trailers had been purchased and were in their possession.
The $20 million Canadian collateral shuffle
Daimler’s investigation has also uncovered that approximately 366 trailers serving as collateral for their loans were illegally transferred to Big Rig Trailers & Leasing, Inc., a Canadian affiliate of Kal Freight owned by the same individual, Mr. Singh. These trailers were subsequently sold, leased, or pledged to third parties in Canada, potentially creating a complex legal situation where innocent third parties may claim senior interest in the collateral. This unauthorized transfer could result in an additional $20 million loss for Daimler.
The phantom sales scheme
In yet another fraudulent maneuver, Kal Freight reportedly transferred numerous trucks and trailers that were part of Daimler’s collateral to its affiliate, Kal Trailers & Leasing Inc., a truck and trailer dealer. Kal Trailers then sold these units to third parties, allegedly free and clear of Daimler’s liens, under the guise of ordinary business transactions. Daimler never received the proceeds from these unauthorized transfers.
The aftermath and legal proceedings
The extent of Kal Freight’s fraudulent activities has placed the recovery of over $40 million in Daimler loans in serious jeopardy. In light of these revelations, Daimler initially had no interest in continuing its business relationship with Kal Freight during the bankruptcy proceedings.
However, in a bid to salvage the situation, Kal Freight has agreed to remove Mr. Singh as a director of each debtor company and replace him with unaffiliated independent directors. Additionally, the company has promised to retain Brad Sharp as the chief restructuring officer, granting him complete control over business operations, including all books, records and financial transactions.
These commitments have led Daimler to cautiously agree to the debtors’ use of certain retained collateral, consisting of 543 trucks and 10 trailers, during the bankruptcy proceedings. This agreement is subject to strict terms and conditions outlined in the Daimler agreed adequate protection order.
Looking ahead
As the bankruptcy proceedings unfold, all eyes will be on Kal Freight and its newly appointed independent directors and CRO. The trucking industry and creditors alike will be watching closely to see how this complex web of fraud is untangled and what consequences will follow for those involved in these deceptive practices.
Borderlands Mexico: Cyberattacks rise in Mexico as cross-border trade grows
Borderlands is a weekly rundown of developments in the world of United States-Mexico cross-border trucking and trade. This week: Cyberattacks rise in Mexico as cross-border trade grows; California begins construction of second Otay Mesa border port of entry; Yamato Transport launches cross-border trucking service; and Buchanan Capital Partners acquires Texas logistics warehouse.
Cyberattacks rise in Mexico as cross-border trade grows
Mexico has seen a surge in cybercrime, including ransomware, phishing, spoofing and extortion, according to the 2024 report from the LatAm Cyber Summit, and the country’s trade industry is a popular target.
Mexico averages about 298 malware attack attempts per minute, second only to Brazil (1,554 attack attempts per minute) in Latin America, the report said.
The third annual LatAm Cyber Summit took place Nov. 26-27, in Sao Paulo. It examined how organizations can protect themselves against cyberthreats using advanced tools, employee training and national strategies.
The trade industry in Latin America is the third most targeted sector for cyberattacks, accounting for 11% of incidents. Government websites were the most targeted, at 31%, followed by manufacturing, at 12%.
“Brazil and Mexico are particularly appealing for hackers due to the region’s combination of increasing digitization and generalized cybersecurity immaturity,” the LatAm Cyber Summit report said.
Hackers and cybercriminals from China, Russia and North Korea accounted for more than 77% of phishing activity in Mexico since 2020, according to a Google report released in September.
(Source: Google)
Phishing schemes are scams designed to trick users into giving information to criminals that they shouldn’t have access to.
“Extortion operations, including ransomware, multifaceted ransomware, and extortion, continue to affect organizations across regions and industries, including Mexico, leading to significant financial losses and business disruption,” the Google report stated.
The rise in cyberthreats arrives as Mexico continues to be the top trading partner of the U.S.
For the month of October, Mexico’s trade with the U.S. totaled $74.6 billion, a 2.8% increase from the same month in 2023.
It was the 10th consecutive month and 20th of the past 21 months that Mexico has been No. 1 in trade with the U.S.
Canada ranked No. 2 for trade with the U.S. at $64.3 billion in October, while China was third at $55 billion.
Mexico’s trade with the United States totaled $706.9 billion from January through October, followed by Canada at $637.1 billion, while U.S. trade with China totaled $269.2 billion.
The Port of Los Angeles was the No. 1 U.S. trade gateway in October among the nation’s 450 airports, seaports and border crossings, according to Census Bureau data analyzed by WorldCity.
The Port of Los Angeles totaled $31 billion in commerce in October, followed by Laredo, Texas, at $30.5 billion in trade and Chicago O’Hare International Airport at $29.9 billion.
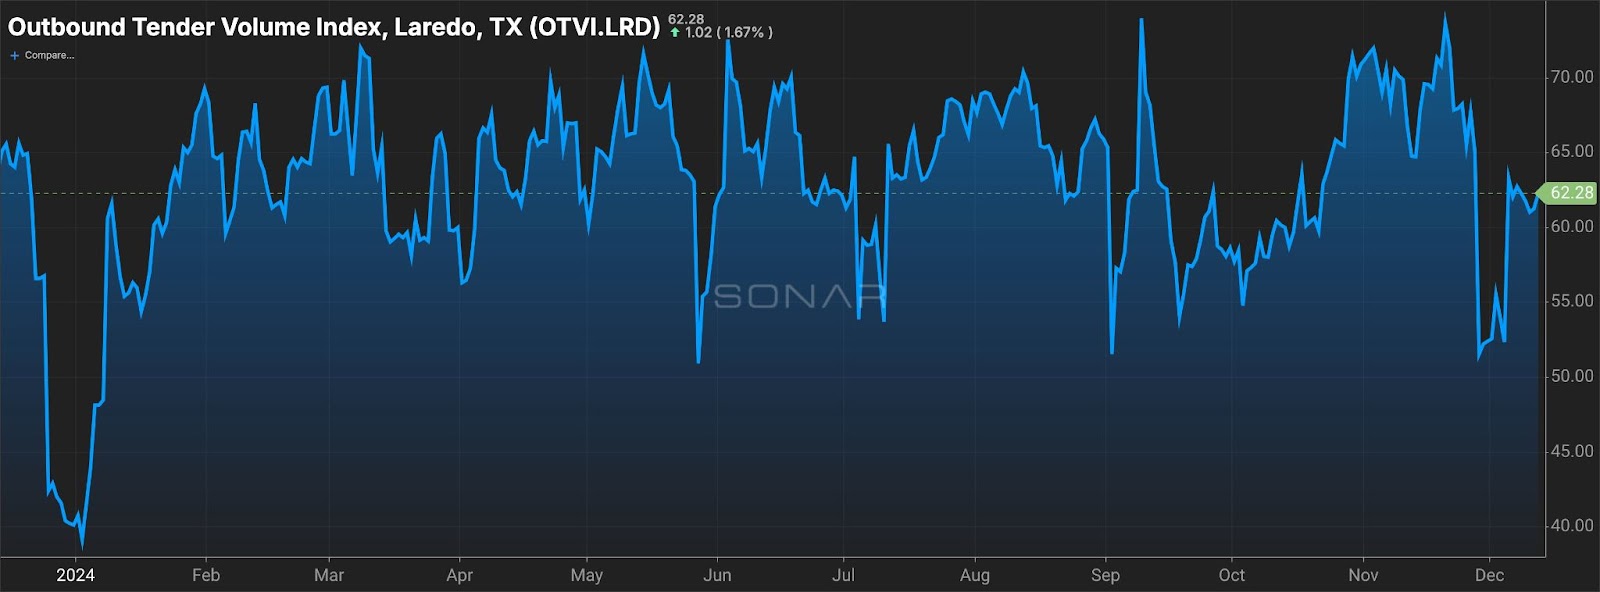
As of Dec. 13, outbound truck volumes out of Laredo were up about 20% since the end of November but down about 3% week over week, according to the SONAR Outbound Tender Volume Index (OTVI.LRD).
SONAR’s Outbound Tender Volume Index for Laredo, Texas, (OTVI.LRD) shows trucking volumes falling at the end of November, then rising since Dec. 5 . To learn more about SONAR, click here.
California begins construction of second Otay Mesa border port of entry
California has launched construction on the Otay Mesa East-Otay II border crossing, which will be just south of San Diego.
Otay Mesa East-Otay II will develop a new U.S.-Mexico border port of entry 3 miles east of the original Otay Mesa port of entry. It will include 10 lanes: five for passenger vehicles and five for cargo transport. More than $1 billion has already been earmarked for construction.
“This new port-of-entry will strengthen California’s world-leading economy, create jobs, and support regional communities through trade,” California Gov. Gavin Newsom said in a news release. “California is proving that we can build strong international partnerships with Mexico — our top trading partner — to grow our economy and create jobs while prioritizing the safety and well-being of our communities.”
Mexico is California’s top export market, purchasing $33.3 billion worth of California products annually. Mexico is also California’s second-largest source of imports — totaling $61.5 billion worth of goods annually.
The Otay Mesa East-Otay II project is scheduled to be completed in 2027.
Yamato Transport launches cross-border trucking service
Yamato Transport has created a cross-border trucking service utilizing bonded transfer between airports in the U.S. and Mexico.
The service aims to eliminate the need for customs clearance procedures at the U.S.-Mexico border, the company said in a news release. Customs clearance will be handled at the destination airport.
“By reducing the turnaround time for customs procedures, this service enables fast and highly punctual cross-border transportation, supporting customers to establish optimal supply chains tailored to diverse needs,” Yamato Transport said.
The bonded trucking service was launched Thursday and links airports in Dallas, Chicago and Atlanta with Mexican airports in Monterrey, Guadalajara and Mexico City.
The service operates three to five times per week on each route and is able to accommodate charter transportation by container or consolidated transportation by pallet.
Tokyo-based Yamato Transport is a global shipping, freight forwarding and logistics company operating in 23 countries.
Buchanan Capital Partners acquires Texas logistics warehouse
Austin, Texas-based Buchanan Capital Partners (BCP) has acquired a 72,868-square-foot industrial warehouse in Laredo, Texas.
The acquisition enhances BCP’s presence in a key growth market driven by strong industrial demand, company officials said.
“With infill industrial submarkets experiencing historically high occupancy rates driven by strong leasing demand, we believe this acquisition is an ideal profile fit for our investors as consistent occupancy mitigates downside risk,” Keith Buchanan, founder of BCP, said in a news release.
The warehouse is in the San Isidro Industrial Park, near Laredo’s World Trade Bridge.
Buchanan Capital Partners is a commercial real estate investment firm.
Rising rejection rates amid demand drop reveal truckload capacity exodus
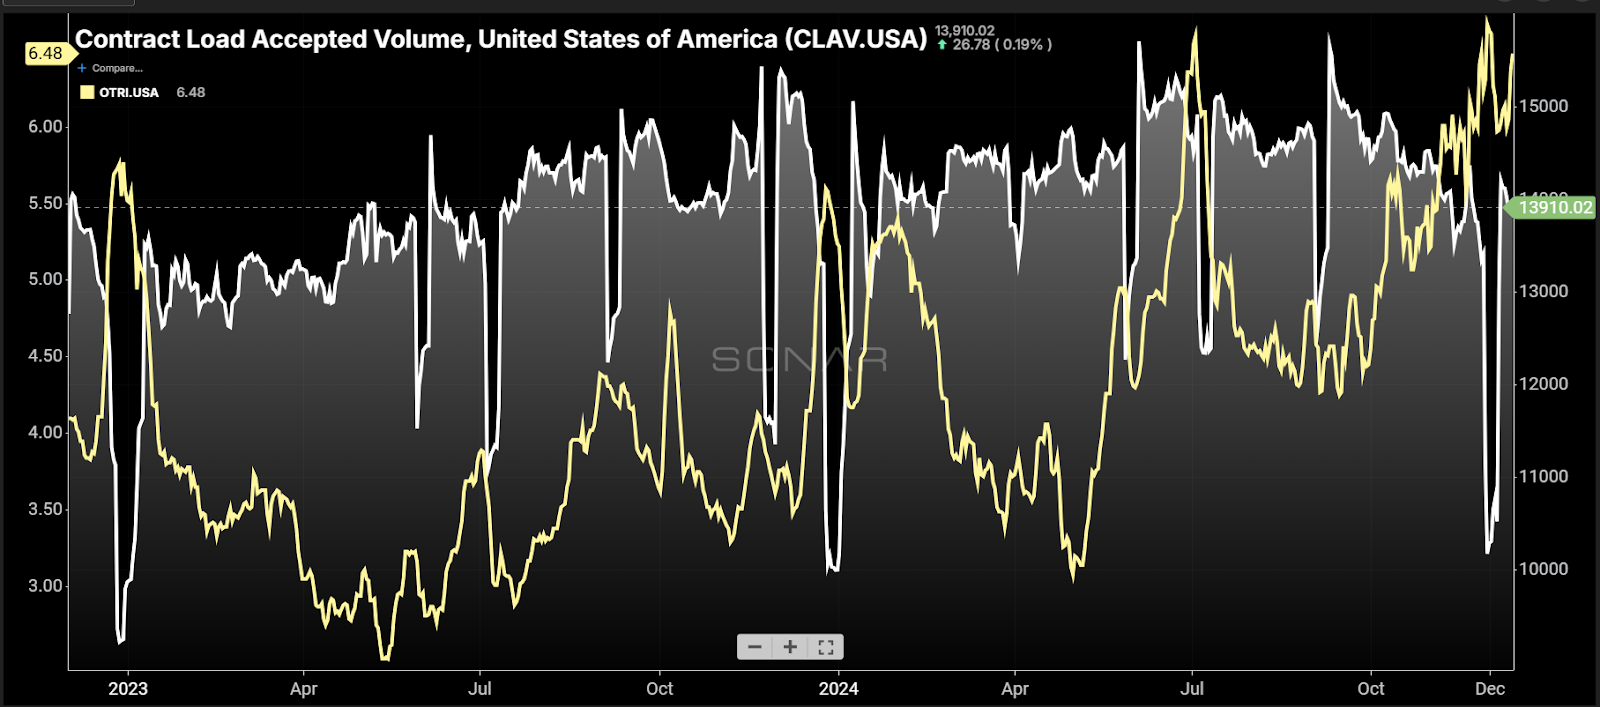
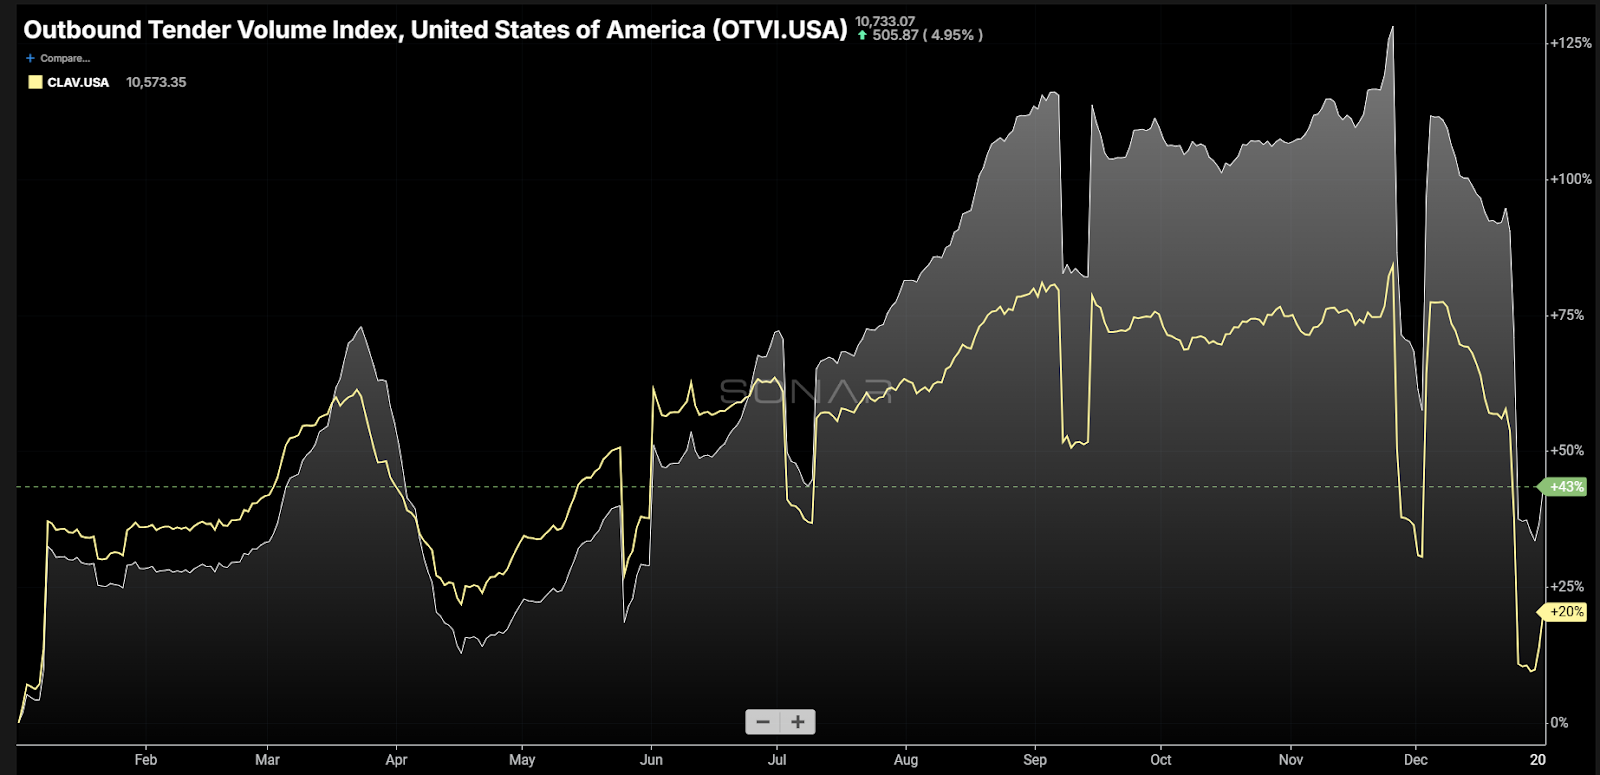
Chart of the Week: Contract Load Accepted Volume Index, Outbound Tender Volume Index – USA SONAR: CLAV.USA, OTRI.USA
Carriers are accepting the same load volumes that they were in April 2023, near the theoretical floor of the freight market’s recent recessionary period. Rejection rates (the rate at which carriers turn down load coverage requests from contracted shippers) are more than double what they were at the time. This is further evidence that a significant amount of supply has left and is continuing to leave the domestic truckload market.
The Contract Load Accepted Volume index (CLAV) is a measure of accepted load tenders from shipper to carrier. It differs from SONAR’s Outbound Tender Volume Index (OTVI) in that it does not count tenders that carriers rejected. More rejections mean it is more challenging to procure truckload capacity. When comparing the Outbound Tender Reject Index (OTRI) to the CLAV, we can approximate how balanced the supply and demand curve is in the truckload market by looking at periods of similar accepted volumes and comparing rejection rates at those times.
In May 2023, the CLAV had a value of 13,951 while the OTRI was 2.92% – basically carriers were automatically accepting loads without discrimination. Last Thursday, the CLAV was at 13,910 while the OTRI hit 6.48%. While not all loads are created equal, the average lengths of haul were also similar between the two periods. Seasonality is a factor, but the trends are the main tell.
Accepted volumes trended lower from early September until November before flattening. Rejection rates have been increasing since early October, rising from about 4.5% on Sept. 29 to 6.5% on Dec. 12.
This rise is more than your typical seasonal spike driven by holiday capacity reduction. The only year that rejection rates increased steadily during this period was 2019. In every other year outside 2019 and the current one, rejection rates are either flat or declining heading into the Thanksgiving period.
Looking at the historical OTRI figures from the past seven years, a downward trend is present in most. This aligns with a bit of a slide in demand coming out of the Labor Day weekend surge.
Still missing from the current year’s OTRI is the Thanksgiving week spike, which has been muted the past three years. But the upward trend in rejections is a new development, especially considering it does not appear to be driven by a demand-side event.
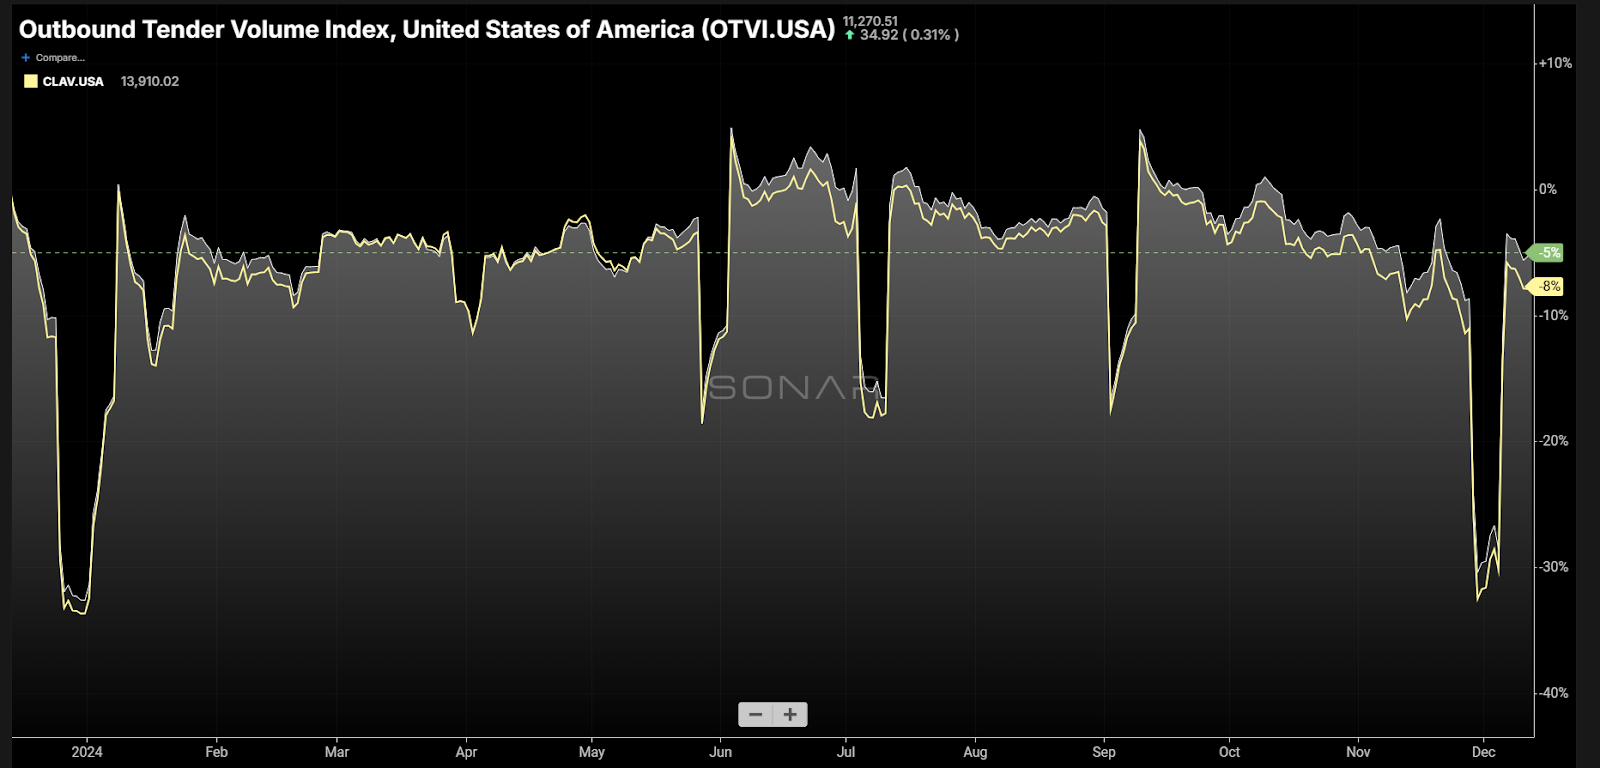
Comparing the OTVI (total tenders) and CLAV (accepted tenders) over the past year, the gap is steadily growing. This is the result of less availability of trucking capacity. The gap is represented by the OTRI. The interesting part is that both CLAV and OTVI are falling. Most people familiar with transportation markets would think a transitioning market would have a flat to slowly growing CLAV and an increasing OTVI, which is what happened in 2020 as seen below.
This is a very telling detail that capacity is eroding at an incredibly fast clip. That is difficult to measure with traditional figures.
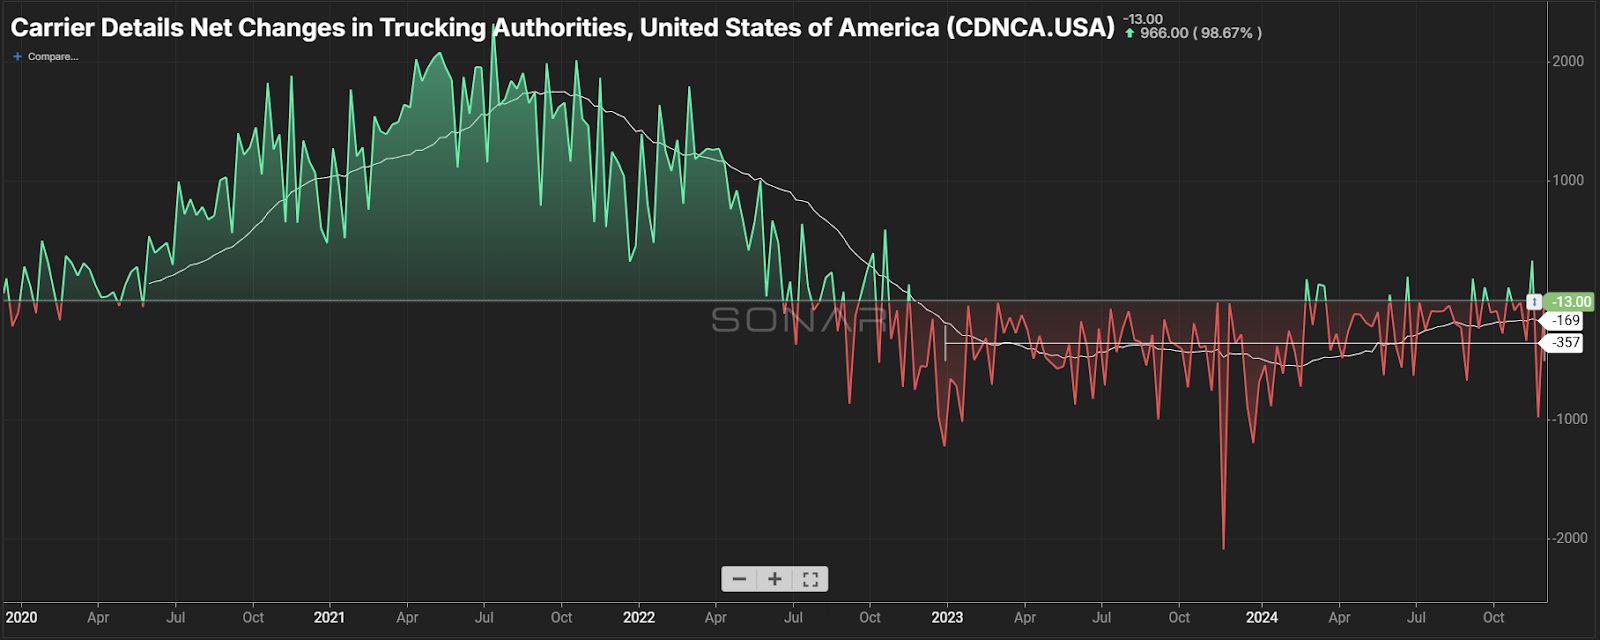
Carrier Details puts an extra layer of cleaning on Federal Motor Carrier Safety Administration data to get to its net changes (revocations plus additions) in active operating authorities that are reported weekly. This data would suggest there is a slowing of the erosion, but it does not account for size of fleets or the removal of tractors from ongoing operations. It is still a good measure of market conditions and health. Anytime it is negative, conditions are extremely challenging for carriers. It is rarely in this state for long periods of time as it biases toward growth. The two years of averaging more than 350 net carrier exits a week is historic and has never been seen.
The bottom line is that the exodus of capacity is finally showing up in the form of sustainably higher rejection rates. There is certainly a level of seasonal pressure on the market at the moment that was not present in May 2023, but the difference is not straight seasonality. Rejection and spot rates may slide after the holidays, but it should not be taken as a snapback moment.
About the Chart of the Week
The FreightWaves Chart of the Week is a chart selection from SONAR that provides an interesting data point to describe the state of the freight markets. A chart is chosen from thousands of potential charts on SONAR to help participants visualize the freight market in real time. Each week a Market Expert will post a chart, along with commentary, live on the front page. After that, the Chart of the Week will be archived on FreightWaves.com for future reference.
SONAR aggregates data from hundreds of sources, presenting the data in charts and maps and providing commentary on what freight market experts want to know about the industry in real time.
The FreightWaves data science and product teams are releasing new datasets each week and enhancing the client experience.
Question over ability of California to be granted environmental waivers headed to SCOTUS
California’s zero emission regulations impacting trucking will be in the background as the Supreme Court takes up the question of the ability of the federal government to issue a waiver that allows the Golden State to implement tougher environmental rules than the rest of the country.
The Court Friday agreed to grant certiorari of an appeal from Diamond Alternative Energy. Diamond is the biofuels arm of Valero Energy (NYSE: VLO), the large independent refining company that has operations in California.
Diamond had lost earlier court challenges while fighting the granting of a waiver to California to implement its Advanced Clean Car (ACC) rule. Like the Advanced Clean Truck Rule and the Advanced Clean Fleet rule, the ACC has rules requiring a gradual phase out of new sales of automobiles with internal combustion engines.
Advanced Clean Trucks received a waiver from the Environmental Protection Agency in March 2023. At its most basic regulation, ACT requires that OEMs sell a growing percentage of zero emission vehicles into the state as a percentage of all sales in California.
While the state awaits the fate of that waiver, the ACF, which legally went into effect Jan. 1, is not being enforced. Its most prominent regulation that would have kicked in this year was the requirement that only ZEVs be allowed new registrations with the state for California’s drayage operations at its ports. Other rules would be introduced over time.
The waiver for the ACC rule that is at the heart of the case that will now go before the nine justices was first granted in 2013. But the portion of the waiver that dealt with ZEVs was withdrawn by the EPA in 2019 under the Trump administration. Three years later, under the Biden administration, it was reimplemented.
Diamond/Valero filed suit against that action in the District of Columbia Circuit Court, where it lost. The DC decision was based in part on the question of redressability, which would require Diamond/Valero to show that the court could counter damages the company said it would suffer as a result of ACC.
As to the issue of whether the decision to grant the ACC waiver was appropriate within the waiver power of the original Clean Air Act where it was first established, the federal government, in its brief objecting to Diamond/Valero’s request for certiorari, noted that “numerous waivers have been reviewed by courts on merits.”
A decision overturning the waiver provisions of the Clean Air Act could threaten not just the ACC but also the ACT and the ACF. And the resolution of that question has drawn interest far beyond California because of the fact that the sheer size of California can work to indirectly make the state’s standards the de facto national standard, since OEMs want to avoid building two cars or two trucks, one for California and one for the rest of the country.
Carrier Revenge: The freight market’s impending power shift
In the ever-evolving landscape of the freight industry, a new phenomenon is emerging that threatens to upend the delicate balance between shippers and carriers. Known as “carrier revenge,” this impending shift in market dynamics promises to reshape how goods are transported across the nation.
The Great Freight Recession: Setting the stage
For the past two years, shippers have enjoyed unprecedented leverage in the freight market. Excess capacity has kept rates under significant pressure, leading to what some industry experts have dubbed “shippers’ revenge.” This period has seen truckload spot rates, when adjusted for inflation, plummet to lows not witnessed since 2009.
During the early stages of the Great Freight Recession, contract rates remained stubbornly high as shippers cautiously monitored the market, uncertain whether this reset was a temporary blip or a more substantial shift. However, by the first quarter of 2023, it became clear that the recession was not a fleeting phenomenon. Consequently, shippers began to demand significant rate concessions from carriers, a trend that only accelerated as the year progressed.
The Pendulum Swings: Signs of Market Recovery
Despite the prolonged downturn, recent data suggests that the Great Freight Recession is drawing to a close. Key indicators point to a market turnaround:
Rising tender rejections: Tender rejections have climbed to over 6%, indicating a tightening market where carriers can be more selective about the loads they accept.
Increasing spot rates: Spot rates are on the rise, surpassing those of 2022 and 2023. This trend suggests either a surge in demand or a decrease in available capacity, possibly both.
Decreasing capacity: The implementation of the FMCSA’s Clearinghouse-II regulations in November 2024 could potentially sideline 177,000 truck drivers, further tightening the market.
The looming threat of carrier revenge
As the market pendulum swings back in favor of carriers, the stage is set for “carrier revenge.” This concept implies that after enduring a period of low rates and intense competition, carriers may soon be in a position to leverage their newfound power. The implications for shippers could be significant:
Higher freight rates: As capacity tightens and demand increases, carriers may have the upper hand in negotiating higher rates.
Selective load acceptance: Carriers may become more discerning about which loads they accept, potentially disrupting shippers’ established routing guides.
Reduced flexibility: Shippers who have grown accustomed to the abundance of available capacity may find themselves struggling to secure transportation for their goods.
Factors amplifying the shift
Several factors are converging to accelerate this power shift:
Political influence: Potential policy changes following the recent election could stimulate economic activity, increasing freight demand.
Immigration policies: Stricter immigration enforcement could impact the trucking workforce, potentially removing a portion of the industry’s capacity.
Regulatory changes: The implementation of new regulations, such as the Clearinghouse-II rules, could further constrain the available driver pool.
Preparing for the new reality
As the freight market enters this new phase, shippers must adapt their strategies to mitigate risks:
Lock in rates: Consider securing longer-term contracts to protect against sudden rate spikes.
Diversify carrier base: Expand relationships with multiple carriers to ensure access to capacity.
Optimize operations: Streamline loading and unloading processes to make your freight more attractive to carriers.
Leverage technology: Utilize real-time market data and analytics like SONAR to stay ahead of market trends and make informed decisions.
Conclusion
The concept of “carrier revenge” serves as a stark reminder of the cyclical nature of the freight market. As the industry emerges from the Great Freight Recession, the balance of power is poised to shift dramatically. Shippers who recognize this changing tide and adapt accordingly will be best positioned to navigate the challenges ahead. In the world of freight, as in many aspects of business, preparedness and flexibility are key to long-term success.
Truckload dry-van market continues to experience strong response to peak season
The SONAR National Truckload Index (NTI) has reached levels not seen in nearly two years, surging from $2.38 per mile to $2.52. The last time truckload spot rates were this high was on Jan. 23, 2023.
SONAR: National Truckload Index, 7-Day Average. To learn more about SONAR, click here.
SONAR Outbound tender rejection rates increased 63 basis points week over week from 5.24% on Dec. 5 to 5.87%, its highest point since July 8 of this year.
Interestingly, the strong peak response comes even as dry van outbound tender volumes exhibit a year-over-year decline, suggesting these improvements may be driven by capacity factors.
Dry van outbound tender volumes are down 625.6 points or 7.32% at 7,926.19 points compared to the same period last year when VOTVI registered at 8,551.79 points.
While not directly comparable, there were 14,444 fewer trucking authorities as of Friday, with a total of 344,541 active trucking authorities according to SONAR Carrier Details Total Trucking Authorities data (CDTTA).
This reflects a 4% decrease from the 358,985 authorities reported on Dec. 15, 2023, the nearest record for a year-over-year comparison.
Tighter conditions in spite of lower volumes suggests any volume surge in 2025 could create challenges for shippers in finding capacity. Shippers would be well advised to lock in contract rates, even at higher levels, just to secure capacity. If Trump’s policies create significant economic stimulus, the freight market could see a significant demand surge. This would be bad news for shippers, as carriers could inflict carrier revenge on shippers that have been difficult to deal with.
Labor warns Alabama port authority seeks ‘back door’ to automation
A labor union is warning regulators that the federal government would be subsidizing future job cuts as well as a drive toward freight automation if a Buy America waiver sought by the Alabama State Port Authority (ASPA) is approved.
ASPA told the Federal Railroad Administration that the waiver is necessary in order to purchase two rubber-tired gantry cranes that it wants to install at its planned intermodal container transfer facility (ICTF) in Montgomery, Alabama.
Projects that receive funding under FRA’s Consolidated Rail Infrastructure and Safety Improvements (CRISI) program must adhere to the agency’s Buy America requirements, which means the steel, iron and manufactured goods used in the project must be produced in the U.S. ASPA received a $67.3 million CRISI grant for the ICTF in 2022.
However, “due to the lack of responsive bids from domestic manufacturers and based on its market research, ASPA has concluded that cranes that meet FRA’s Buy America requirements are not domestically available,” according to FRA.
“In the absence of a waiver, ASPA asserts that it would not be able to deliver the project, as planned operations are not possible without two rubber-tired gantry cranes meeting ASPA’s technical specifications.”
FRA issued a preliminary determination in November finding that ASPA qualifies for the waiver, and invited public comments.
Greg Regan, president of the Transportation Trades Department (TTD), which represents railroad employees, argued in response that because ASPA’s bid request stipulates that the cranes allow for future conversion to remote operations, a waiver “may serve as a back door to securing federal funding for a huge share of the cost of equipment that will eventually be converted to semi-automated or automated functions.”
“Put simply, this strategy, if successful, would incentivize procurements that operators would not have made without the government’s intervention. In other words, the federal government would be subsidizing the near-future elimination of jobs.”
The Montgomery ICTF is a major component of ASPA’s growth plans. It will extend intermodal rail service on CSX (NASDAQ: CSX) from ASPA’s container terminal at the Port of Mobile while reducing container storage congestion at the port and decreasing truck traffic on Interstate 65.
“This project will provide our shippers cost-competitive transportation services to and from one of the nation’s fastest growth containerized cargo gateways,” said ASPA CEO John Driscoll.
ASPA’s alleged drive toward automation has also faced backlash from dockworkers. The International Longshoremen’s Association (ILA) initially broke off contract negotiations with employers in June 2024 after discovering that APM Terminals and Maersk Line were using an automated system to process trucks at the Port of Mobile.
A contract extension was agreed to after a three-day strike in October, but that’s set to expire on Jan. 15 – with the two sides deadlocked over the use of automation at the ports.
Support from President-elect Donald Trump, who sided with the ILA Thursday while railing against port automation, may have boosted the union’s chances for a deal that keeps automation off the docks.