


East Coast ports continue to rack up wins versus West Coast rivals. Port announcements in recent days highlight just how much ground the East Coast has gained during the pandemic era.
The latest stats also reveal that the sequential month-on-month volume slide from the pandemic peak may be slowing, even at some of the hardest hit ports on the West Coast.
Month-on-month numbers improving
The Port of Los Angeles reported Thursday that it handled 352,046 twenty-foot equivalent units of loaded imports in December. That’s down 9% year on year and down 6% from December 2019, pre-COVID. But on a positive note, it’s up 15% from November to the highest monthly total since August.
The port told FreightWaves that December’s bounce was driven by cargoes brought in prior to China’s Lunar New Year, as well as comparisons to a weak November, which was weighed by earlier-than-usual timing for Christmas imports.
The supply chain crunch was in full force 12 months ago, so virtually all U.S. ports are showing double-digit year-on-year drops due to “tough comps.” However, as with Los Angeles, the month-on-month numbers are showing improvements after steeper falls in September-November.
Loaded imports to the Port of Charleston were up 5% in December versus November. Imports to the Port of Virginia were up 2%. Savannah, Georgia, was flat (down 0.7%). Seattle/Tacoma in Washington was down only 2%.
Comparisons vs. pre-COVID favor East Coast
Three-year comparisons underscore the divergence between the coasts even as the U.S. as a whole reverts to pre-COVID levels.
Charleston’s December imports were up 28% versus December 2019, pre-COVID. Savannah’s were up 26% and Virginia’s 21%. In stark contrast, combined imports in Los Angeles and Long Beach were down 15% in December versus three years ago, Oakland was down 19% and Seattle/Tacoma 20%.

According to John McCown, publisher of The McCown Report, December’s combined imports at the top 10 U.S. ports were roughly flat versus pre-COVID, growing at a compound annual growth rate (CAGR) of 0.4% over the prior three years. The West Coast three-year CAGR was minus 5.6% over the same period. The East/Gulf Coast CAGR was 6.6%.
“December was the 19th straight month where the year-over-year percent change in volume at East/Gulf Coast ports outperformed West Coast ports,” wrote McCown.
Top ports on the East and Gulf coasts handled 54.9% of inbound volume last month, with the West Coast share down to 45.1%, according to McCown. Pre-pandemic, those shares were reversed, with the West Coast handling about 55% — although even then, volumes were shifting eastward as a result of the expanded Panama Canal.
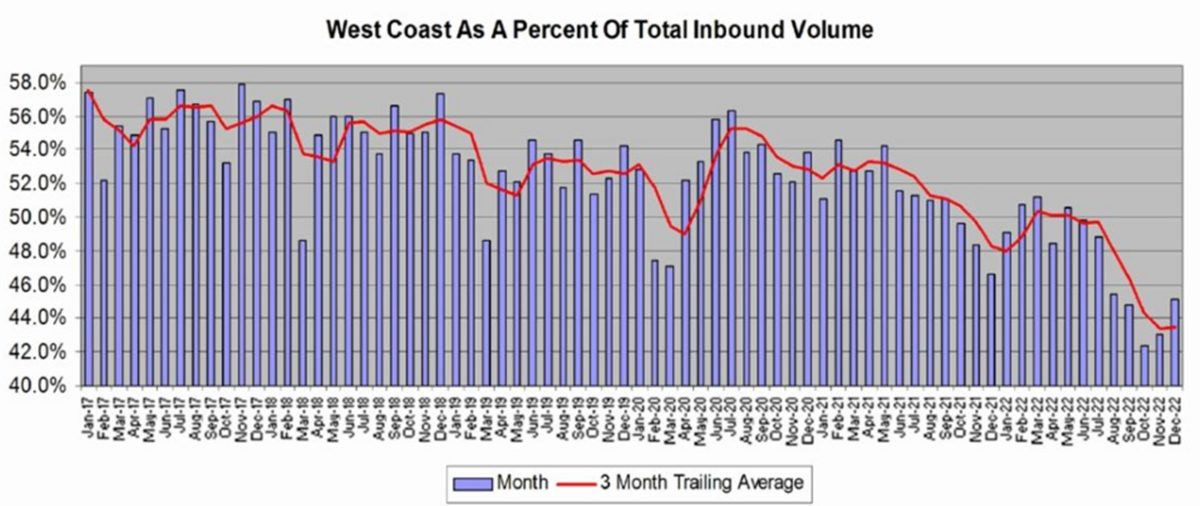
Adding to pre-COVID gains
McCown tracks the three-month trailing average of the year-on-year changes for the top ports on each coast. This data shows how coastal momentum has changed over time.
The expanded canal opened in June 2016 and carriers began adjusting services to take advantage of the new transit capacity in 2017. The East and Gulf coasts began outpacing West Coast growth in 2017, with the gap widening in 2019.
There was a shift in the other direction in the first phase of the pandemic import surge: West Coast import growth jumped back ahead as carriers favored the shorter transit time from Asia. West Coast momentum peaked in spring 2021.

But Los Angeles and Long Beach suffered heavy congestion in late 2021 and early 2022, pushing volumes eastward yet again. That trend was further fueled by uncertainty over the West Coast port labor contract, which expired on July 1, 2022. Almost seven months later, a new contract has yet to be signed.
“Since mid-2021 there has been a more pronounced move away from the West Coast as shippers redirected container routings,” said McCown. “Initially this was to minimize the effect of congestion delays. More recently, this related to concern of disruption from potential labor unrest.”

Click for more articles by Greg Miller
Related articles:
- ‘Surge finally over,’ US imports back near pre-pandemic levels
- Coast is (almost) clear as port congestion fades even further
- Top 10 container lines: How did rankings change during boom?
- Chance that container ship arrives on time is still a coin toss
- Container shipping’s ‘big unwind’: Spot rates near pre-COVID levels
- LA/LB imports drop double digits; slump predicted through spring
