
Last Week’s Pricing Power Index: 35 (Shippers)
The trucking industry operates in a market based on real-time demand and supply. When demand is higher than capacity, carriers gain negotiating power for rates. When supply is higher than demand, shippers gain negotiating power for rates.
FreightWaves’ Pricing Power Index uses the analytics and data contained in SONAR to analyze the market and estimate the negotiating power for rates between shippers and carriers.
The Pricing Power Index is based on the following indicators:
Load Volumes: Momentum and Trend Positive for Carriers.
The Outbound Tender Volume Index (OTVI.USA) is currently at 10,433.29, which is 7.13% higher than this time last year to close out the third quarter. OTVI.USA has been trending upwards since mid-July, when the index first crossed above strong 2018 levels. Without being overly pessimistic, we think the recent sharp acceleration in OTVI.USA to over 7% year-over-year is being significantly influenced by easy comparisons because the index saw a big drop in late September and early October as the hot 2018 freight market began to cool. These levels may top out soon as economic indicators over the past 60 days have shown signs of a weakening economy (more on this in the Economic Stats section below).
SONAR: OTVI.USA
Tender Rejections: Trend and Absolute Levels Positive for Shippers, Momentum Positive for Carriers.
Outbound Tender Rejections (OTRI.USA) are currently at 5.2%, which is down from 5.26% last week as over-capacity in the trucking market continues to push down rejections and line-haul rates. While tendered load volumes are 7.13% higher year-over-year, OTRI.USA is still down 70% compared to October 2018.
While we do not expect OTRI.USA to reach its 2018 highs any time soon, high single-digit rejection rates of 8% to 10% would be viewed as positive for carriers and a return to a more normal trucking market.
SONAR: OTRI.USA
New Tractor Orders: Long-Term Momentum Positive for Carriers.
New Class 8 truck orders are currently running at an annualized pace of 150,000 in 2019. This is down 70% from 2018’s record level and 125,000 trucks below our estimate for replacement demand. Relative to capacity of 2.3 million total tractors in the U.S. (including private fleets), this suggests that over 5% of capacity is exiting the market. The latter is confirmed by four- and five-year-old used truck prices falling for the first time in several years in August (SONAR: UT4.USA; UT5USA), which were down approximately 2% year-over-year. Three-year-old used truck prices are on the verge of decreasing year-over-year but are still slightly positive. Adding all this together suggests contracting capacity into 2020 at a time when outbound volumes are running up 7% year-over-year.
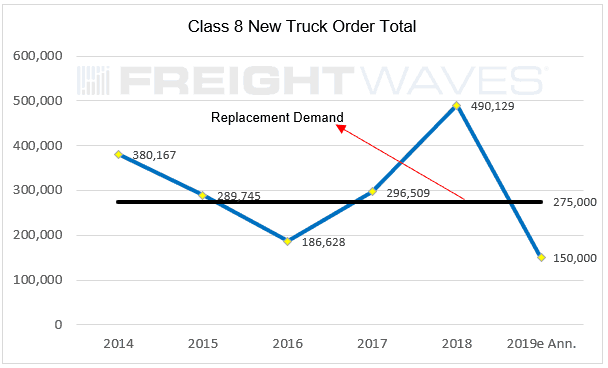
ARTICLE: New truck orders running below replacement demand should boost carrier profits in 2020
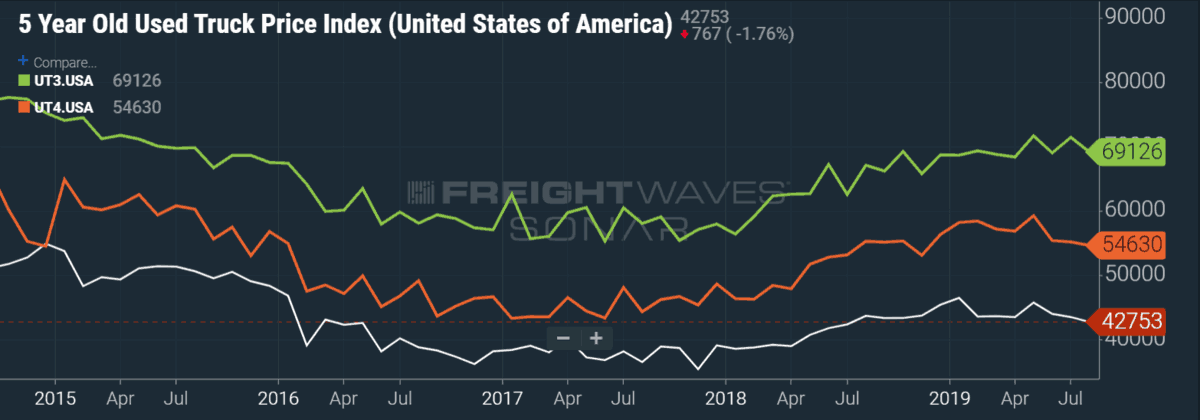
SONAR: UT3.USA, UT4.USA, UT5.USA
Paper and Spot Rates: Short-Term Positive for Shippers, Momentum Positive for Carriers.
DAT National Van Spot Rates (DATVF.VNU) dropped from $1.44 to $1.42 per mile, or 165 basis points. DAT spot rates are down 16.25% year-over-year when rates were above $1.70 per mile.
According to the August Producer Price Index for Long Haul Trucking, paper (contract) rates posted the first negative year-over-year numbers since early 2016. Spot rates should start climbing year-over-year as shippers move more freight into the spot market to capture cost reductions. As part of this process, shippers will also become more aggressive in rebidding paper rates. Both of these actions should narrow the spread between the two as paper rates are repriced to reflect spot market rates.
This is likely a sign of the trough in the market for this cycle. Of course, this is with the caveat that there isn’t a recession lurking around the corner.
Rail Data: Momentum and Trend Positive for Shippers
Rail volumes decreased 7.2% year-over-year this week, deteriorating and accelerating to downside compared to the four-week moving average of -6.4% and the year-to-date weekly average of -3.9%. Intermodal volumes, which compete with truckload, fell 6.9% year-over-year this week and also deteriorated compared to the four-week moving average of -5.9% and the year-to-date weekly average of -4.1%. In our opinion, this is a cautious signal for future truckload spot prices, given such weak intermodal volumes are likely to weigh on intermodal pricing and thus cause that mode of transportation to appear increasingly more attractive to shippers from an economic perspective.
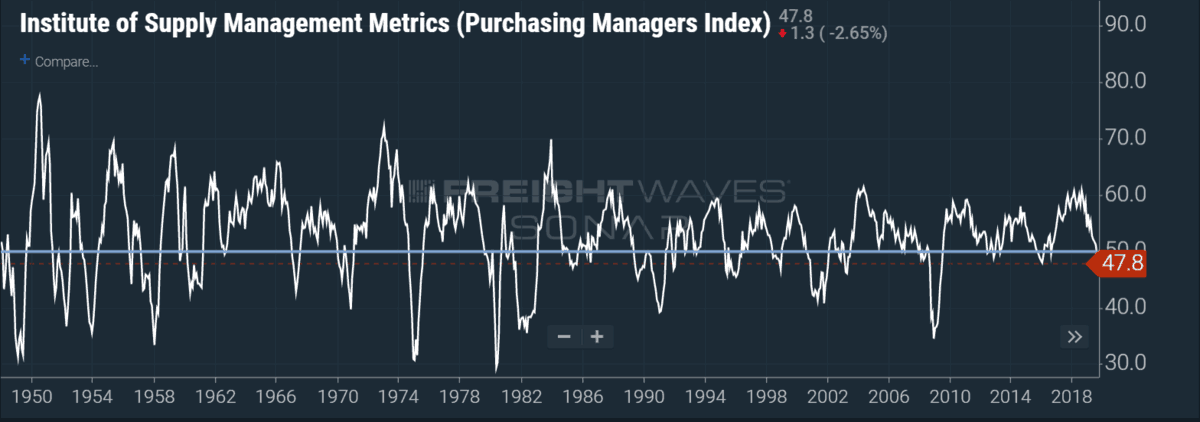
Economic Stats: Positive Momentum for Shippers.
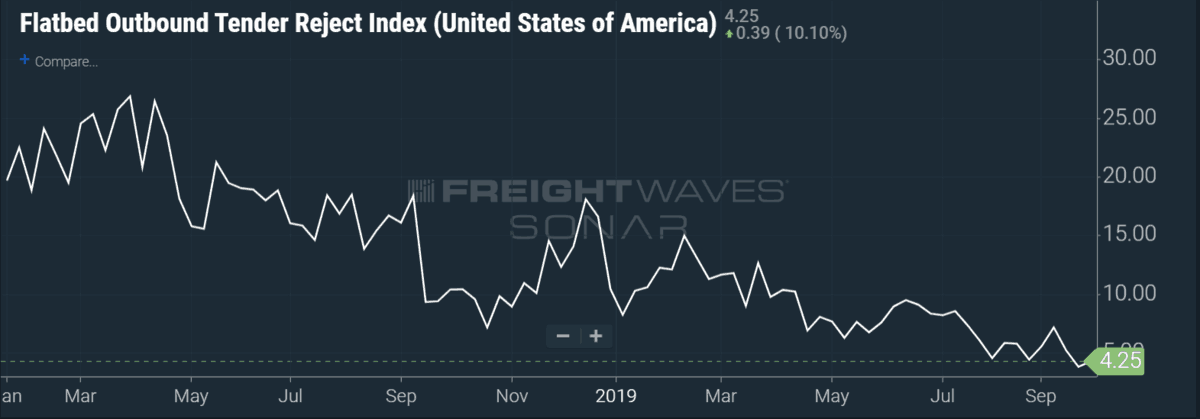
The September ISM Manufacturing Index dropped to 47.8 in September from 49.1 in August. This is the second straight month that the index has posted a reading below 50, signifying contraction. Further, September’s 47.8 reading was the worst showing in over 10 years (since June 2009). Perhaps more alarming is the fact that the ISM Manufacturing Index has fallen in virtually a straight line from the recent high of 60.8 in August 2018. This is a clear demonstration that the manufacturing and industrial sectors of the economy have likely tipped into recession. While manufacturing only represents 12% of U.S. GDP today, this has obvious negative implications for future freight volumes and rates, particularly in the more economically sensitive flatbed market where tender rejections are tracking at an all-time low of 4.25% (since the two-year inception of our data series) in SONAR.
ADP’s National Employment Report posted nonfarm private payroll growth of 135,000 jobs in September, which beat muted consensus expectations of 125,000. However, while that figure appears encouraging at first blush, U.S. private payrolls are tracking at a three-month average of 145,000 per month compared to 214,000 for the same time period in 2018, implying the nation is adding about one-third fewer jobs per month right now than in 2018. Per the Wall Street Journal, Moody’s chief economist Mark Zandi says that if hiring slows any further, the unemployment rate will begin to rise from a multi-decade low.
The stock market has responded to the weak economic data in kind, falling almost 4% over the past week while bond yields moved lower in a flight to safety. Moreover, the market odds of another Fed rate cut this year rose to 86% Wednesday, up from 73% a week ago, according to the Chicago Mercantile Exchange odds. Taken together, the deteriorating economic backdrop gaining momentum is a definite positive for shippers.
Three-Month Pricing Power Index Outlook: 55 (Carriers)
For more information on the FreightWaves Freight Intel Group, please contact Kevin Hill at khill@www.freightwaves.com, Seth Holm at sholm@www.freightwaves.com, or Andrew Cox at acox@www.freightwaves.com.
Supply Chain AI Symposium
Past the hype. Join operators, founders, and enterprise leaders figuring out how to deploy AI in supply chain.
F3: Future of Freight Festival
Industry-defining keynotes, rapid-fire technology demos, and industry leaders networking in experiences across Chattanooga - plus the inaugural F3 Awards Dinner featuring the FreightTech and Shipper of Choice reveals.
Past the hype. Join operators, founders, and enterprise leaders figuring out how to deploy AI in supply chain.
The Old Post • Chicago, IL Register NowIndustry-defining keynotes, rapid-fire technology demos, and industry leaders networking in experiences across Chattanooga - plus the inaugural F3 Awards Dinner featuring the FreightTech and Shipper of Choice reveals.
The Signal at Chattanooga Choo Choo • Chattanooga, TN Register Now
Noble1
quote:
“This is likely a sign of the trough in the market for this cycle. Of course, this is with the caveat that there isn’t a recession lurking around the corner. “
In other words , “if and maybe“ , lol
Thanks for the entertaining article , LOL !
In my humble opinion …………