
This week’s FreightWaves Supply Chain Pricing Power Index: 35 (Shippers)
Last week’s FreightWaves Supply Chain Pricing Power Index: 35 (Shippers)
Three-month FreightWaves Supply Chain Pricing Power Index Outlook: 30 (Shippers)
The FreightWaves Supply Chain Pricing Power Index uses the analytics and data in FreightWaves SONAR to analyze the market and estimate the negotiating power for rates between shippers and carriers.
This week’s Pricing Power Index is based on the following indicators:
Volumes struggle to end the year with vigor
For all intents and purposes, the month of December has only three weeks of freight activity, as the final week from Christmas to New Year’s is effectively null. In years prior, freight demand has fallen throughout the month before bottoming out in that final week. So far, December looks to be following seasonal trends, which is to say that, while shippers’ activity is winding down, this movement is not alarming by itself. Rather, the gap in freight demand between 2022 and ’21 (or even ’20) is the main symptom of current ailments.
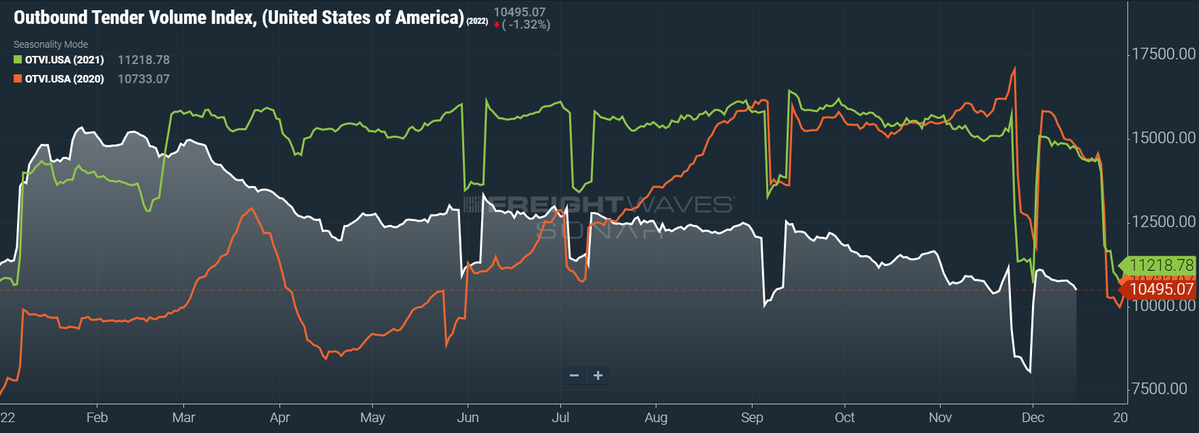
SONAR: OTVI.USA: 2022 (white), 2021 (green) and 2020 (orange)
To learn more about FreightWaves SONAR, click here.
This week, the Outbound Tender Volume Index (OTVI), which measures national freight demand by shippers’ requests for capacity, fell 2.7% on a week-over-week (w/w) basis. On a year-over-year (y/y) basis, OTVI is down 27.6%, although such y/y comparisons can be colored by significant shifts in tender rejections. OTVI, which includes both accepted and rejected tenders, can be artificially inflated by an uptick in the Outbound Tender Reject Index (OTRI).
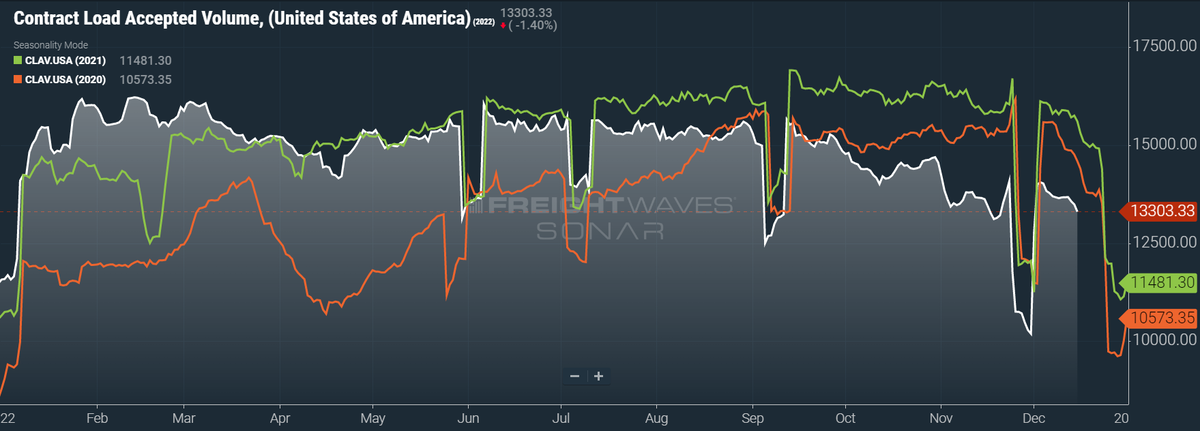
SONAR: CLAV.USA: 2022 (white), 2021 (green) and 2020 (orange)
To learn more about FreightWaves SONAR, click here.
Contract Load Accepted Volumes (CLAV) is an index that measures accepted load volumes moving under contracted agreements. In short, it is similar to OTVI but without the rejected tenders. Looking at accepted tender volumes, we see a dip of 2.7% w/w as well as a fall of 14.8% y/y. This y/y difference confirms that actual cracks in freight demand — and not merely OTRI’s y/y decline — are driving OTVI lower.
To state a basic fact about truckload markets, maritime imports are a strong leading indicator of future over-the-road volumes. Although containerized imports can vary somewhat in which mode of transportation they prefer (like rails), port markets are typically the hottest place for carriers to be. Unfortunately, this year saw contraction in ocean imports during the period that is historically its peak, leaving truckload volumes in late October and November weak. In all fairness, some ports are still grappling with congestion. Earlier this week, 18 container ships were anchored off Georgia’s Port of Savannah. But that type of congestion has less to do with a tidal wave of imports and more to do with a mismatch between smaller ports’ capacity and shippers’ demand.
Last month, ocean volumes suffered greatly, as they were down 12% from October and 19.4% y/y. Most tellingly, import volumes were only 2.8% higher than they were three years ago in November 2019, which was before the COVID-triggered surge of consumer demand for goods. Part of this downward trend can rightly be attributed to China, which has seen its manufacturing and exporting activity abruptly halted and resumed countless times in 2022 by the country’s (now-relaxed) “zero-COVID” policies. But the blame is equally shouldered by weakening demand, which has been destroyed by inflation and consumer satiation of goods.
2023 does not hold much promise either, as sailings to the ports of Los Angeles and Long Beach — the nation’s busiest container port complex — are being canceled at an astonishing clip. A perfect storm is brewing that will push any notable activity on the ocean to the second half of 2023 at the earliest. For one, the Lunar New Year will have an outsized effect on Asia’s manufacturing activity in 2023, possibly taking factories offline for four to five weeks instead of the usual two-week slowdown. Shippers might also continue to avoid the California ports in the absence of a resolution to the ongoing labor negotiations, as the ports and unions have failed to hold a contract with one another since July. While the unions have not yet taken any steps toward serious disruption, such as a labor strike, the contentious situation on the rails might have sent jitters among ocean shippers.
In short, absent of any rapid increase in domestic manufacturing, truckload volumes will likely continue to deteriorate well into 2023.
One last thing to note, however: While freight levels are poised for a significant decline in January and February, they will also be facing difficult comps on a y/y basis. In 2022, shippers were unusually active during the quiet winter season, motivated by fears of securing capacity. Since capacity has become far easier to secure (more on that topic later), it is thus highly unlikely that shippers will be as energetic in 2023. Yet a sizable portion of that y/y disparity will simply indicate that the quiet season is appropriately quiet.

SONAR: Outbound Tender Volume Index – Weekly Change (OTVIW).
To learn more about FreightWaves SONAR, click here.
Of the 135 total markets, 35 reported weekly increases in tender volume as freight demand winds down in an end-of-year fog.
In contrast to the lethargy seen in most markets, freight demand is skyrocketing in Detroit, which has catapulted to the nation’s second-largest market by outbound volume (second only to Atlanta). Detroit’s local OTVI rose 48.26% w/w. Its neighboring Grand Rapids, Michigan, market saw some spoils spill over, with tender volumes rising 6.79% w/w. Other Rust Belt markets were not as lucky: volumes fell 6.28% w/w in Harrisburg, Pennsylvania, while Columbus, Ohio, saw a 2.24% w/w decline in freight demand.
By mode: Winter has begun in the more northerly parts of the country, driving activity in reefer markets as shippers shift modes from dry vans in order to protect their freight against cold weather. The season for shipping Christmas trees is also underway, spurring reefer demand in the Pacific Northwest’s markets. Accordingly, the Reefer Outbound Tender Volume Index (ROTVI) is up 2.05% w/w. While ROTVI is down 28.54% y/y, reefer rejection rates have plummeted over the past year, leading to fewer tenders but not necessarily less volume. Case in point: Accepted reefer volumes are actually up 5.5% y/y.
No such kindness has been given to dry van markets, however. The Van Outbound Tender Volume Index (VOTVI) is down 2.25% w/w and 27.34% y/y. While VOTVI’s y/y gap is also attributable to the difference in rejection rates, accepted van volumes are still down 15.4% y/y.
Rejection rates are locked below 4%
OTRI’s protracted decline has yet to be arrested, as it continued to tumble from late November’s high of 4.5%. While the minute rises and falls of OTRI are indicative of broader trends, it should also be noted there is now relatively little difference whether carriers reject 3-in-100 contracted loads versus 4-in-100, since there remains no major incentive for them to switch over to the spot market.
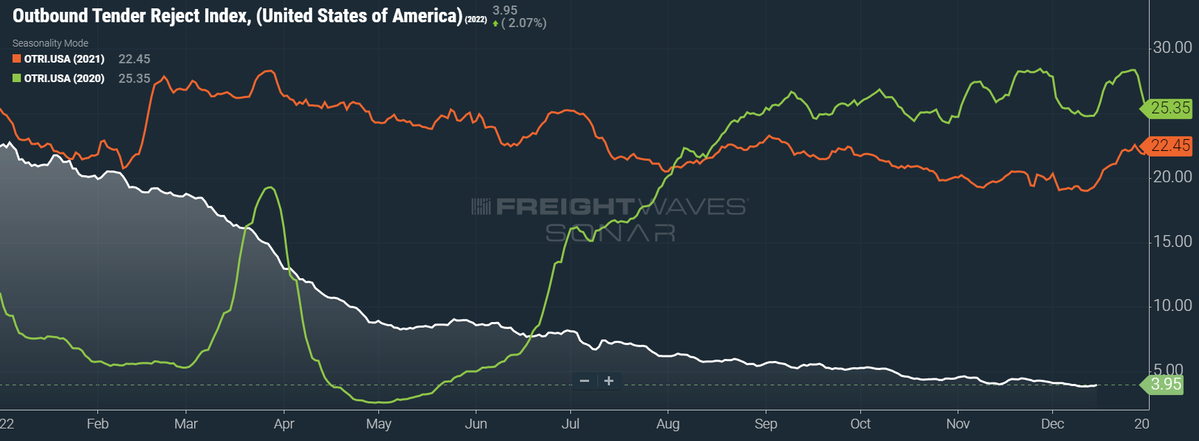
SONAR: OTRI.USA: 2022 (white), 2021 (orange) and 2020 (green)
To learn more about FreightWaves SONAR, click here.
Over the past week, OTRI, which measures relative capacity in the market, returned to its previous level of 3.95%, unchanged from the week prior. OTRI is now 1,568 basis points (bps) below year-ago levels.
It should come as no surprise to regular readers of this column that carriers’ capacity has become easier to secure at cheaper rates. Nevertheless, as an analyst, I always welcome additional data to confirm or dispute my findings. The December release of the Logistics Managers’ Index (LMI) was confirmational this month. Industry insiders stated that transportation capacity grew in abundance, while rates fell at the fastest pace on record. Respondents to the LMI’s survey also believed that rates would be even cheaper by next December, which is a worrying signal to those hoping for a rebound in the back half of 2023.
Given their exposure to the volatile spot market, smaller carriers and brokerages are bearing the brunt of this industry downturn, leaving them vulnerable to acquisitions next year. The market for such acquisitions is therefore booming. In addition to larger companies acquiring those of like type — carriers acquiring carriers, 3PLs merging with 3PLs — a trend of “cross-pollination” is also forming. This trend could be seen, for instance, when the German brokerage DB Schenker took the reins of American truckload carrier USA Truck earlier this year. Shippers are also taking control of their supply chain by moving truckload fleets in-house, like when Ashley Furniture bought assets from Wilson Logistics in late 2021.
What comes after these mergers and acquisitions, especially if the deals close during an industry recession, is uncertain. Earnings and growth potential are obviously major considerations in such deals, both of which could be hindered by deteriorating fundamentals in 2023. A bad market environment, coupled with a broader economic downturn, could lead to significant fat-trimming and layoffs after the ink dries.
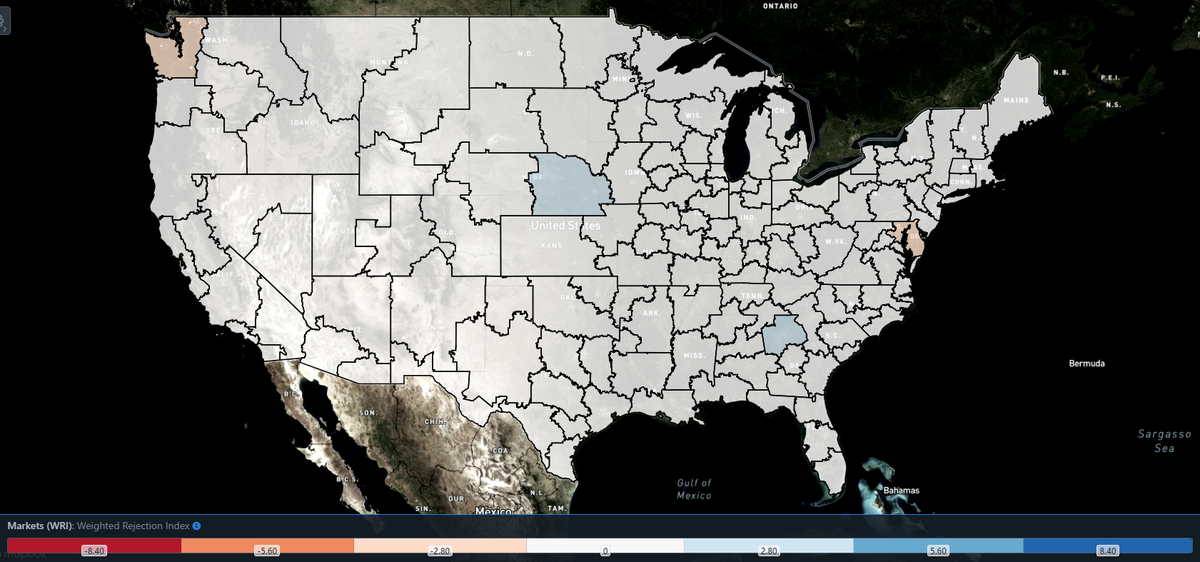
SONAR: WRI (color)
To learn more about FreightWaves SONAR, click here.
The map above shows the Weighted Rejection Index (WRI), the product of the Outbound Tender Reject Index — Weekly Change and Outbound Tender Market Share, as a way to prioritize rejection rate changes. As capacity is generally finding freight, this week a few regions posted blue markets, which are usually the ones to focus on.
Of the 135 markets, 82 reported higher rejection rates over the past week, though 58 of those reported increases of only 100 or fewer bps.
Atlanta saw tender rejections tick up 94 bps w/w, bringing the market’s local OTRI to 3.36%. Rejection rates in the area have been on an extended decline since late June, when Atlanta’s OTRI peaked at 13%. Earlier this week, rejection rates were at a yearly low of 2.41%. Atlanta shippers are not clamoring for capacity very much in any case, as tender volumes are only up 1.3% w/w.
To learn more about FreightWaves SONAR, click here.
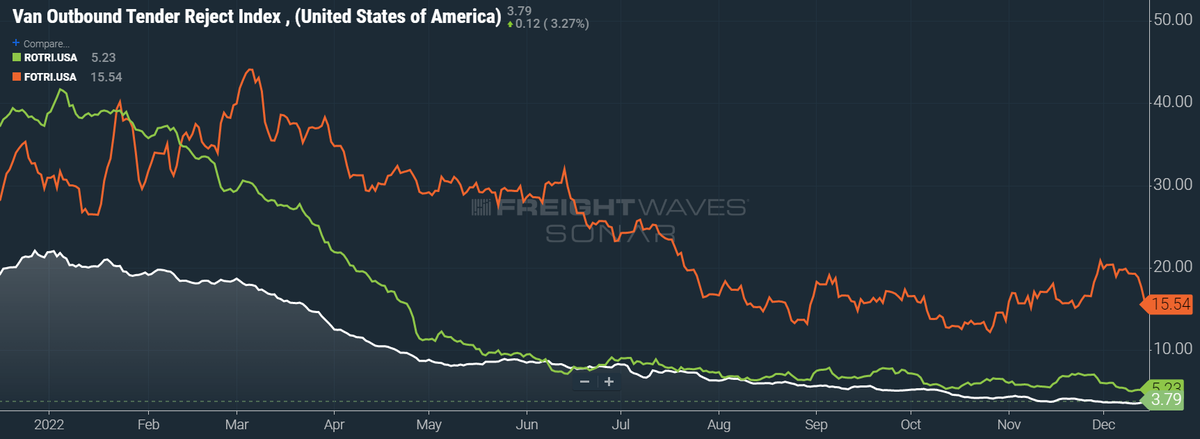
By mode: After starting December near 20%, the Flatbed Outbound Tender Reject Index (FOTRI) has lost 435 bps over the past week, bringing it to 15.54%. Other modes have not seen as drastic of a change, having made the most of their losses early in November. The Reefer Outbound Tender Reject Index (ROTRI) fell only 13 bps w/w to 5.23%, while the Van Outbound Tender Reject Index (VOTRI) ticked up 16 bps w/w to 3.79%.
FOTRI is on track to hit a severe low in January, though it could rise in response to holiday pressures beforehand. ROTRI, on the other hand, should see a boost in the early months of 2023 — especially if inclement weather hits any regions unaccustomed to it.
Diesel prices tumble, bringing spot rates down
Spot rates are losing some of their upward momentum that was gained two weeks ago, but they still remain comfortably above last month’s lows. All-in spot rates are struggling against the second-largest drop in benchmark diesel prices. According to data from the Department of Energy, diesel prices fell by an average of 21.3 cents per gallon w/w. Such a drastic tumble has only been outdone by the beginnings of the 2008 global financial crisis, when diesel fell 21.6 cents per gallon in a week.
The fact that diesel prices are finally coming down should not be surprising in itself. After all, crude oil prices have been nosediving since early November, when fears about weakened demand from China set oil into a downward spiral. Yet in 2022, diesel prices have to be proven increasingly detached from oil prices, partially due to low regional inventories and refinery capacity, but also because of simple profit-seeking. Thus, while it is a welcome surprise that diesel is once again tracking crude oil, it is still somewhat unexpected.
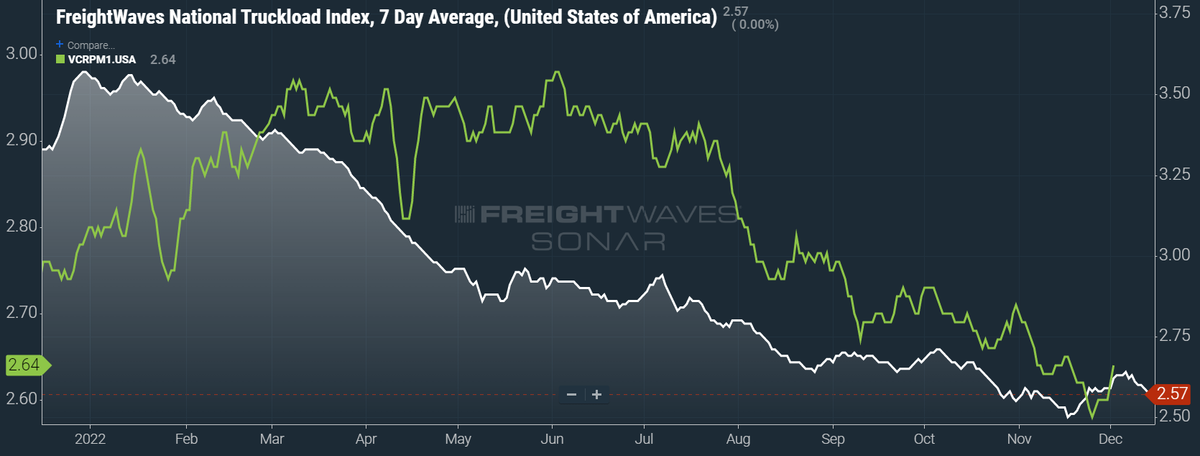
SONAR: National Truckload Index, 7-day average (white; right axis) and dry van contract rate (green; left axis).
To learn more about FreightWaves SONAR, click here.
This week, the National Truckload Index (NTI), which includes fuel surcharges and other accessorials, fell 6 cents per mile w/w to $2.57. Exactly half of this week’s losses can be attributed to the downturn in diesel prices, as the linehaul variant of the NTI (NTIL) — which excludes fuel surcharges and other accessorials — fell 3 cents per mile w/w to $1.80.
Contract rates, meanwhile, are rebounding from their Black Friday low of $2.58 per mile. While contract rates, which exclude fuel surcharges and other accessorials, do typically rise around December’s holidays, they usually do so in the back half of the month. The current rise could point to gathering strength in the contract market, since these rates (which are reported on a two-week delay) are rising in the first few days of the month. Regardless, my expectation for a notable drop in contract rates during Q1 2023 remains unchanged, so it is not terribly productive to extrapolate greater trends from the volatility of holiday pricing.
To learn more about FreightWaves SONAR, click here.
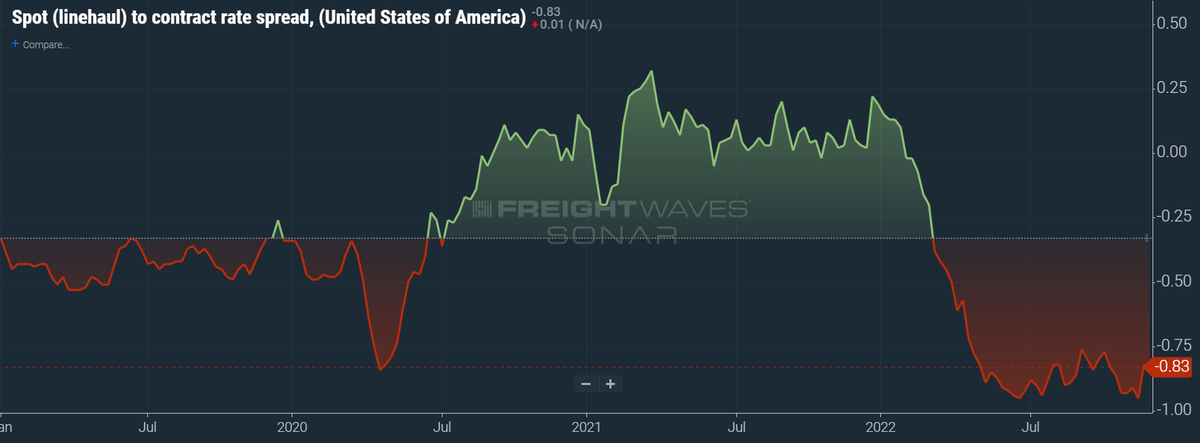
The chart above shows the spread between the NTIL and dry van contract rates, showing the index has continued to fall to all-time lows in the data set, which dates to early 2019. Throughout that year, contract rates exceeded spot rates, leading to a record number of bankruptcies in the space. Once COVID-19 spread, spot rates reacted quickly, rising to record highs on a seemingly weekly basis, while contract rates slowly crept higher throughout 2021.
As the linehaul spot rate remains 83 cents below contract rates, there is still runway for contract rates to decline throughout the next six months.
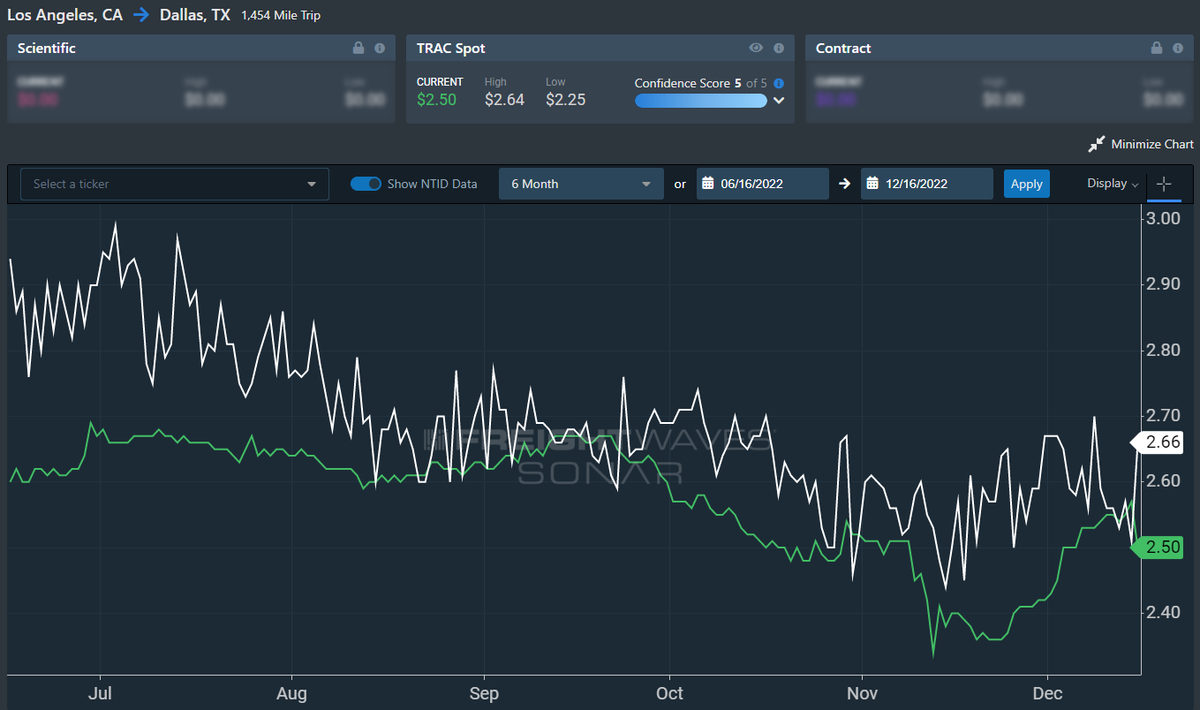
To learn more about FreightWaves TRAC, click here.
The FreightWaves TRAC spot rate from Los Angeles to Dallas, arguably one of the densest freight lanes in the country, is loosing its grip over prior gains. Over the past week, the TRAC rate fell 3 cents per mile w/w to $2.50. The daily NTI (NTID), which has also fallen to $2.66, continues to outpace rates from Los Angeles to Dallas.
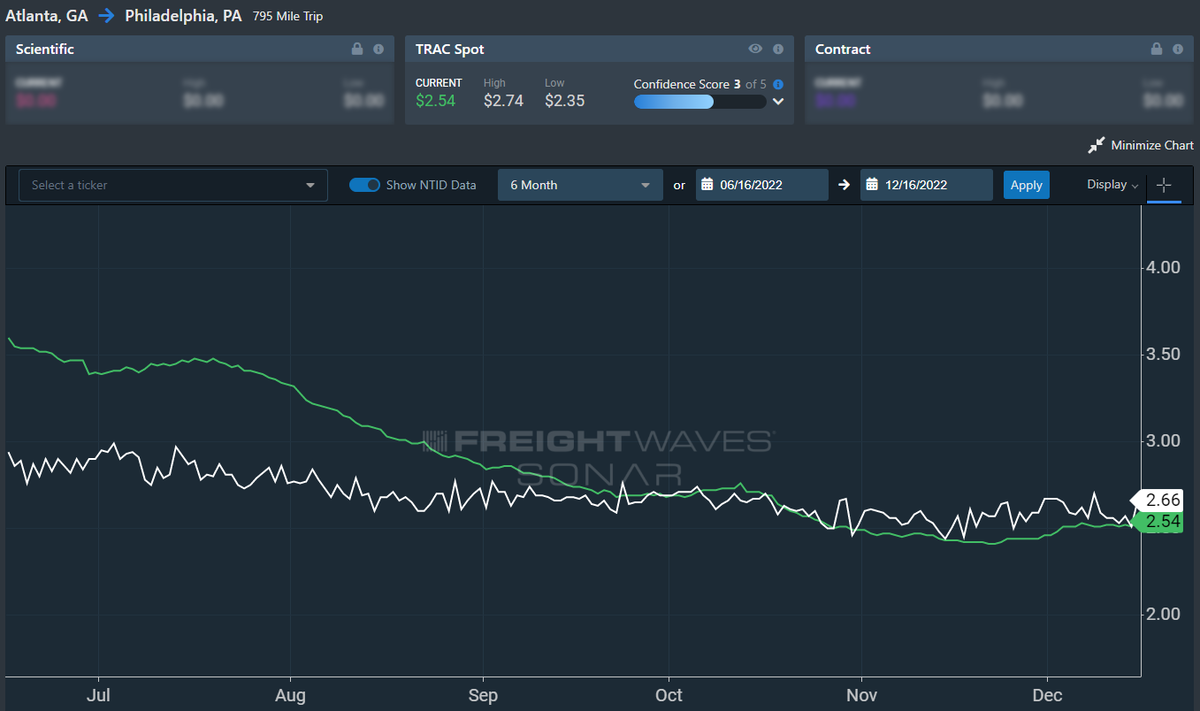
To learn more about FreightWaves TRAC, click here.
On the East Coast, especially out of Atlanta, rates actually increased but are likewise underperforming against the NTID. The FreightWaves TRAC rate from Atlanta to Philadelphia rose 3 cents per mile this week to reach $2.54. Rates along this lane have been dropping stepwise since mid-July, when the TRAC rate was $3.48 per mile.
For more information on the FreightWaves Passport, please contact Kevin Hill at khill@www.freightwaves.com, Tony Mulvey at tmulvey@www.freightwaves.com or Michael Rudolph at mrudolph@www.freightwaves.com.
Supply Chain AI Symposium
Past the hype. Join operators, founders, and enterprise leaders figuring out how to deploy AI in supply chain.
F3: Future of Freight Festival
Industry-defining keynotes, rapid-fire technology demos, and industry leaders networking in experiences across Chattanooga - plus the inaugural F3 Awards Dinner featuring the FreightTech and Shipper of Choice reveals.
Past the hype. Join operators, founders, and enterprise leaders figuring out how to deploy AI in supply chain.
The Old Post • Chicago, IL Register NowIndustry-defining keynotes, rapid-fire technology demos, and industry leaders networking in experiences across Chattanooga - plus the inaugural F3 Awards Dinner featuring the FreightTech and Shipper of Choice reveals.
The Signal at Chattanooga Choo Choo • Chattanooga, TN Register Now