Christmas tree shipping season in full swing across the country

During the holiday season, the usually low-volume Pacific Northwest changes from one of the easiest regions to source truckload capacity to one of the most difficult.

From late November to around Christmas Eve, thousands of loads of Christmas trees from Oregon and Washington put a strain on the nation’s shipping capacity.

Spot rates for loads moving from Portland, Oregon, to Chicago reached as high $6,667 in early December, according to SONAR TRAC. Most Christmas tree loads are handled on short-term rate agreements due to their extremely seasonal nature. 

SONAR: The SONAR TRAC rate from Portland to Chicago shows reefer spot rates increased to as much as $6,667 in early December. To learn more about SONAR, click here.

As of Monday, spot rates for the Portland-to-Chicago lane was around $5,334.94. 

Fresh-cut Christmas trees require special special shipping conditions, which can make transportation more complicated. They are mostly moved in dry vans sometimes packed with ice or in reefer trucks with temperature control.

Christmas trees are grown commercially on about 16,000 farms across the country, according to the U.S. Department of Agriculture. Popular types of trees include fir, pine and spruce.

Oregon, North Carolina and Michigan produce the majority of fresh-cut Christmas trees shipped across the country. Other states producing Christmas trees include Washington, Pennsylvania, Wisconsin and Texas.

The National Christmas Tree Association said about 22 million real Christmas trees were sold in 2023. The median price for a tree last year was $75.

About $553 million worth of domestic trees were harvested and sold nationwide in 2022, according to the most recent USDA data.

Mexico is the top international destination for Christmas trees from the U.S. According to the country’s Ministry of Environment and Natural Resources, up to 2 million Christmas trees are purchased annually in Mexico, with imports from the U.S. and Canada accounting for 60% of purchases annually.

Mexican authorities reported they have inspected more than half a million imported Christmas trees from the U.S. so far this holiday season at border crossings in Arizona, California and Texas.

Mexico is the top international destination for Christmas trees from the U.S., accounting for up to 2 million exports annually. Pictured are Mexican agricultural inspectors checking imported Christmas trees from the U.S. (Photo: Courtesy)

Truckload carrier Paper Transport sees greater adoption for renewable natural gas as fuel

In Truck Tech’s sixth and final special episode highlighting fleets making the switch to natural gas, host Alan Adler spoke with Green Bay, Wisconsin-based Paper Transport Inc. (PTI) about its journey.

PTI was an early adopter of natural gas-powered trucks, with approximately 10% of its total fleet made up of compressed natural gas (CNG) trucks. The company sees a step change in natural gas adoption rates due to an increase in net-zero-carbon renewable natural gas (RNG) sources and the release of a 15-liter natural gas engine developed by Cummins, X15N. 

Dan Deppeler, vice president of maintenance at PTI, told Adler that during the first weeks of taking on his role at PTI, the company had just announced the switch to natural gas trucks. Compared to speccing diesel trucks, deciding on new CNG/RNG trucks was not too different a process. “What we’re solving for anytime we’re speccing is ‘What’s the use case for the truck?’” said Deppeler. 

He added what becomes important with CNG/RNG is range. PTI’s day cab tractors equipped with Hexagon Agility’s 175-diesel-gallon-equivalent (DGE) fuel system achieve about 800-mile range. This allows drivers to fuel once a day, similar to an all-diesel unit. With the release of the Cummins X15N natural gas engine, Deppeler observed a resurgence in customer demand due to the larger engine and greater availability of RNG*.

When running CNG/RNG trucks, PTI relies on dedicated routes to take the most advantage of public access fuel infrastructure. In the past, the carrier was able to run semi-random over-the-road applications in the Midwest utilizing existing CNG/RNG infrastructure. Deppeler adds that currently PTI uses its natural gas trucks mostly for dedicated routes in St. Louis, Southern California, Green Bay, Wisconsin, and in the Northeast.

“It’s become much easier. You do have to be deliberate and be mindful about where the station infrastructure is and where your freight is, but in the dedicated environment, that works really well,” said Deppeler.

Load weight concerns are not an issue, with Deppeler noting they’re able to gross out 80,000 pounds for a fully laden tractor and trailer. Compared with the smaller 12-liter natural gas engine, Deppeler is excited that the larger 15-liter engine brings increased hauling capacity especially when operating in areas with mountainous terrain, something the 12-liter engine struggled with.

On the financial front, Deppeler notes that while CNG/RNG tractors have a higher upfront investment, they offer reduced fuel expenses, and he estimates that CNG/RNG tractors can get upwards of 600,000 miles over their working life. Diesel prices significantly affect the total cost of ownership (TCO), with natural gas offering approximately $2 per gallon in savings.

An added benefit with the addition of RNG is carbon credits, which can help customers offset emissions and improve their sustainability scorecards. Compared to battery-electric, which struggles with infrastructure, Deppeler notes that CNG/RNG trucks can fill the gap for customers looking to immediately reduce their emissions and negate the impact of their existing carbon footprint.

Adler also spoke with Lee Polcin, a veteran PTI driver with over 10 years on the road, who shared his experiences operating both diesel and CNG/RNG trucks. Polcin highlighted the improvements in CNG technology over time. “With the newer [CNG] trucks, I don’t see a difference whatsoever. … Now the technology is there, and to me it’s the same.”

Polcin echoed Deppeler’s observations that the new Cummins 15-liter natural gas engine will help fleets, especially those that operate in hilly and mountainous terrain and are hauling heavy loads. Polcin recommended that drivers try out a natural gas truck and form their own opinion, as the technology and capabilities have vastly improved from when the trucks were first introduced. An added benefit with the CNG/RNG engine is noticeably less noise compared to the loud droning of an idling diesel engine.

For Jared Stedl, chief commercial officer at PTI, the natural gas tractors presented more opportunities but had some operational constraints. Dedicated applications with specific routes and established fueling locations are the primary focus, allowing the tractors to fuel at least once a day, similar to a diesel day cab.

Regarding total cost of ownership, Stedl said most customers seek a five-year commitment to bring the TCO to breakeven while adding the sustainability benefits. But for many of the largest shippers, TCO remains the first priority, which requires that the natural gas trucks run enough miles to reach that breakeven point. “The bigger investment in the truck requires a lot more miles to save more money on the variable costs,” added Stedl. To some shippers, the sustainability side more than compensates for the added requirements to reach breakeven TCO.

Another way fleets are able to realize the benefits is by using day cab trucks in slip seat operations, with multiple drivers utilizing the same truck at different times. By pairing slip seating with local and regional operations, PTI is able to get more utilization compared to traditional one-way OTR applications for its CNG/RNG trucks.

While CNG/RNG tractors are only 10% of PTI’s total fleet, Stedl hinted that more fleet growth is possible based on recent agreements with customers that they hope to move forward with.

For PTI, this transition to CNG/RNG trucks has been over a decade in the making. “You don’t just flip the switch,” said Stedl. He added that PTI was one of the first trucking companies outside California to implement the technology. 

“You have to have a willingness to see it through. You can’t just give up after one poor experience. And make sure you have customers and partners that will do the same. … As a result of that, we’re seeing new technology now,” said Stedl.

To learn more about Hexagon Agility, visit www.hexagonagility.com.
* RNG can be used as a transportation fuel in the form of CNG.

Truckload rates near a 2-year high: What truckers need to know

Hey truckers, listen up! The freight market’s heating up, and it’s looking good for your wallets. Let’s break down what’s happening and what it means for you out on the road.

Spot rates are soaring

The SONAR National Truckload Index (NTI) is showing some numbers we haven’t seen in almost two years. We’re talking $2.53 per mile! The last time rates were this high was back in January 2023. Truckload spot rates are up 34 cents a mile since Oct. 1, 2024, a 15% increase. In the past week, we’ve seen spot rates jump from $2.38 to $2.53 a mile, a 15-cent increase.

National Truckload Index 7-Day Average – USA SONAR

This chart is the SONAR National Truckload Index (NTI), which measures spot truckload rates. The pink line is 2023; the yellow line is 2024. 

This is happening a week before the end-of-year surge, which always delivers the strongest rates of the year.

What’s causing the spike?

Here’s the interesting part: Freight volumes are actually down compared to last year. So why are rates going up? There’s less competition out there. There are about 14,400 fewer trucking authorities active now compared with last year. That’s a 4% drop, which means fewer trucks fighting for the same loads.

Rejection rates on the rise

Carriers are getting pickier about the loads they’re taking. The outbound tender rejection rate has climbed to 6.47%, up from 5.96% just a week ago. That’s the highest it’s been since July. What does this mean for you? You’ve got more power to choose the loads that pay best.

Looking ahead: What to watch for

  1. Contract rates: Shippers might start locking in higher contract rates to make sure they can move their freight. This could mean more stable, higher-paying loads for those of you on dedicated routes.
  2. Potential boom in 2025: There’s talk that if certain policies create an economic boost, we could see a big surge in freight demand. That would be great news for carriers, as rates could climb and stay even higher.
  3. Capacity crunch: Remember the Clearinghouse II regulations that arrived in November? That could sideline a lot of drivers, making your skills even more valuable.

What you can do

  1. Stay informed: Keep an eye on these trends. Knowledge is power in this business.
  2. Be selective: With rates up and capacity down, you can afford to be choosier about your loads. Look for the best-paying freight that fits your schedule and markets you want to go to.
  3. Build relationships: Shippers are going to be looking for reliable carriers. If you have a good track record, now’s the time to leverage it.
  4. Keep your equipment in shape: With demand potentially increasing, make sure your rig is ready to roll when those high-paying loads come calling.

Remember: The freight market’s always changing. Right now, it’s swinging in favor of carriers. Make the most of it while the getting’s good, and stay safe out there on the roads!


For daily updates, check out the SONAR National Truckload Index (NTI.USA) page on GoSONAR.com.

Trump again backs longshore union as possible port strike nears

President-elect Donald Trump over the weekend doubled down on his opposition to automation as a possible strike by union dockworkers at East and Gulf Coast container ports draws closer.

On Saturday, Trump reposted to more than 8 million followers on his social media platform, Truth Social, a Facebook message by Dennis Daggett, International Longshoremen’s Association executive vice president, praising Trump for his support of the union in its protracted contract fight with employers at Eastern Seaboard and Gulf Coast container ports. 

The reposting comes after the president-elect on Thursday backed the union in its contract dispute following a meeting with Daggett and his father, ILA President Harold Daggett, at Trump’s residence, Mar-a-Lago, in Florida.

“I had the honor of meeting with President-elect Donald Trump yesterday, and I want to share an experience I never imagined in my wildest dreams,” Dennis Daggett wrote in his Facebook post.  “Throughout my career, I’ve never seen a Politician – let alone the President of the United States – truly understand the importance of the work our members do every single day. But yesterday, President-elect Trump not only demonstrated that understanding but also showed the utmost respect for the hard work, sacrifices, and dedication of our membership.”

Trump’s messaging comes amid stalled contract negotiations between the ILA and employers represented by the United States Maritime Alliance (USMX). The union claims automation is a job-killer, while the USMX says the technology is desperately needed to make the ports’ container handling globally competitive. 

While the union has been visible and out in front in the war of words, member executives of the USMX, including those of foreign-based ocean carriers, have been reluctant to be the face of their group during negotations.

The sides are up against a Jan. 15  deadline to come to a new agreement, when an extension of the current contract covering tens of thousands of union workers at dozens of ports from Massachusetts to Texas expires.

A three-day strike by the union in October brought container and roll-on/roll-off traffic to a halt. Acting Labor Secretary Julie Tsu brokered an end to the strike, when the sides agreed to the extension and a 62% pay hike for workers while negotiating container royalties and other details of a new six-year master contract.

But the ILA cut off bargaining over employers’ demands to include semiautomated cranes in the new contract. While the union says the USMX wants to eliminate jobs, it also claims the cranes pose a security risk to ports and maritime shipping.

The pay raise would be scuttled if a new pact is not reached before the extension expires.

While Trump publicly supports the union, there has been no indication what action he might take in the event of a prolonged strike.

Prior to the election, President Joe Biden said he would not intervene in a walkout. The federal Taft-Hartley Act gives the president powers to end a strike and order a cooling-off period if it’s shown to seriously endanger U.S. interests.

In 2002, President George W. Bush invoked Taft-Hartley to end a lockout of International Longshore & Warehouse Union workers by the Pacific Maritime Association at West Coast ports.

Shippers for months have been frontloading imports ahead of a possible strike, as well as Trump’s proposed China tariffs, while shipping lines announce service changes to manage disruptions.

CMA CGM, in an advisory to customers, said, “If a strike occurs, we expect vessel operations to halt at 0001 hours on January 16th, 2025. Our dedicated teams are working on contingency plans to ensure that all … operations are completed prior to any labor disruptions.

“In the event of a work stoppage, U.S. East Coast and Gulf terminals will halt operations, leading to the suspension of gate and rail services. You will receive more details as the January 15 date approaches. Similarly, terminals and nearby depots will not be open to accept empty returns. Please hold your empties until the terminals and depots reopen. Escalations and emergent issues can be sent to your designated client solutions contact.”

This article was updated on Dec. 17 to clarify that in 2002, President George W. Bush invoked Taft-Hartley to end a lockout of International Longshore & Warehouse Union workers by the Pacific Maritime Association at West Coast ports.

Find more articles by Stuart Chirls here.

Related coverage:

Apparel importers call for labor talks to resume, say port automation ‘vital’ 

Trump backs ILA in port labor standoff

Freightos sees trans-Pacific container rates ease

The Weekly Tender: Truckload market surging

Welcome to my new series: The Weekly Tender. Each week, I will highlight the stories and topics across transportation that are trending. 

Truckload market experiences stronger peak season

As we approach the final days before Christmas, it’s becoming evident that the truckload market has experienced a peak season stronger than those of the past two years. While questions remain about whether this is merely a seasonal “Santa rally” or indicative of a more substantial market shift, there are signs pointing towards a recovery from the Great Freight Recession.

The bottom of the freight market appears to have occurred in May 2023, with the bottoming process playing out in the early months of the year. Signs of life were observed this past May and June, suggesting potential for a strong third quarter. However, the real surge didn’t materialize until after the election.

Rising rejection rates amid capacity exodus

Recent data from SONAR reveals an interesting trend in the truckload market. Despite a drop in overall freight volumes, rejection rates are on the rise, indicating a significant exodus of trucking capacity. The Contract Load Accepted Volume index (CLAV) shows carriers are accepting the same load volumes as they were in April 2023, near the theoretical floor of the recent recessionary period. However, rejection rates have more than doubled since that time.

This trend suggests that a substantial amount of supply has left and continues to leave the domestic truckload market. The gap between total tenders (OTVI) and accepted tenders (CLAV) is steadily growing, reflecting decreased availability of trucking capacity.

As noted in recent research, the rise in rejection rates is more than just a seasonal anomaly; it is a clear indicator of diminishing capacity within the truckload market. The Outbound Tender Reject Index (OTRI) has shown a marked increase since October, climbing from approximately 4.5% to 6.5% by mid-December. This pattern deviates from the typical seasonal fluctuations, where rejection rates either stabilize or decline heading into the Thanksgiving period. The discrepancy indicates that the current rise is not solely driven by demand-side dynamics.

What further distinguishes this trend is its contrast to previous years, such as 2019 and the current cycle, where rejection rates steadily rose during this season. Historically, rejection rates have shown a tendency to dip after the holiday season, but the persistence of heightened levels suggests ongoing difficulties in securing truckload capacity.

Contributing to this scenario is the ongoing net exit of carriers from the market, with over 350 net carrier exits per week being reported on average over the past two years, a historic phenomenon. This mass departure of carriers is translating into reduced availability of capacity, which in turn pushes rejection rates higher. The situation is compounded by the fact that, as freight volumes decrease, the demand for available trucking capacity remains competitive, pushing carriers to reject more tenders as they become more selective about the loads they accept.

In summary, the elevated rejection rates can be seen as a reflection of a tighter supply environment within the truckload market, marking a significant shift from the capacity surplus found in prior periods. As carriers continue to exit the market, rejection rates are likely to remain high, creating a more challenging landscape for shippers seeking to secure transportation solutions.

Shippers Respond to Tightening Market

In anticipation of a tighter truck freight market in 2025, some shippers have already begun making contract adjustments. There’s evidence of price appreciation in contract rates as the spread between spot and contract rates increases. Approximately 70% of freight moves under contract, and the fact that these prices are starting to appreciate signals that the bottom of the recession is in the past, and the market is now in a tightening cycle.

Some shippers experiencing service degradation are already issuing mini-bids and repricing some of their freight. This proactive approach suggests that logistics departments are preparing for potentially higher transportation costs in the coming year.

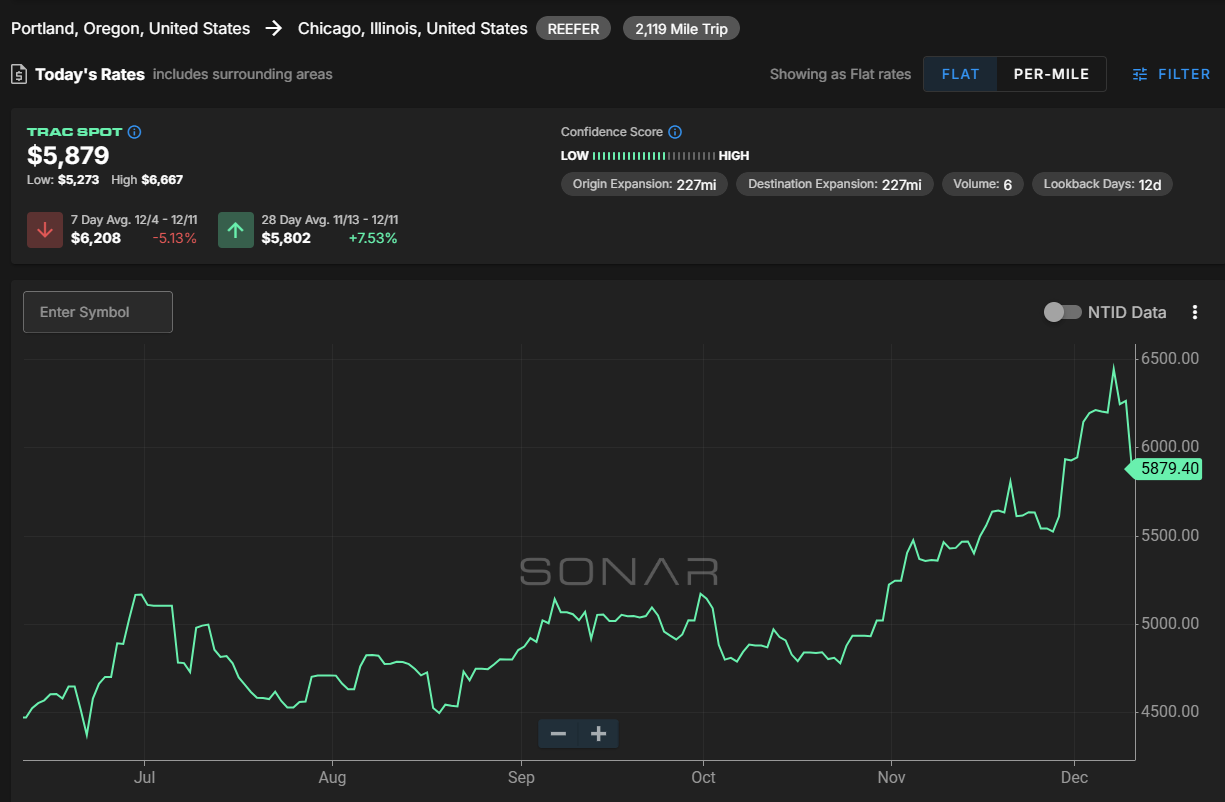
Truckload Spot Rates are Surging in Response to Tender Rejections

The latest data from the SONAR National Truckload Index (NTI) indicates a strong upswing in truckload spot rates, which have escalated from $2.38 to $2.52 per mile. This marks the highest level seen in nearly two years and has sparked a renewed focus on spot market dynamics. The increase in spot rates aligns with rising tender rejection rates, underscoring the tightening capacity in the truckload market.

With the Great Freight Recession over, trucking companies are now gaining pricing power. The heightened spot rates are not just a seasonal phenomenon but point towards a recalibration of market fundamentals. As more carriers reject tenders due to limited capacity, shippers are forced into the spot market, driving rates higher. The dynamic between spot and contractual rates remains pivotal, with the spread signaling an ongoing shift toward a carrier-driven market.

Furthermore, this climate poses challenges for shippers, as securing necessary capacity becomes increasingly difficult and costly. Experts suggest shippers should adjust their strategies, potentially entering more long-term contracts despite the premium, to mitigate risks associated with an unpredictable spot market. This proactive stance could prove vital in navigating the complex market landscape, further complicated by economic shifts and logistical challenges anticipated in the upcoming years.

Carrier Revenge Coming in 2025?

As the freight market navigates through a transitional phase marked by a tightening capacity and shifting power dynamics, the notion of “carrier revenge” has surged to the forefront. This concept refers to a potential scenario in which carriers, backed by growing market leverage, might respond unfavorably to shippers who have previously been difficult or demanding in their dealings.

With carriers gaining pricing power due to diminished capacity and rising rejection rates, there is a risk for shippers who have traditionally leveraged their volume to negotiate lower prices to face pushback. Carriers may prioritize engagements with more cooperative shippers, opting to exercise discretion over the loads they choose to accept. This preferential selection could result in unreliable service for those shippers perceived as challenging, forcing them to resort more frequently to the higher-cost spot market.

The prospect of carrier revenge highlights the importance for shippers to cultivate positive relationships and fair contract terms, particularly during periods of market stress. As noted in the current analysis, the ongoing trend towards greater carrier control could serve as a harbinger of compounding difficulties for shippers lacking strategic partnerships. Maintaining robust and mutually beneficial relationships with carriers may prove crucial in securing consistent service and avoiding the adversities associated with volatile spot market dependency.

This emerging dynamic underscores the need for shippers to reevaluate their strategies, potentially increasing their reliance on contract agreements despite the cost premium. Such efforts could mitigate risks associated with fluctuating market conditions and position them more favorably in the eyes of carriers navigating the evolving freight market landscape.

RXO Provides Context on the Current Market and Outlook

RXO’s data insights offer a comprehensive view of the trucking industry’s current state, shedding light on key market dynamics as we move towards 2025. Their transactional rate data reveals that rates in Q3 were approximately 5.8% to 6% higher year over year, indicating a trend of rising costs for carriers. Such increases underscore the unsustainable levels of operating costs due to rising interest rates and the expenses associated with new equipment.

The RXO Curve, a reconstructed dataset following RXO’s acquisition of Coyote Logistics, provides a historical perspective on market cycles, specifically highlighting how the current cycle compares to previous ones. The Curve illustrates that while earlier freight business cycles had peaks and troughs within predictable ranges, the recent cycle (peaking at 68% and troughed at 38% during COVID times) was unprecedented in its volatility, largely driven by pandemic-induced market shifts.

Analysts anticipate a tangible change in market fundamentals beginning in Q2 2024, with projections showing a continued rise in the year-over-year spot rate curve, likely peaking in 2025. Despite the recent dip, contract truckload rates are expected to climb anew in Q4. However, the disconnect between spot and contract rates remains pronounced, with spot rates consistently trailing behind contract rates, except for brief inversions observed during notable holiday seasons.

Ultimately, RXO’s data paints a picture of an industry at the cusp of transformation, with carrier attrition laying the groundwork for tighter market conditions reminiscent of 2014. The industry eagerly awaits a sustained rally where spot rates surpass contract rates, potentially signifying robust growing momentum — a scenario yet to be fully realized but well within the realm of possibility according to RXO’s analysis. This sustained growth could fuel routing guide deterioration, further stressing the necessity for strategic planning by shippers and carriers alike as they navigate this dynamic freight landscape.

Kal Freight Bankruptcy and Accusations of Fraud

In recent months, the trucking industry has been rocked by a series of high-profile bankruptcies, underscoring the increasingly challenging environment for carriers. Notably, Kal Freight, a fleet that had 580 power units filed for Chapter 11 bankruptcy, but says it plans to continue to operate.

The trucking firm is accused of double-pledging its trucks as collateral to secure financing from both U.S. and Canadian lenders.

Amidst these allegations, a California lawsuit filed by Daimler Finance revealed that Kal Freight had duplicated vehicle identification numbers on trucks and trailers, a deceptive tactic to manipulate financial backing. This scandal led to a significant shakeup in the company’s corporate governance, with a judge approving the addition of independent directors to its board. The move, intended to curtail the influence of owner Kalvinder Singh, was part of broader measures to stabilize the company after it filed for Chapter 11 bankruptcy with a staggering $325 million in long-term debt.

The case of Kal Freight is not unique in the industry. Cedar Trucking of West Virginia, a smaller operator with 22 power units, also filed for Chapter 11, citing financial distress amidst an environment beset by rising operational costs and market pressures.

The intermodal sector has seen notable developments, with long-haul rail intermodal volumes for both international and domestic size containers increasing during a time when volumes typically slow down. This unusual trend may be attributed to shippers using rail as “warehouses on wheels” for goods not immediately needed, taking advantage of slower transit times and potential tax benefits.

Import volumes remain at record highs relative to seasonality, as shippers prepare for potential tariff changes and other impacts from anticipated policy shifts under the incoming Trump administration.

Potential Longshoreman Strike Looms, Trump Endorses ILA in Resisting Automation

In a notable development impacting port operations and the broader supply chain, President-elect Donald Trump has publicly expressed his support for the International Longshoremen’s Association (ILA) amidst its contract standoff with port employers. This endorsement aligns with the union’s resistance to the introduction of port automation technologies, which they argue jeopardize union jobs.

The ILA, representing 45,000 dockworkers at 36 East and Gulf Coast ports, has been steadfast in its opposition to semi-automated container cranes, asserting that these innovations threaten to eliminate member jobs. Tensions have escalated since November, when negotiations for a new contract—with automation at the core of the dispute—came to a halt. Historically, the union has advocated for employment stability, citing the substantial profits accrued by port employers and foreign-based terminal operators. These companies, the union argues, should reinvest in hiring more dockworkers rather than automating operations.

Previously, the ILA managed to secure a significant 62% pay hike extended over six years, yet the issue of automation has remained unresolved. Terminal operators and shipping lines, under the auspices of the United States Maritime Alliance (USMX), contend that port automation is vital for enhancing competitiveness and efficiency in U.S. container hubs. They maintain that automation could in fact generate additional jobs required to manage increased container throughput despite the union’s contrary stance.

Trump’s post, following a meeting with ILA President Harold Daggett, reiterated the union’s position, emphasizing the primacy of American workers over machinery. Trump highlighted the importance of investing in human resources rather than infrastructure that could potentially lead to layoffs, an assertion resonating with his economic rhetoric of prioritizing American jobs.

As the January deadline for the extension’s expiration approaches, the prospect of a strike looms large. Shippers, wary of the disruption a strike might induce, are preemptively increasing imports to mitigate risk. This labor conflict, underscored by Trump’s intervention, underscores the broader tension between labor needs and technological advancement—a dynamic that continues to challenge labor relations and the evolution of port operations across the country.

C.H. Robinson’s Turn Around Appears to be Working

C.H. Robinson’s recent investor meeting has catalyzed substantial optimism among Wall Street supporters, reflected in the significant uptick of the company’s stock prices. Bolstered by strategic insights shared during the gathering, the positive response from investors is largely attributed to the company’s renewed focus on both technology enhancements and a concerted push back into the small and midsize business (SMB) market.

One of the key drivers outlined at the event was C.H. Robinson’s commitment to improving its technology stack within its North American Surface Transportation segment. Wells Fargo’s transportation research team anticipates that these tech advancements should elevate the operating margins for this segment back to an ambitious target of 40%, indicative of a robust, albeit not the pinnacle, market cycle. This technological leverage aims to balance human expertise with cutting-edge matching technology, enhancing service delivery and operational efficiency.

Another significant element of C.H. Robinson’s growth narrative is its strategic pivot back to targeting SMBs, reversing a previous de-emphasis that coincided with the influx of digital brokerage platforms. The company acknowledged past inadequacies in digital service offerings and indicated that these deficits led to a customer attrition to competitors. Presently, with improved digital capabilities, approximately 50% of bookings are fulfilled digitally, which signifies an important evolution from the 5% recorded in prior years.

Additionally, C.H. Robinson plans to capitalize on growth within specific verticals, namely energy, health care, retail, and automotive, where opportunities for expanding their total addressable market lie. This approach involves leveraging a more asset-based model through trailer pooling with partnered resources, enabling the company to present as an asset-heavy entity without incurring the associated costs.

C.H. Robinson’s growth strategies are not solely dependent on aggressive market expansion efforts. CEO Bozeman emphasized that the enhanced fiscal performance is not a mere result of favorable market conditions, but a product of strategic initiatives tailored to reclaim market share especially in the SMB segment. Importantly, the company’s forward-looking projections include generating between $350 million and $450 million in incremental operating income by 2026. These targets reflect not just cost-cutting measures but also an emphasis on capturing market growth and expanding operational margins through technology and service improvements.

Investor enthusiasm is buoyed further by the boost in C.H. Robinson’s Global Forwarding segment, attributed to ameliorated conditions in the ocean freight market. Such factors, coupled with human resource optimization strategies that integrate advanced tech tools, paint a promising picture of the company’s trajectory in the competitive logistics landscape.

Supersonic Flight Takes Off Again with Boom Technology

Boom Technology is rekindling the dream of supersonic flight with its Overture jet, marking a significant shift in the aviation industry. This move comes decades after the Concorde’s downfall, a venture often deemed “economically stillborn” due to its design choices. Boom’s CEO, Blake Scholl, has been a vocal advocate of reviving supersonic travel, believing that a transition to this speed is inevitable.

While the Concorde struggled to find its economic footing, Boom Technology is set on charting a new path with its 64-seat Overture, emphasizing a blend of speed and comfort for what it touts as an “all-premium supersonic experience.” Scholl’s vision extends beyond just the technical specifications; he is committed to addressing the minutiae that often plague modern air travel, aiming for an experience that is tranquil rather than tumultuous.

This innovative approach is backed by substantial venture capital, with major airlines like United, American, and Japan Airlines already placing preorders for the Overture jets. Scholl has highlighted the uniqueness of Boom Technology’s financing model, a critical aspect given the capital-intensive nature of bringing such an aircraft to fruition.

The success of Boom’s venture could signify a win for everyone involved—passengers, airlines, and the investors—the industry at large grappling with the concept of supersonic travel since the Concorde era. As the company steers towards scaling and significant growth, the aviation world watches to see how this ambitious project will impact the landscape of air travel.

Unraveling the Mystery Drones Over New Jersey

The skies over New Jersey have recently been filled with an air of mystery as numerous unidentified drones have made perplexing appearances across the state, sparking concern among local and state officials. These sightings have not only raised questions but have also drawn attention to the potential security implications and the limitations of current drone management and oversight.

Despite over 3,000 reported drone occurrences reviewed by federal investigators since November 18, clarity remains elusive. The mysterious drones, described by Assemblywoman Dawn Fantasia as large, durable, and capable of long-distance travel, do not align with those typically used by hobbyists. Their peculiar behavior includes coordinated flights with lights turned off and the ability to evade tracking by standard means. Such characteristics have further fueled anxieties regarding their purpose and origin.

Local authorities, including mayors from Morris County—the epicenter of these sightings—have criticized state responses, urging expedited information sharing and federal intervention. The limitations imposed by federal regulations, which restrict local law enforcement’s ability to counteract rogue drones, exacerbate the situation, leaving officials with few actionable options.

These incidents have placed the spotlight on the broader issue of drone regulation and the gap between existing capabilities and emerging aerial challenges. As calls for transparency and increased security measures echo through New Jersey’s legislative and civic halls, the drones serve as a potent reminder of the evolving complexity of airspace management in the modern era.

Looking Ahead to 2025

As we look towards 2025, several factors are expected to influence the freight market:

  1. Potential interest rate cuts could lead to lower container prices in the U.S. and Europe.
  2. Shipping overcapacity may drive down freight rates and container prices.
  3. Geopolitical tensions and trade disruptions, including potential Trump tariffs, could exacerbate market volatility.
  4. New trade routes, such as China-Mexico-U.S., may continue to grow for trans-Pacific commerce.
  5. Increased operational costs from fuel prices, regulatory compliance, and trade tariffs will likely affect container traders and shipping rates.

Industry experts advise shippers to be prepared for potential volume surges and challenges in finding capacity. Locking in contract rates, even at higher levels, may be advisable to secure capacity in an increasingly volatile market.

As the freight market continues to evolve, stakeholders across the industry will need to remain agile, leveraging data and preparing for both likely and unforeseen scenarios to navigate the changing landscape successfully.

Despite win on appeal, TQL wants Supreme Court to review broker liability issue

In an unusual twist, giant brokerage TQL is asking the U.S. Supreme Court to review its lower court victories on the question of broker liability.

In a brief filed with the Supreme Court last week, TQL sided with its adversary Katia Gauthier in seeking review of the lower court cases. Her husband, Peter, was killed in May 2020 in a collision with a truck hired by TQL.

Gauthier’s subsequent lawsuit against the carrier and TQL resulted in a pair of decisions – in the U.S. District Court for the Southern District of Georgia and on appeal in the 11th U.S. Circuit Court of Appeals – that TQL was protected from legal claims by the provisions of the Federal Aviation Administration Authorization Act, enacted in 1994.

Gauthier’s appeal to the Supreme Court for review marks the third time the question of broker liability under the so-called F4A has been brought to the court for review. In one of those cases, a Circuit Court held the broker was not fully protected by F4A. In the second, another Circuit Court held the opposite. But despite that conflict, the nine justices of the Supreme Court rejected review both times.

Given that uncertainty, even with a court victory in hand, TQL wants the high court to take up the issue.

“It is certainly unusual,” Marc Blubaugh, co-chair of the Transportation & Logistics Practice Group at the Benesch law firm, said in an email to FreightWaves. “The fact that TQL is willing to risk its victory by requesting review sends a strong signal that it has a great deal of confidence in the merits of its legal position. In short, TQL necessarily sees this as an opportunity to put the scope of the so-called safety exception under FAAAA to rest once and for all.”

TQL’s brief to the Supreme Court makes clear that clarification of conflicting circuit decisions is its goal in making the same appeal to the Supreme Court that Gauthier has undertaken.

A ‘suitable vehicle’ for clarifying the issue of broker liability

The 11th Circuit’s decision in favor of TQL, the 3PL said, “deepened an existing conflict on that question; the question is exceedingly important to the national transportation industry; and this case is a suitable vehicle for resolving it.”

An attorney representing TQL in its request for review declined comment.

TQL’s brief includes a history of how F4A came into being and reiterates the core provision of the law as it relates to trucking: A state may not enact a law or regulation “related to a price, route or service” of a carrier.

It also addresses the safety exception of F4A, which does allow the act to be preempted if the state is enforcing, citing precedent, “traditional state power over safety” in order to ensure “safety on municipal streets and roads.”

The precedent that has had the brokerage community concerned is out of the 9th Circuit, in the case of Miller vs. C.H. Robinson (NASDAQ: CHRW). That case, like others, wrestled with the question of whether a brokerage could be found to be considered a “motor vehicle,” which is wording in the F4A. 

“We hold that negligence claims against brokers, to the extent that they arise out of motor vehicle accidents, have the requisite ‘connection with’ motor vehicles,” the 9th Circuit wrote in its 2020 decision. “Therefore, the safety exception applies to Miller’s claim against C.H. Robinson.”

But the Supreme Court rejected C.H. Robinson’s request for review of the Miller decision, leaving it a precedent in the 9th Circuit and for any other circuits that lack a precedent on the question of broker liability. That is a major concern to the 3PL industry.

The question of whether a broker has a “connection with” a motor vehicle is key in legal arguments.

Under safety exemption, is a broker a motor vehicle?

That question – can a broker be considered a motor vehicle under the terms of the safety exception? – was at the heart of the dissent by Judge Ferdinand Fernandez in the Miller vs. C.H. Robinson case and is the argument that a lawyer for Public Citizen, the Ralph Nader-founded progressive organization that is representing Gauthier in her appeal to the Supreme Court, presumably would be challenging. (While F4A bars state law impacting pries, route of service of a motor carrier, it is the term motor vehicle that is found in the safety exemption).

“Robinson is a broker,” Fernandez wrote in his dissent. Citing federal law, he then defined a broker as “a principal or agent [that] sells, offers for sale, negotiates for, or holds itself out by solicitation, advertisement, or otherwise as selling, providing, or arranging for, transportation by motor carrier for compensation.”

Fernandez again cited federal law to define a motor carrier as “a person providing motor vehicle transportation for compensation.” 

“A broker cannot be a motor carrier,” Fernandez wrote. “Those definitions make clear that as a broker, C.H. Robinson and the services it provides have no direct connection to motor vehicles or their drivers. Any connection is merely indirect — for example, via an intermediary motor carrier.”

But the 9th Circuit held otherwise on the question.

The Supreme Court also rejected review of a case coming out of the 7th Circuit, Ying Ye vs. GlobalTranz, where F4A was found to protect the broker. 

Eleventh circuit has ruled twice in favor of brokers

In a third case, this time in the 11th Circuit, the appellate court ruled in April 2023 that Landstar (NASDAQ: LSTR) was protected by F4A in an incident involving a stolen truck. That case was not sent to the Supreme Court for review, but as TQL notes in its filing with the Supreme Court, the appellate court cited the Landstar case in the TQL decision as a precedent, as both cases were in the 11th Circuit.

The inconsistencies need to be resolved, TQL argues in its brief. 

“Although the court of appeals reached the correct result in this case, the question presented is one of considerable importance to the transportation industry,” TQL’s attorneys write in their submission. “The increasing uncertainty concerning the question presented not only imposes significant costs on respondents and other freight brokers but also undermines Congress’s deregulatory objectives in enacting the FAAAA. Moreover, this case is a suitable vehicle to resolve the conflict on the question presented.”

“While only three federal circuit courts have determined the issue, a bevy of federal district courts and state courts have continued to issue conflicting decisions on the subject,” Blubaugh said.

He also contrasted the TQL stance with that of GlobalTranz, which had argued the Supreme Court should not take up GlobalTranz’s own case involving broker liability.

“GlobalTranz acknowledged that the issue is indeed one of great public importance but stated in its opposition to review in the Ying Ye case that the Court might wish to allow the issue to ‘percolate’ for more time before seeking review,” Blubaugh said. In contrast, he added, “TQL is ready to join the issue.”

In addition to Public Citizen, which was not involved in the case in the lower courts, Gauthier has Georgia-based attorneys from the firm of Harris Lowry Manton in her appeal to the Supreme Court.

“We think this case is about interpreting the safety exception and that it’s clear that these types of cases are sufficiently connected to motor vehicles to fall within the safety exception,” Adina Rosenbaum of Public Citizen said of her group’s pro bono involvement.

More articles by John Kingston

Court decision opens the door for reimplementing Rhode Island truck toll

Credit position of BMO’s transportation clients worsens in the fourth quarter

C.H. Robinson speaks to investors – and Wall Street’s support soars anew

Telematics on the rise in trucking insurance underwriting

Trucking insurance premiums have increased roughly 5% year over year across the board for the past few years. Despite carriers’ attempts to reduce premiums, rates are still increasing, mostly due to the fact that trucking insurance market has not been profitable for 10 of the past 11 years.

Some of the main factors causing insurance companies to lose money are the rise in cargo theft and nuclear verdicts, which have pushed insurers to increase premiums, making coverage costs a larger burden for motor carriers.

Carriers are looking for ways to reduce premiums, and insurance companies are looking to return to profitability. That’s where the wider use of telematics in underwriting for insurance companies comes in. This advancement has enabled carriers to secure competitive rates while encouraging safer driving practices.

When it comes to external factors that affect motor carriers’ premiums, Jackson Alexander, executive vice president of sales at Reliance Partners, said, “Unfortunately for trucking companies, there is almost no correlation between insurance costs and external economic factors like increased fuel prices and decreased revenue per mile.”

Alexander adds: “From an insurance company’s perspective, whether a trucking company was paid $2 per mile or $3 per mile doesn’t really impact their exposure. The chances of being involved in a liability claim, the cost to repair any damage to the insured’s truck and/or trailer, the value of the cargo, etc. are all the same regardless of how much you were paid to run that load. The same can be said for the cost of fuel. This is why trucking has been so tough for the last couple of years – there is pressure from all angles.”

Insurance companies look to mitigate risk and reduce the likelihood of having to pay out a claim. That is where the use of telematics has become so popular. Insurers are looking for data around harsh braking, sharp turns, speeding and following too closely. These factors are analyzed more critically than others because data shows they are frequent causes of truck accidents.

The wide adoption of telematics is predominant in the new space of insurtechs. Insurtechs are insurance companies that heavily utilize technology. They believe that analyzing individual driving behavior through telematics is the most important factor in weighing risk.

“Some insurtechs, HDVI and Nirvana for example, do a holistic look back at the last 90 days of telematics data prior to even offering an insurance quote,” Alexander said. “If you are not willing to share your historical telematics data, you aren’t eligible for a quote from them.”

“While it’s not a guarantee that using an insurance provider that incorporates telematics in their underwriting will reduce a trucking company’s premiums right away, there are several insurtechs out there that are offering aggressive rates,” he says. “They believe the additional data points they have from the telematics gives them a leg up on insurance carriers who rely more on traditional sources of underwriting information (loss run reports, CSA scores, driver records, etc.) and allows them to better price risk. Of course, even if the telematics data is favorable, other red flags to an insurance company could still cause insurance rates to rise.”

The adoption of telematics in insurance underwriting represents a critical step toward addressing the challenges facing the trucking insurance industry. For motor carriers, the integration of telematics offers an opportunity to control rising insurance costs while fostering a culture of safety and efficiency. Meanwhile, insurers can use telematics to build more sustainable business models, ensuring the long-term viability of coverage for the trucking sector.

Click here to learn more about Reliance Partners.

Growth in air cargo demand to decelerate in 2025, IATA says

Two large cargo jets at an airport terminal on a sunny day.

Air cargo volume growth will be halved in 2025, but it will still be a good year for carriers behind continued ocean shipping delays, tight freighter capacity and strength in cross-border e-commerce, the International Air Transport Association forecast.

Cargo volumes are expected to reach 80 million tons, a 5.8% increase from 2024, the trade association said. Cargo demand this year has grown year over year between 10% and 13%, depending on whether it is measured by traffic (cargo ton kilometers) or tons, with the consensus growth rate at 12%. Volumes during the third quarter were second only to the fourth quarter of 2021, when the coronavirus pandemic supercharged airfreight shipping.

The growth projection closely aligns with recent predictions by other market watchers. Freight data provider Xeneta recently said air cargo demand will grow 4% to 6% next year, while capacity increases in the 4% to 5% range. Consultancy Rotate pegs demand growth at about 4%. And logistics giant DSV suggested air cargo growth could be flat

“It should also be noted that the 2024 year-on-year growth rates have been off an overall weak 2023 market. So sustaining these double annual growth rates is going to become just a little bit harder,” said IATA economist Ghislaine Lang during an online media briefing last week.

The current fourth quarter is on track for a record high. The only reason it doesn’t appear as a normal peak season leading to holiday shopping events is that volumes have been strong all year, without any seasonal ebbs. In other words, demand this quarter could reach levels not seen since the pandemic-fueled boom in 2021 but sequentially since the summer upward activity has been less pronounced. 

Industry analysts say pricing has remained rational in the face of heavy demand because businesses have been proactive about moving shipments ahead of the usual crunch time and executing short-term contracts for guaranteed space instead of booking on demand. 

IATA forecast that air cargo traffic, a measure of combined weight and distance flown, for the full 2024 will grow 11.8% and flirt with the all-time high. 

IATA’s outlook calls for member passenger and cargo airlines to achieve cargo revenue of $157 billion in 2025, up 5.4% from the current year. At that level, cargo will represent 15.6% of airlines’ total revenues compared to 12% in 2019. It said average yields should remain stable at 30% above pre-pandemic levels. 

During the coronavirus pandemic, freighters became the dominant form of air cargo as passenger aircraft were largely sidelined. The ratio of freighter to belly traffic has since normalized to about 55/45 with the full recovery of global air travel, but demand for dedicated widebody freighters exceeds capacity as factory-built and converted freighters face production delays. 

Most of the imbalance is in the trans-Pacific trade lane where the share of dedicated freighter capacity (89%) is higher today than at the height of the pandemic and belly capacity between the U.S. and China is still low because of diplomatic disputes. As lower-deck capacity moves away from China, all-cargo airlines have moved assets from other regions to the Asia-Pacific and the center of e-commerce activity. 

Direct-to-consumer e-commerce shipments have been the primary driver of air cargo growth in recent years, with muted growth in other commodities. Experts attribute more than 50% of air cargo volumes out of Asia this year to e-commerce. The influx of large online marketplaces, executing direct-to-consumer fulfillment strategies from China, has elbowed out more traditional freight like apparel, electronics and automotive parts, and influenced the upward move in yields. The traditional B2B airfreight market is likely to rebound next year, supported by demand for semiconductors to power AI, advanced computer processing and electric vehicles, freight data provider Xeneta predicts in its 2025 air cargo outlook.

Global yields in October were about 50% higher than in 2019 and up 11% year over year, primarily because of rates on westbound routes out of Asia and the Middle East to Europe and the Americas. The strengthening of average rates led IATA to forecast a smaller-than-expected decline of -3.5% for 2024 and flat yields for 2025 – but still one-third above pre-pandemic levels. 

(Airlines will achieve $157 billion in cargo revenue next year, up 5.4% from the expected total this year. (Photo: Jim Allen/FreightWaves)

The air logistics sector has also benefited from businesses pivoting to air transport because of attacks pushing container vessels away from the Suez Canal and around Africa. Red Sea diversions continue to result in delays and are putting upward pressure on ocean rates on key trade corridors, with global spot prices up 200% year over year. Escalation in ocean rates has narrowed the price gap with airfreight, which is now only five times more expensive than ocean shipping versus 10 to 15 times more expensive historically.

Demand has been strong on all trade corridors, with some growth on secondary lanes attributed to logistics providers routing goods through the Middle East, Africa and Europe to take advantage of transshipment options rather than simply using trans-continental options, said Lang.

Meanwhile, aircraft cargo capacity continues to grow but at a slower pace than demand. With China fully reopening borders and passenger airlines resuming full international schedules, aircraft cargo capacity will end the year up 9.6% from 2023. Next year, capacity growth will decelerate to 6.4%, IATA said. The way the forecasts stack up suggests there could be more capacity entering the market than demand, which could put downward pressure on rates.

The overall economy remains favorable for air cargo, with the World Trade Organization predicting merchandise trade growth of 3% (on par with GDP) in 2025, up from 2.7% this year. But the growth trend could be impacted by several gathering storm clouds. 

U.S. President-elect Donald Trump has already threatened widespread tariffs, which is likely to trigger retaliation from other countries. A trade war will be inflationary and dampen consumer spending, economists say.  Meanwhile, an increased regulatory focus on import security and duty-free e-commerce shipments could also act as a drag on international air shipping.

Industry stakeholders will be watching how airfreight demand responds if ocean shipping rates drop back to pre-pandemic levels, especially if the Red Sea conflict is resolved, or if e-commerce respond to regulatory pressure by moving to a hybrid model based on a mix of direct fulfillment by air and pre-stocking forward warehouses in the U.S. and other markets. 

Conversely, the air logistics sector could see a spike in shipments to the United States if a threatened strike by dockworkers shuts down U.S. East Coast and Gulf Coast ports, forcing businesses to make alternative import/export plans for high-value goods and critical industrial components. 

Airline industry outlook as a whole

The overall airline industry is expected to hit the $1 trillion revenue mark next year after rising 6.2% to $965 billion this year, a gain that will help deliver net profit of $36.6 billion. That’s an improvement from the estimated $31.5 billion net profit in 2024 and 3.3% margin, IATA said. Average net profit per passenger is anticipated to be $7.

Expenses are expected to grow by 4% to $940 billion, before interest and taxes. 

The outlook for better financial performance is a function of lower jet fuel prices and efficiency gains. The price of jet fuel fell to $70 per barrel in September for the first time since the start of the Russia-Ukraine War nearly three years ago, due to oversupply by the United States. IATA said jet fuel is expected to average $87 a barrel (down from $99 a barrel in 2024), based on a jet fuel crack spread of $12 per barrel and a crude oil price of $75 per barrel (Brent). As a result, airlines’ cumulative fuel spend is expected to be $248 billion, a decline of 4.8% despite a 6% rise in the amount of fuel expected to be consumed. Fuel is expected to account for 26.4% of operating costs in 2025, down from 29% in 2024.

Further gains are being stymied by supply chain troubles at aircraft and engine manufacturers, which is limiting airlines’ ability to modernize or grow their fleets and driving up costs in areas such as aircraft leasing and maintenance. 

Net profitability will also be squeezed as airlines are expected to exhaust their tax losses carried forward from the pandemic era, leading to an increase in tax rates in 2025, IATA said.

A primary area for cost escalation is labor as pilots, flight attendants and mechanics achieved sizable wage increases in recent contracts. In 2025, labor costs are expected to total $253 billion, up 7.6% from 2024. With productivity gains, however, average labor unit costs are likely to rise by only 0.5% in 2025 compared to 2024.

Overall nonfuel unit costs rose 1.3% in 2024 for a total of $643 billion. Nonfuel unit cost increases in 2025 are expected to inch up to $692 billion.

The return of Trump as president is creating uncertainty for the airline sector. On the one hand, tariffs could lead to slower economic growth, but a more business-friendly Trump approach to regulation and taxation could help U.S. carriers. It is also unclear whether a Trump administration will support production incentives for sustainable aviation fuel.

Profits “will be hard-earned as airlines take advantage of lower oil prices while keeping load factors above 83%, tightly controlling costs, investing in decarbonization, and managing the return to more normal growth levels following the extraordinary pandemic recovery. All these efforts will help to mitigate several drags on profitability which are outside of airlines’ control, namely persistent supply chain challenges, infrastructure deficiencies, onerous regulation and a rising tax burden,” said IATA Director General Willie Walsh.

“The buffer between profit and loss, even in the good year that we are expecting of 2025, is just $7 per passenger. With margins that thin, airlines must continue to watch every cost and insist on similar efficiency across the supply chain — especially from our monopoly infrastructure suppliers who all too often let us down on performance and efficiency,” he said.

Click here for more FreightWaves/American Shipper stories by Eric Kulisch.

Analysts predict air cargo bull market will cool 50% in 2025

‘No big bang’ for peak season air cargo business

More challenging capacity conditions ahead of the holidays

This week’s FreightWaves Supply Chain Pricing Power Index: 35 (Shippers)

Last week’s FreightWaves Supply Chain Pricing Power Index: 35 (Shippers)

Three-month FreightWaves Supply Chain Pricing Power Index Outlook: 40 (Shippers)

The FreightWaves Supply Chain Pricing Power Index uses the analytics and data in FreightWaves SONAR to analyze the market and estimate the negotiating power for rates between shippers and carriers.

This week’s Pricing Power Index is based on the following indicators:

Volumes continue to recover, but challenged year over year

The truckload market has recovered from the Thanksgiving holiday, but with less than two weeks until Christmas, the rebound is likely to be short-lived. Throughout December, tender volumes have actually held up better than previous years, but it appears it has to do with the timing between Thanksgiving and Christmas this year compared to previous years.

SONAR: Outbound Tender Volume Index — Seasonality View: 2024 (white) and 2023 (pink)
To learn more about SONAR, click here.

The Outbound Tender Volume Index (OTVI), a measure of national freight demand that tracks shippers’ requests for trucking capacity, has continued to rebound from the Thanksgiving holiday, increasing by 7.46% over the past week and is up over 2% in the past month. Compared to this time last year, the OTVI is still down 5.29%. Part of the reason for the limited growth in the OTVI has been the growth in loaded intermodal volumes, which are up 11% year over year.

Volumes across the mileage band are continuing to rebound from the Thanksgiving holiday, but only the local length of haul, or loads moving less than 100 miles, has seen volumes grow over the past year. Volumes for local length of haul are up 3.12% year over year, while long-haul volumes or loads moving 800 miles or more are down nearly 10% y/y.

SONAR: Contract Load Accepted Volume – Seasonality View: 2024 (white) and 2023 (pink)
To learn more about SONAR, click here.

Contract Load Accepted Volume (CLAV) is an index that measures accepted load volumes moving under contracted agreements. In short, it is similar to OTVI but without the rejected tenders. Looking at accepted tender volumes, the recovery is far less pronounced, rising 6.9% over the past week, driven by an upward movement in tender rejection rates. Compared to this time last year, CLAV is down 6%.

November’s retail sales data is set to be released later this week, but early reads on spending in November were strong. Bank of America’s card spending report showed that spending was up 0.6% year over year in November. Even with the late Thanksgiving holiday that pushed Cyber Monday into December, expectations are for sales to grow by 0.5% m/m.

SONAR: Outbound Tender Volume Index – Weekly Change
To learn more about SONAR, click here.

As volumes continue to rebound out of the Thanksgiving holiday, the vast majority of the markets in the country have higher volumes week over week. Of the 135 freight markets tracked within SONAR, 108 have seen tender volumes increase over the past week.

Volumes in the largest markets in the country have increased fairly significantly over the past week. In Atlanta, tender volumes have increased by over 10% w/w while farther up the East Coast, volumes out of Harrisburg, Pennsylvania, increased by 8.1%.

In the center of the country, it was more of a mixed bag as tender volumes out of Dallas increased by 9% but volumes out of Chicago fell by 12.6% week over week.

On the West Coast, tender volumes out of Los Angeles increased by 9.43% w/w, driven by significant increases in volumes ranging from 100 miles to 800 miles (short haul, midhaul and tweener lengths of haul). Long-haul volumes out of Los Angeles increased by 5.76% over the past week and are up 7.6% y/y.

SONAR: Van Outbound Tender Volume Index (white, right axis) and Reefer Outbound Tender Volume Index (green, left axis)
To learn more about SONAR, click here.

By mode: The dry van market is leveling off at a higher level than it was in November. Over the past week, the Van Outbound Tender Reject Index increased by 7.3%. Some of that increase is a result of noise around the Thanksgiving holiday, but dry van volumes are up 1.7% over the past month, which shows there has been some growth since early November. Still, van volumes are down 5.8% year over year.

The reefer market continues to show it is holding up quite well as volumes are now near the highest level of the year. The Reefer Outbound Tender Volume Index has increased by 7.4% over the past week and is 5.8% higher than it was a month ago. Reefer volumes are up 7.5% year over year, suggesting that the reefer market is firmly out of its freight recession.

Rejection rates rebound, could reach double digits in coming weeks

After a brief decline following the Thanksgiving holiday, tender rejection rates are back on the rise. That is expected given the timing of the holidays and primes the next two weeks for a fairly significant increase, likely pushing double digits as tender rejection rates nearly doubled in the final two weeks in both 2019 and 2023.

SONAR: Outbound Tender Reject Index – Seasonality View: 2024 (white), 2023 (pink) and 2019 (orange)
To learn more about SONAR, click here.

Over the past week, the Outbound Tender Reject Index (OTRI), a measure of relative capacity, rose by 50 basis points to 6.48%. The OTRI is 253 basis points higher than it was this time last year, a sign that the market is tighter now than it was then. While tender rejection rates remain below 2019 levels, the increase in tender rejection rates has been steady as opposed to only around the holidays, which suggests that 2025 is likely to be a tighter environment than the past two years.

SONAR: Outbound Tender Reject Index – Weekly change
To learn more about SONAR, click here.

The map above shows the Outbound Tender Reject Index — Weekly Change for the 135 markets across the country. Markets shaded in blue and white are those where tender rejection rates have increased over the past week, whereas those in red have seen rejection rates decline. The bolder the color, the more significant the change.

Of the 135 markets, 88 reported higher rejection rates over the past week, up from the 50 that saw tender rejection rates rise in last week’s report.

The largest increases in rejection rates are stemming from fairly small markets in the Northeast, so not areas of the country that tend to impact the overall freight market. The Harrisburg, Pennsylvania, market, the largest freight market in the Northeast, did see tender rejection rates increase by 195 basis points over the past week.

Tender rejection rates in the Southern California markets of Los Angeles and Ontario increased by 68 basis points over the past week, rising back above 5%, which is an important level for the heartbeat of the U.S. freight economy.

SONAR: Van Outbound Tender Reject Index (white), Reefer Outbound Tender Reject Index (green) and Flatbed Outbound Tender Reject Index (orange)
To learn more about SONAR, click here.

By mode:  The dry van market is waking up as tender rejection rates have now surpassed Thanksgiving holiday levels, though they are still below the Fourth of July holiday peak. The Van Outbound Tender Reject Index increased by 63 basis points over the past week to 5.87%, less than 100 basis points from the YTD high set July 2. Dry van tender rejection rates are 213 basis points higher than they were this time last year.

The reefer market is still tighter than it was this time last year, but reefer tender rejection rates have retreated over the past week. The Reefer Outbound Tender Reject Index has fallen by 69 basis points over the past week to 14.2%. Compared to this time last year, reefer tender rejection rates are more than double, up 751 bps. 

The Federal Open Market Committee meets this week for the final time in 2024, and expectations are for the third consecutive cut to the federal funds rate. The first two interest rate cuts haven’t had a significant impact on the housing market, but flatbed tender rejection rates have moved higher since the first cut. The Flatbed Outbound Tender Reject Index fell by 69 bps over the past week to 12.96%, but even so flatbed rejection rates are 313 bps higher than they were this time last year.

Spot rates rebound to highest level of the year

As the end of the year approaches and capacity is coming off the road, spot rates are continuing to move higher, setting new year-to-date highs seemingly daily. Much of the movement in recent weeks can be attributed to seasonal pressures, but spot rates have largely been moving higher since the beginning of October. There will likely be downward pressure on spot rates at the beginning of 2025, again driven by seasonal pressures, but the higher spot rates move in the next two weeks, the higher the baseline likely to be set to start 2025.

SONAR: SONAR National Truckload Index – Linehaul Only (white, right axis) and Initially Reported Van Contract Rate (green, left axis)
To learn more about SONAR, click here.

The National Truckload Index – which includes fuel surcharge and various accessorials – rebounded over the past week, rising 14 cents per mile to $2.52, the highest level of the year. The NTI is now 24 cents per mile higher than it was this time last year. The linehaul variant of the NTI (NTIL) – which excludes fuel surcharges and other accessorials – matched the overall increase in the NTI, rising 14 cents per mile to $1.97. The NTIL is 32 cents per mile higher than it was this time last year, a sign that diesel fuel has put deflationary pressure on all-in spot rates as there is a gap between the y/y increase in the NTI and the NTIL. 

Initially reported dry van contract rates, which exclude fuel, have broken out of the high side of the range that they have been in throughout much of 2024. This breakout is likely a result of seasonal pressures, though contract rates have actually been moving higher since the end of the second quarter. The initially reported dry van contract rate comes in at $2.37 per mile, an increase of 3 cents per mile from the previous week and 5 cents per mile y/y.

SONAR: RATES.USA
To learn more about SONAR, click here.

The chart above shows the spread between the NTIL and dry van contract rates is trending back to pre-pandemic levels. The spread remains wide, but with the recent stronger positive momentum in spot rates compared to contract rates, the spread has continued to narrow. Over the past week, the spread between contract and spot rates narrowed by 3 cents per mile. It is 22 cents narrower than it was this time last year.

SONAR: SONAR TRAC rate from Los Angeles to Dallas.
To learn more about SONAR, click here.

The SONAR Trusted Rate Assessment Consortium spot rate from Los Angeles to Dallas was back on the rise over the past week. The TRAC rate from Los Angeles to Dallas increased by 4 cents per mile to $2.75, erasing some of last week’s decline. Spot rates along this lane are 28 cents per mile above the contract at present, which is why rejection rates out of Los Angeles are on the rise, now above 5%.

SONAR: SONAR TRAC rate from Atlanta to Chicago.
To learn more about SONAR, click here.

From Chicago to Atlanta, spot rates have been volatile, but they really haven’t moved significantly since the beginning of November. The TRAC rate for this lane decreased over the past week, falling by 1 cent per mile to $2.69. Spot rates are 9 cents per mile below the contract rate, but that spread is at a level where spot rates offer optionality for carriers and can make the market feel tighter for shippers than it was just a few months ago when the spread was in the 40-cent range.

Kal Freight’s bankruptcy reveals massive fraud accusations

In a stunning turn of events, California-based trucking company Kal Freight Inc. has filed for Chapter 11 bankruptcy protection, unveiling a web of fraudulent activities that have sent shockwaves through the industry. The company faces serious allegations of financial misconduct and asset mismanagement.

Who is Kal Freight?

According to a filing with the Federal Motor Carrier Safety Administration, Kal Freight employs 600 drivers and has 580 power units. The company was founded in 2014 and has locations in California, Texas, New Jersey, Indiana, Tennessee, Georgia, Arizona and Arkansas.

Chapter 11 and fraud accusations

Kal Freight filed Chapter 11 with nearly $325 million in long-term debt. Unsecured claims total at least $24 million, according to court filings. Among the largest unsecured creditors are CIMC Reefer Trailer Inc., owed more than $12 million; Continental Tire, owed more than $1 million; and Cargo Solution Express, owed more than $950,000.

However, court documents reveal a far more troubling picture of Kal Freight’s operations. Daimler Truck Financial Services USA, LLC, the company’s largest vehicle finance lender, has uncovered evidence of massive fraud perpetrated by Kal Freight against its creditors.

The $16.8 million ghost trailers

In a shocking revelation, Daimler alleges that Kal Freight fraudulently obtained approximately $16.878 million to purchase 164 trailers from Vanguard. However, the company never actually paid Vanguard or received the trailers. Instead, Kal Freight somehow managed to provide Daimler with fraudulent certificates of title for these non-existent trailers, complete with recorded liens. To add insult to injury, Kal Freight continued to make monthly payments on this loan as if the trailers had been purchased and were in their possession.

The $20 million Canadian collateral shuffle

Daimler’s investigation has also uncovered that approximately 366 trailers serving as collateral for their loans were illegally transferred to Big Rig Trailers & Leasing, Inc., a Canadian affiliate of Kal Freight owned by the same individual, Mr. Singh. These trailers were subsequently sold, leased, or pledged to third parties in Canada, potentially creating a complex legal situation where innocent third parties may claim senior interest in the collateral. This unauthorized transfer could result in an additional $20 million loss for Daimler.

The phantom sales scheme

In yet another fraudulent maneuver, Kal Freight reportedly transferred numerous trucks and trailers that were part of Daimler’s collateral to its affiliate, Kal Trailers & Leasing Inc., a truck and trailer dealer. Kal Trailers then sold these units to third parties, allegedly free and clear of Daimler’s liens, under the guise of ordinary business transactions. Daimler never received the proceeds from these unauthorized transfers.

The extent of Kal Freight’s fraudulent activities has placed the recovery of over $40 million in Daimler loans in serious jeopardy. In light of these revelations, Daimler initially had no interest in continuing its business relationship with Kal Freight during the bankruptcy proceedings.

However, in a bid to salvage the situation, Kal Freight has agreed to remove Mr. Singh as a director of each debtor company and replace him with unaffiliated independent directors. Additionally, the company has promised to retain Brad Sharp as the chief restructuring officer, granting him complete control over business operations, including all books, records and financial transactions.

These commitments have led Daimler to cautiously agree to the debtors’ use of certain retained collateral, consisting of 543 trucks and 10 trailers, during the bankruptcy proceedings. This agreement is subject to strict terms and conditions outlined in the Daimler agreed adequate protection order.

Looking ahead

As the bankruptcy proceedings unfold, all eyes will be on Kal Freight and its newly appointed independent directors and CRO. The trucking industry and creditors alike will be watching closely to see how this complex web of fraud is untangled and what consequences will follow for those involved in these deceptive practices.