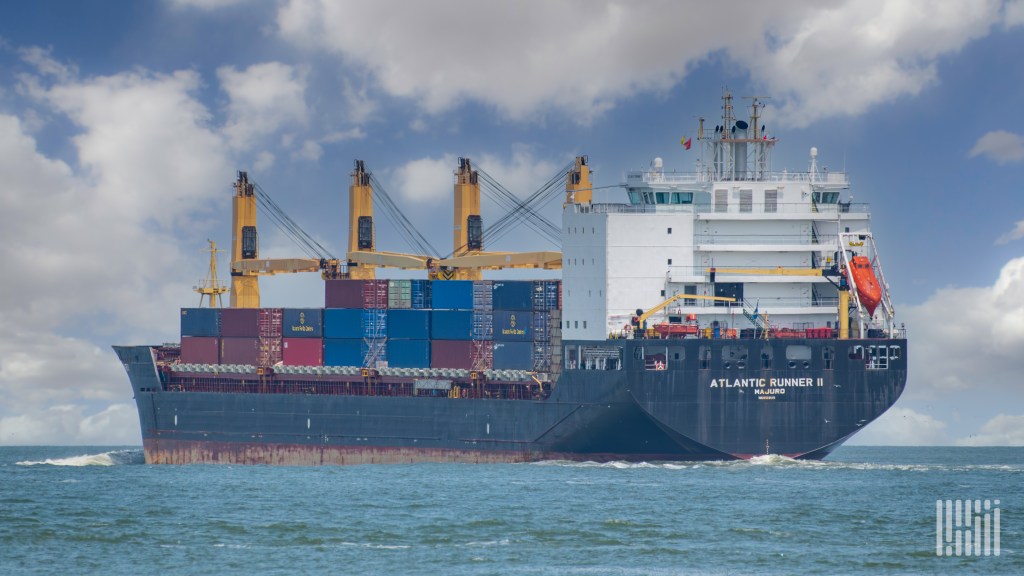
Sharp turn ahead for US transportation policy?

DOT Headquarters in Washington, DC

WASHINGTON — The U.S. Department of Transportation is planning a five year strategy update for improving the nation’s transportation system that’s expected to take a sharp turn away from the previous plan in how DOT prioritizes freight.

Congress requires DOT and other federal departments to update a multi-year strategic plan every four years. The plan for fiscal years 2026-2030, which the department wants to publish in February, is seeking public comment on four questions:

  • What strategies or priorities should the DOT adopt to improve the nation’s transportation systems?
  • How should DOT measure progress towards those priorities?
  • What emerging challenges or opportunities in transportation warrant additional DOT activities, investments, research, or analysis?
  • How can DOT best create value for its activities with stakeholders?

The Covid-19 pandemic gave freight goods movement a more prominent role in the 2022-2026 strategy under the Biden Administration than it had under the 2018-2022 plan under the first Trump administration because of the need to address supply chain disruptions.

But the previous strategy also linked freight and supply chain resiliency to broader themes such as climate change, sustainability, and social equity – and the administration has been clear about deemphasizing or canceling such policies.

Transportation Secretary Sean Duffy announced last month, for example, that the administration will not enforce diversity, equity and inclusion (DEI) policies or climate goals when awarding infrastructure grants.

“The public wants to see their hard-earned dollars going towards safety and efficiency standards – not woke DEI or American energy-killing ideas,” Duffy said in a press release.

The administration separately is updating a national freight strategy to address new policy priorities, including the effects of emerging technology and regulatory barriers to improving freight flow. Public comments on that information request are due by Thursday.

Related articles:

Click for more FreightWaves articles by John Gallagher.

China volumes, tariff anxiety helps surging US container imports challenge ’22 record

Containerized imports through U.S. ports surged to more than 2.6 million twenty foot equivalent units in July, as peak-season demand and tariff pressures left volumes just short of the monthly record.  

China import volumes also staged a recovery through the busiest American ocean container gateways.

Volume totaled 2,621,910 TEUs, up 18.2% from June and 2.6% higher than July 2024, according to data compiled by Descartes Datamyne, and just 555 TEUs short of the all-time record set in May 2022.

Descartes cited strong seasonal demand and suspected frontloading of shipments as importers maneuvered amid trade policy shifts.

The report termed as “mild” port transit delays accompanying the sharp growth in import volumes from the previous month, “indicating that infrastructure is continuing to perform under elevated volumes.”

China imports rocketed to 923,075 TEUs, up 44.4% m/m and the highest level since January. China’s share of U.S. imports was 35.2% in July, from 28.8% in June, but below the 41.5% peak seen in February 2022. 

Imports were clearly pressured by the Trump administration’s end to the de minimis exemption allowing imports under $800 to enter duty-free, as well as ongoing uncertainty over tariffs. Flat-rate fees of $80–$200 per item are expected to be enacted for less expensive imports. The report also credited the recovery to seasonal demand and pull-forward of shipments by importers ahead of the mid-October expiration of the 30% temporary tariff rate on Chinese imports.

Tariffs ranging from 10% to 41% were enacted by the U.S. on August 1, covering more than 60 countries including the European Union, Canada, Japan, and South Korea, while India was hit with a 25% levy as of August 7. A universal duty of 50% was set for copper.

Container volumes increased 19.3% compared to pre-Covid July 2019, the report said, indicating long-term structural growth in import demand. 

Import volumes in July were up 18.2% to 404,235 TEUs from June, above the 11.2% month-over-month gain in 2024 and the strongest m/m since early 2021.The report pointed out that “tariff timing, not just seasonal demand cycles, is increasingly shaping U.S. import volumes.” 

The top 10 U.S. ports saw container volumes improve 20.4% m/m month-over-month, a net gain of 379,578 TEUs with substantial increases at both West Coast and East/Gulf Coast ports.

Miami led all major ports with a 35.5% monthly improvement, followed by Houston, 34.2%, Oakland, 31.3%, and Savannah, 25.2%. The busiest U.S. gateways, Long Beach and Los Angeles, were up 24.1% and 18.0%, trailed by New York-New Jersey, 14.7%, and Charleston and Norfolk, each at 12%. Tacoma volumes gained by just 1.7%.

Punitive fees on China-linked vessels set to take effect later this year are leading some lines to shuffle tonnage, which may have some effect as container flows as carriers bypass secondary ports and shippers leverage transshipments through other hubs as they re-configure supply chains.

Despite the robust July increase, China imports were off 9.8% from the all-time high set in July 2024 of 1,022,913 TEUs.

Descartes said the broad recovery by product category showed that long-term sourcing shifts are a work in progress.

Furniture and bedding, plastics, and machinery remained the top three categories by volume, accounting for more than 38% of China-origin TEUs. Other segments included toys and sporting goods, electric machinery, and vehicles and parts.

Elevated tariffs, intensified customs enforcement, and the June enactment of a 40% U.S. tariff on transshipped exports from Vietnam make a forecast uncertain. “Without a deeper tariff rollback or broader trade agreement, China’s share of U.S. containerized trade may face renewed pressure,” the report stated. 

Imports from China showed substantial increases at the top 10 U.S. ports, by 262,126 TEUs overall, a 42.9% m/m gain. Houston led all ports with a 122% spike, followed by Savannah, 90.2%, New York-Newark, 69.5%, Charleston, 78.9%, Norfolk, 51.4%, and Oakland, 53.9%. The U.S. ports closest to China – Los Angeles, 33.6%, and Long Beach, 26.7%, – also recovered well, while Tacoma, 10.2%, and Seattle, 14%, though lesser import destinations, saw gains. The report said broad-based growth after months of contraction underscores the change in trans-Pacific routing strategies to match fluid policy signals.

Find more articles by Stuart Chirls here.

Related coverage:

Retailers: Tariff-battered import volumes to be 5.6% weaker in 2025

Nothing can stop falling trans-Pacific container rates: Analyst

Savannah containers post best FY since pandemic

Maersk raises guidance on higher Q2 volumes 

Creating a Load History Tracker That Improves Rate Negotiations

In trucking, data is power. If you’re running loads without recording what they pay, what they cost you, and how they perform over time, you’re operating with a blindfold on. Brokers come to the table armed with historical lane data, fuel indexes, and national averages. If all you have is a rough memory of what you earned last time, you’re not negotiating—you’re gambling.

A load history tracker isn’t just a spreadsheet. It’s a weapon. It’s how smart carriers take control of pricing, push back on weak offers, and make better decisions about which loads to accept or decline. When you know your numbers, you stop relying on broker narratives. You start writing your own.

Let’s break down exactly what to track, how to track it, and how to use that data to negotiate from a position of strength.

Why a Load History Tracker Matters More Than You Think

Every load you haul leaves a trail of data: mileage, rate, fuel cost, accessorials, wait times. But most small fleet owners let that trail vanish. They run the load, cash the check, and move on. That might work in a perfect market. But when rates tighten—and they always do—you need leverage. Your historical data is that leverage.

Here’s what load tracking can tell you:

  • Which lanes are truly profitable (not just gross pay, but net after expenses)
  • Which brokers consistently underpay
  • When seasonal fluctuations boost or tank rates
  • Which loads burn time, fuel, or your drivers’ patience
  • How your actual cost-per-mile compares to your target margins

Brokers already know this about your lanes. If you don’t, you’re always negotiating from behind.

The 10 Core Data Points to Track

To keep this tactic, let’s walk through exactly what you should be recording. This isn’t complicated. But it has to be consistent.

  1. Load ID and Date Label every load. Use dates or invoice numbers. This lets you sort by week, month, or season—helping spot trends over time.
  2. Broker or Shipper Name Tracking which companies you’re hauling for shows you patterns. Are some always paying under market? Are others easier to work with? Use this to build a list of partners worth prioritizing.
  3. Origin and Destination Zip code or city pairs help you identify lanes that work well, take too long, or come with unique challenges. You’ll also begin to see which corridors consistently underperform.
  4. Linehaul Revenue This is the base rate for the job—no extras. It’s your starting point for rate-per-mile and profitability calculations.
  5. Accessorials These include detention, layover, driver assist, TONU (truck ordered, not used), and others. Don’t overlook them. They add up, and they reveal how much hassle a broker or shipper brings.
  6. Miles (Loaded + Deadhead) Track both. Many carriers forget that deadhead miles cost money too. Profitability comes from understanding total movement, not just loaded trips.
  7. Fuel and Toll Costs Record actual costs. A load might pay well but eat through your fuel budget or stack up tolls. Real profit lives in the net numbers.
  8. Wait Time and Dock Delays If a particular location always ties you up, that’s time lost. Time is money. Note it, and factor it into future negotiations or avoid that shipper altogether.
  9. Total Time on Load Track start to finish. A load might seem profitable until you realize it consumed 15 hours of your driver’s day.
  10. Net Profit Per Load Your final scorecard. Revenue minus all costs. This is the number that tells you if the load was truly worth it.

What Many Carriers Miss in Negotiations

Here’s how carriers lose ground:

  • Quoting rates based on memory
  • Forgetting what a lane paid last quarter
  • Failing to factor in true costs
  • Accepting offers based on emotion or desperation

Let’s say a broker offers $2.10/mile. You take it because it feels better than last week’s $1.95. But what if your tracker shows that same lane paid $2.65 consistently in March? Without that data, you’re just guessing. With it, you’re negotiating.

You might think, “But I don’t have time to track every load.” You don’t have time not to. The carriers who survive downturns and scale smart are the ones with the discipline to track their operations.

Using Your Tracker to Anchor Negotiations

When you’re on a rate call, facts win.

Say this:

“I’ve run this lane six times this year. My average net profit is $1.87/mile after all expenses. Based on today’s fuel prices, I need at least $2.25 to make it work.”

That’s not a demand. That’s data-backed negotiation. It’s how you stand out to brokers and build respect in conversations.

Use your tracker to:

  • Push back on weak offers with evidence
  • Justify your rates with numbers
  • Spot when a broker is lowballing below past norms
  • Walk away from unprofitable lanes confidently

Use Your Tracker to Create a Personal Rate Sheet

After 90 days of consistent tracking, your spreadsheet becomes a custom rate sheet. You’ll know exactly what to quote on your top 10 lanes. You’ll see your RPM floor, your ideal rate, and what brokers are paying over time.

Imagine pulling up a lane and seeing:

  • Average pay: $2.60
  • Avg. cost: $1.75
  • Net margin: $0.85

Now you’re not guessing if the load works—you know.

Your data isn’t just about the past—it’s a forecast. You’ll notice that:

  • Produce season raises rates in the Southeast
  • Q4 retail spikes pay in the Midwest
  • January dips in outbound freight from certain ports

With this info, you can:

  • Avoid lanes that slump during slow months
  • Lean into lanes that surge during seasonal windows
  • Shift your schedule and planning to maximize margins

Use It to Vet Brokers and Shippers

Over time, you’ll build a list of green-light and red-flag partners:

  • Broker A pays fair but slow
  • Broker B pays fast but low
  • Shipper X always has delays
  • Shipper Y runs like clockwork

Use that to:

  • Prioritize repeat business with high-value partners
  • Avoid wasting time on known problem accounts
  • Streamline your week with fewer surprises

Simple Tools That Work

You don’t need a fancy app. Here’s what works:

  • Google Sheets or Excel: Free, flexible, and shareable
  • Columns: Load ID, Date, Broker, Origin, Destination, RPM, Miles, Fuel, Accessorials, Net Profit, Notes
  • Color Coding: Use green/yellow/red for quick performance scans
  • Monthly Summary Tab: Track average rates, miles, profit, and costs over time

Best Practices to Keep It Going

  • Update after every load—not weekly, not later
  • Review data monthly to see trends
  • Archive loads quarterly for long-term benchmarking
  • Back up your file (Google Drive or Dropbox)

Discipline beats tools. The most advanced software won’t help if you don’t use it. The simplest tracker will transform your business if you update it daily.

Final Word

If you’re tired of negotiating with no leverage, tired of lowball offers, and tired of wondering why the same load paid more last time—this is your next move.

Build your tracker. Use it after every run. Let the data speak for you.

You don’t need to guess anymore. You don’t need to accept every load. You don’t need to settle for scraps when you’re doing premium work.

What you need is a clear, documented record of what’s working, what’s not, and what you should be paid. That’s what separates professionals from participants.

Because in this business, you’re either running your operation with numbers or being run over by someone else’s.

Know your lanes. Know your worth. And never negotiate blind again.

UPS closing operations in three states as downsizing spreads

A UPS warehouse worker checks packages on a conveyor belt.

(Updated at 2 p.m. ET)

UPS continues to lay off workers as it moves forward with a strategy of consolidating parcel distribution facilities to reduce excess capacity. The latest job cuts are in Dallas, Texas; Pocahontas, Arkansas; and Wilmington, Ohio.

The integrated parcel logistics company notified the Texas Workforce Commission last week that it plans to release 62 workers at its Dallas facility on Monroe Drive. Layoffs began Aug. 5. 

A UPS (NYSE: UPS) spokeswoman told The Dallas Express, which first reported on the workforce reduction, that the jobs were expendable because the company is eliminating a day shift at the facility as part of a major network reconfiguration aimed at eliminating 200 sortation centers over five years and deploying automation to improve productivity.

The delivery giant on Aug. 8 closed a parcel facility in Pocahontas, Arkansas, spokeswoman Karen Tomaszewski Hill told FreightWaves. She did not have information on how many jobs are impacted.

“We are working to place as many employees as possible in other positions. We will work with those who may be impacted throughout the process to provide support,” she added.

Meanwhile, the News Journal in Wilmington is reporting that UPS will close a facility on U.S. Route 68 on Sept. 23 as part of the nationwide culling process, which includes evaluating utilization and automation levels. Packages will instead route through a more modern facility that can process more volume. 

UPS expects most Wilmington employees will transfer to another nearby facility, though the company has not said which one. It’s unknown how many people are employed at the Wilmington, Ohio, location because UPS doesn’t release employee counts for individual facilities, the News Journal said. 

Meanwhile, the Atlanta-based courier laid off 99 workers at a facility in Charlotte in early May, according to a notice filed with the North Carolina Department of Commerce. In July, it disclosed plans to temporarily close a parcel sortation center in New Orleans and lay off 177 personnel.

“While our building footprint is changing, our record of reliable pickup and delivery is not,” UPS said in a June 25 statement.

UPS has seen volume growth stagnate for nearly two years and expects volumes to decrease as it focuses on turning away low-margin business. Company management earlier this year said the decisions to phase out half of its business with Amazon and streamline infrastructure mean it will need 20,000 fewer workers.

The moves come as UPS seeks to eliminate more jobs by offering drivers a voluntary separation package. FreightWaves reported on Saturday that UPS has given van drivers more time to make a decision because the program is undersubscribed so far.

(Correction: An earlier version of this story incorrectly identified a closure in Wilmington, North Carolina. The facility is in Wilmington, Ohio.)

Click here for more FreightWaves/American Shipper stories by Eric Kulisch.

UPS to temporarily shut New Orleans parcel center, dismiss workers

UPS extends buyout offer deadline after low driver interest

UPS posts tepid results amid tariff, restructuring challenges

Teamsters call UPS driver buyout offer ‘paltry’

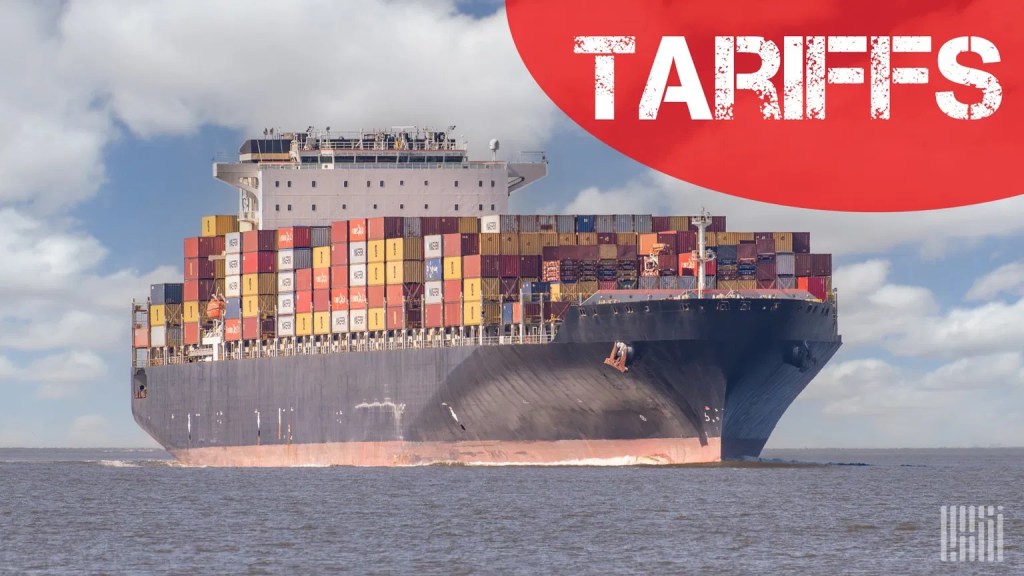
Trump’s tariffs are the ‘new normal’ in global supply chains, expert says

As new ‘reciprocal’ tariffs imposed by the Trump administration are now in force on goods from more than 90 U.S. trade partners, navigating higher duties could be a permanent part of doing business, according to Vinny Licata, head of logistics at Fictiv.

President Donald Trump signed an executive order July 31 to implement a wide range of country-specific tariffs that began on Thursday. 

“Companies are seeing tariffs as the new normal,” Licata told FreightWaves in an interview. “There were some pauses in orders earlier due to uncertainty, but now deals are being finalized, and orders are not being delayed as much. As we see more deals, that certainty will allow customers to understand the cost environment, so they can know the impact of all tariffs.”

The slew of new import levies include 50% for goods from Brazil, 39% for Switzerland, 35% for Canada, 30% for China and Mexico, 25% for India, 20% for Vietnam and Taiwan, 19% for Thailand, 15% for Germany and Japan, and 10% for the United Kingdom. 

While U.S. tariffs are becoming more normalized for logistics professionals, the increased duties are having an impact on imports into the U.S., Licata said.

Fictiv, founded in 2013, offers on-demand procurement services for custom mechanical components parts for the U.S. manufacturing industry. The company has production operations in the U.S., China, India and Mexico, with a total of 400 employees.

“Industries that could be most vulnerable to these tariffs are pharmaceuticals, smartphones, jewelry, textiles, and footwear,” Licata said. “As tariffs become more normalized with all trading partners, we’ll likely see every industry impacted in some way.”

Goods from Mexico received a reprieve from the 25% tariff rate when U.S. and Mexican officials announced a 90-day extension to negotiate a long term trade deal on July 31. 

The 90-day extension means a 25% tariff rate will stay in place for Mexico instead of a 30% levy that would have started Friday. 

However, imported goods covered by the United States-Mexico-Canada Agreement (USMCA) were expected to remain exempt from tariffs.

The White House’s 35% tariffs on imports from Canada will also not be applied to goods that are compliant with the USMCA.

Mexico was the top U.S. trade partner in June at $73 billion, according to Census Bureau data. Canada ranked No. 2 for trade with the U.S. in June at $58 billion, and China ranked third at $28 billion.

Despite the Trump administration’s new tariff policy, nearshoring of manufacturing to the U.S., Mexico and other parts of the Americas is still ongoing, Licata said.

In November 2023, Fictiv opened a production facility in Monterrey, Mexico, aiming to offer more options for on-demand manufacturing services across North America.

“We feel nearshoring was underway over the last few years (due to COVID disruptions), and the tariffs are helping bring some manufacturing back. The Mexico and Canada deals will help accelerate this trend, but there is still a lot of uncertainty about how a deal with those countries will look,” Licata said. 

“Mexico seems to be managing the negotiations more delicately, whereas Canada has been fairly aggressive with their stance. As a result, we’re seeing Trump take a harder view of Canada.  Depending on these deals, then we can see an acceleration in nearshoring if there are proven advantages for companies and more certainty over the longer term.”

Licata said manufacturers looking to source suppliers in the current trade environment should keep an eye on “total landed costs.”

“We’re encouraging customers to stay focused on total landed cost, as true costs vary significantly across regions,” Licata said. “Transparent cost data — including tariffs, transportation, labor, and manufacturing capability — empowers smarter sourcing, especially as trade policies remain unsettled. Tariffs aren’t going away, and companies that understand the full cost picture will be better positioned to navigate uncertainty and gain a competitive edge.”

How to Create a One-Year Growth Map for Your Fleet

Growth doesn’t happen by accident—it happens by design. If you’re running a small trucking business, you already know what’s at stake. You can’t afford to waste time chasing goals you can’t define, or expanding before you’re ready. A growth map keeps you grounded. It breaks down your vision into quarterly targets, then weekly habits, so you’re not just busy—you’re building. Here’s how to create a one-year plan that translates to real traction, not just noise.

Step 1: Define What Growth Looks Like for You

You don’t need someone else’s definition of success. The biggest mistake small carriers make is chasing someone else’s numbers, someone else’s fleet size, someone else’s YouTube story. You need to define what growth means for your business, based on your numbers, your lifestyle goals, and your appetite for risk.

Start with hard questions:

  • How many trucks do I want to run by this time next year?
  • What type of freight am I best suited for—spot or contract?
  • What’s the minimum gross revenue each truck needs to bring in weekly or monthly?
  • Do I want to stay on the road or eventually move into an operations role?
  • Will I need to hire dispatch, safety support, or bookkeeping help to scale?

Write these answers down. Turn them into measurable targets. A “goal” that says “make more money” isn’t a plan—it’s a wish. A goal that says “Add one truck with a direct shipper by Q3” is a plan.

Step 2: Conduct a Baseline Audit

Before you can plan forward, you need to know exactly where you stand. That’s what a baseline audit is for. This isn’t guesswork. This is you pulling the numbers that drive your business.

Here’s what to review from the past 90 days:

  • Revenue per truck per week
  • Cost per mile (including fuel, insurance, maintenance, IFTA, etc.)
  • Deadhead rate and out-of-route miles
  • On-time delivery percentage
  • Load board vs direct customer ratio
  • Maintenance cost per unit
  • Fuel efficiency per truck
  • Average time to invoice and get paid

If you use a TMS like Motive, Truckbase, or Rose Rocket, this data may be ready to pull. If not, it’s worth spending a day in your books and spreadsheets. Without these numbers, you’re flying blind.

Step 3: Break the Year into 90-Day Sprints

A one-year goal is too big to act on. That’s why we break it into four 90-day sprints. Each sprint should have 1–3 clear priorities. Not 5, not 10. Focus is what gets results.

Say your goal is to grow from 2 trucks to 4 trucks by year-end:

  • Q1: Stabilize operations and boost revenue per truck by 15%
  • Q2: Hire and onboard 1 qualified driver, reduce deadhead by 10%
  • Q3: Add truck #3 and move one lane to a dedicated route
  • Q4: Add truck #4, review profitability per lane, and prep systems for growth in the next year

Each 90-day sprint should have a mini “action plan” with weekly and monthly targets. You don’t need fancy software—a whiteboard and Google Sheet will do.

Step 4: Build a Weekly Scorecard

The difference between a dream and a result is accountability. That’s where a weekly scorecard comes in. This is your check-in tool to make sure you’re on track.

Track these metrics weekly:

  • Weekly revenue per truck
  • Weekly cost per mile
  • Number of direct shipper loads
  • On-time percentage
  • Fuel cost per unit
  • Number of new broker or shipper contacts made
  • Driver performance (MPG, communication, safety compliance)

Keep it visible. Review it every week—without fail. If something is off-track, adjust immediately. Don’t wait for Q2 to realize you missed the mark in Q1.

Step 5: Don’t Outgrow Your Infrastructure

Adding trucks before your systems are solid is how good carriers go broke. Growth is earned—not given. You grow when your current operation is clean, profitable, and replicable.

Checklist before you grow:

  • Are your existing trucks generating consistent weekly revenue?
  • Is your dispatch process documented and repeatable?
  • Can your maintenance vendor or plan support another truck?
  • Do you have cash flow to cover 60–90 days of extra fuel, insurance, and payroll?
  • Is your safety program ready to handle an additional driver without cutting corners?

If you can’t check those boxes, don’t grow yet. Fix your foundation first.

Step 6: Schedule Monthly Business Reviews

Once a month, block out 1–2 hours to review your plan. Not your loads. Not your emails. Your plan. This is your CEO time.

What to cover:

  • Actual vs target revenue and cost metrics
  • Load trends (lane shifts, broker quality, rate changes)
  • Deadhead or idle time issues
  • Upcoming renewals (insurance, tags, permits)
  • Feedback from customers or drivers
  • Opportunities for automation or outsourcing

If you’re solo, still do this. Document the meeting in a notebook or Google Doc. If you have a partner or team, involve them. Alignment is fuel for execution.

Step 7: Align Your Team Around the Plan

If you’ve got drivers, dispatchers, or admin help—loop them in. Growth is a team effort, not a secret.

Explain your goals in plain language:

  • “We’re aiming to increase revenue per truck by 10% this quarter.”
  • “We’re focusing on dedicated lanes to cut down on deadhead.”
  • “We’re testing a new dispatch system next month.”

Drivers who know the “why” behind decisions are more likely to buy in. Dispatchers who understand customer priorities make better calls. Even part-time admin help should understand your monthly targets.

No team? No problem. Treat yourself like a team of one. Schedule check-ins, write out goals, and hold yourself to them. Discipline builds momentum.

Final Word

There’s a difference between motion and progress. A lot of fleets stay busy but go nowhere. The ones that grow deliberately? They get clear, they track, and they adjust. That’s what a one-year growth map gives you: clarity.

You don’t need 100 trucks to build a strong business. You need strong systems. You need repeatable processes. You need targets that make sense for your goals. And you need the discipline to show up every week and work the plan.

Growth isn’t about doing more. It’s about doing what matters—on purpose, with a plan, and with accountability.

So before you throw more money at marketing, chase another low-rate load, or finance another truck, stop. Open your books. Set your baseline. And build your growth map.

Because scaling isn’t about going fast.

It’s about growing right.

July rail freight better but indicators cloud outlook

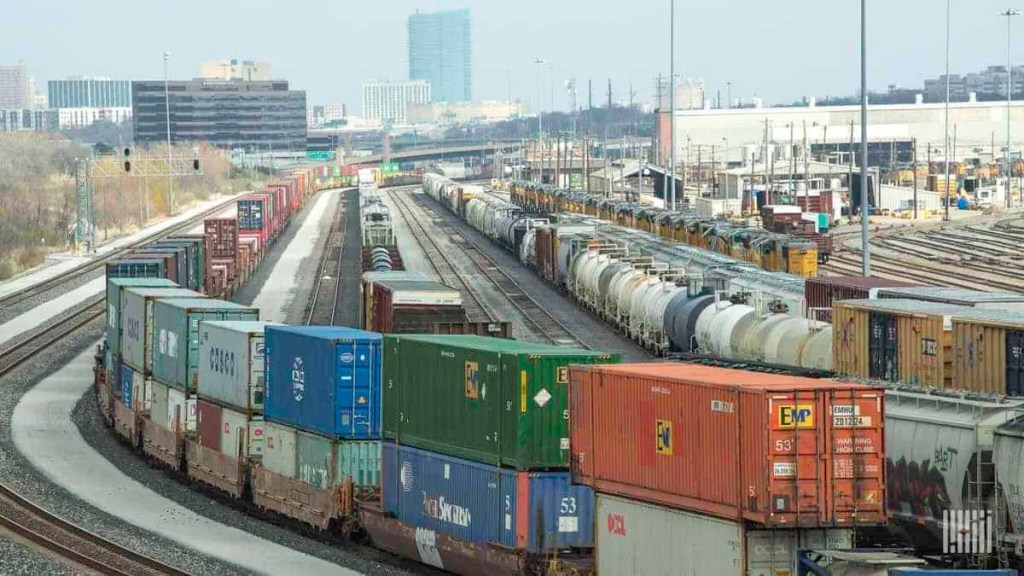
Intermodal and carloads showed improved resiliency in July in the face of increasingly concerning economic factors clouding the full-year outlook.

The U.S. economy has shown resilience this year, with the GDP posting an encouraging 3% annualized growth in the second quarter, a marked improvement from the 0.5% contraction in Q1, said Rand Ghayad, chief economist for the Association of American Railroads, in a research note. This rebound, as per the Bureau of Economic Analysis, benefits significantly from a reduction in goods imports and a positive inventory adjustment. Yet, this is juxtaposed against a backdrop of stagnating consumer spending, a crucial engine for GDP growth, which accounts for about 70% of the total economic output. Consumer spending edged up by only 0.1% in June, marking its smallest year-over-year gain in 16 months, raising concerns about sustained economic momentum.

In the labor market, July’s job growth figures were disappointing, with only 73,000 new jobs added, far below the historical trend. Alarmingly, previous months saw significant downward revisions, amounting to a reduction of 258,000 jobs. Unemployment inched up to 4.2%, while the tally of discouraged workers – people who want a job but have stopped looking because they don’t believe they’ll succeed – soared to 6.2 million. Long-term unemployment is another troubling metric, having reached levels unseen since December 2021, which may damp consumer confidence and spending power, influencing rail volumes, especially those tied to consumer goods.

Inflationary pressures, after cooling through the spring, have started to climb again. The Consumer Price Index saw a 2.7% year-over-year rise in June, its largest since February, casting uncertainty on consumer affordability and spending decisions. Inflation not only affects consumer expenditure but also challenges freight rail operators as operational costs rise, potentially affecting margins.

The manufacturing sector continues to face headwinds, with the Institute for Supply Management’s Manufacturing PMI dipping to 48% in July 2025, indicating contraction. With new orders lacking, the sector remains under pressure, feeding into lower demand for industrial rail freight. In contrast, the services sector, which wields considerable influence over economic health, hovered barely above contraction territory, recording a PMI of 50.1% in July. Should the services sector weaken further, it would adversely affect the broader economy, including rail freight.

Freight rail market: Stability amid volatility

Despite economic turbulence, the freight rail market has displayed remarkable resilience. U.S. rail intermodal shipments rebounded by 2.4% in July over the previous year. This recovery came on the heels of a decline in June and was driven by a rebound in business inventories and resurgent port activities. Total carloads were up 2.8%.

The AAR Freight Rail Index, which tracks volumes excluding coal and grain, rose by 4% from June to July, marking its first increase in four months. This uptick is indicative of underlying demand staying robust. Carloads, excluding coal, surged by 4.7%, reflecting growth across 15 out of the 20 categories monitored by AAR. Particularly notable are gains in grain, coal, chemicals, and industrial products.

Grain carloads rose by 13.5% in July, fueled by robust exports, which increased by 5.8% in the first half of the year, according to the U.S. Department of Agriculture, the most since 2022. Coal continued its recovery with a 4.5% increase in carloads on easier comparisons due to export disruptions from the Key Bridge collapse in Baltimore.

Chemical shipments, following a brief decline, bounced back by 3.3% in July, maintaining their upward trajectory and posting the most-ever rail shipments. Industrial products, including autos and steel, showed significant growth, underscoring resilience in manufacturing despite broader sectoral weaknesses.

“Despite some signs of resilience, the economy is flashing warning signals,” Ghayad said. “For freight railroads, rail volumes in recent months have remained relatively stable, but the near-term outlook remains challenging. The next few months will be critical in determining whether the economy regains its footing or slips further into stagnation.” 

Subscribe to FreightWaves’ Rail e-newsletter and get the latest insights on rail freight right in your inbox.

Find more articles by Stuart Chirls here.

Related coverage:

Union Pacific upping West Coast ports-to-Chicago intermodal stakes

Grain, automotive keep U.S. rail traffic ahead of 2024

Planned US-Mexico rail route advances with environmental report
Infrastructure fund pays $1B to acquire largest US regional railroad

Designing a Weekly Financial Health Check for Your Truck or Fleet

Trucking isn’t just about keeping the wheels turning—it’s about keeping the business running. Fuel, insurance, repairs, tolls, deadhead miles, factoring costs, and even overlooked expenses like app subscriptions or parking all chip away at your bottom line. Most small fleet owners and owner-operators wear all the hats, so it’s easy to let the financial side fall behind. But that’s where trouble starts. The difference between growth and shutdown often comes down to one thing: financial visibility. You can’t manage what you don’t measure.

This guide breaks down exactly how to build a weekly financial health check that keeps your business sharp. It’s not about fancy spreadsheets or accounting jargon. It’s about building a habit that gives you clarity, control, and decision-making power. When you know your numbers weekly, you can catch small leaks before they sink your operation. You can see where you’re winning, where you’re wasting, and where you need to pivot. Let’s dig in.

Why Weekly Beats Monthly

Waiting a month to review your numbers is like waiting until you’re out of fuel to check the tank. By then, you’re stalled.

  • Cash gaps build silently. A missed invoice, unexpected repair, or a delayed broker payment can put you behind without warning. Monthly check-ins catch it too late.
  • Bad habits compound. Overpaying for fuel, underpricing loads, or ignoring factoring costs gets expensive fast.
  • Opportunities get missed. If your best lane last week was high-margin and fast-turning, you should double down—not find out four weeks later.

Weekly checks give you:

  • Awareness before things go off track
  • Time to adjust routes, costs, and pricing
  • Confidence to make decisions based on facts, not feelings

It’s not about becoming a bookkeeper. It’s about running your business like a business.

The Five Core Components of a Weekly Financial Health Check

You don’t need a finance degree to do this. You just need a simple structure. Here are the five things every weekly check must cover.

1. Cash Flow Snapshot

This is your starting point. How much money actually came in? How much actually went out? What’s left?

Track this weekly:

  • Total deposits received (not just invoiced)
  • Total outgoing payments (fuel, repairs, insurance, tolls, factoring, etc.)
  • Net cash balance

If your net cash is shrinking week after week, something’s off. Maybe expenses are up. Maybe collections are slow. Maybe rates have dropped. This snapshot gives you a pulse check.

Also track your minimum operating cash threshold. Know what it costs to survive a week on the road. If you’re dipping below that line, it’s time to act.

2. Load Profit Review

Not every load pays the same—and some loads that look good on the surface are a loss once you count everything.

For every load you ran this week, track:

  • Gross revenue
  • Total miles (loaded and deadhead)
  • Gallons of fuel used
  • Actual fuel cost
  • Rate per mile (RPM)
  • Net profit after expenses (fuel, tolls, lumper fees, etc.)

Don’t stop at revenue. Look at true profit per load. One high-paying load with a 200-mile deadhead and two lumper fees might be a worse deal than a modest load with zero hassle.

Color-code your loads:

  • Green = profitable and repeatable
  • Yellow = break-even or minor profit
  • Red = you lost money

Over time, this helps you identify which lanes, brokers, and shippers are worth it—and which are bleeding you dry.

3. Operating Ratio (OR)

Your Operating Ratio tells you how much of your revenue gets eaten by costs.

Formula: (Total Weekly Operating Expenses / Total Weekly Revenue) x 100 = Operating Ratio

Interpret it this way:

  • Over 95% = Danger zone
  • 90% to 95% = Tight margin
  • 85% to 90% = Acceptable
  • Below 85% = Strong performance

Track this every week. It tells you how much margin you’re keeping. You could have a strong revenue week and still lose ground if your expenses are out of control.

4. Receivables Aging Report

Outstanding invoices can kill your cash flow even when business is strong. That’s why you must track what’s been billed but not paid.

Create a simple aging report:

  • Broker or customer name
  • Invoice number
  • Invoice date
  • Invoice amount
  • Days unpaid

Anything over 30 days = red flag. Anything over 45 days = collection action needed.

Have a reminder to follow up with any broker or customer that goes silent. Cash in hand beats revenue on paper.

5. Upcoming Financial Obligations

This is about getting ahead of payments before they surprise you.

Each week, look 2–3 weeks ahead. Review:

  • Loan or lease payments
  • Insurance premiums
  • IFTA or tax filing deadlines
  • Scheduled maintenance or DOT inspections
  • Large expected expenses (new tires, registration renewals, etc.)

Flag any big expense coming in the next 14 days. Set a reminder. Budget for it. Don’t let it sneak up.

Building the Habit: Your Weekly Routine

Don’t wing it. Make this a system.

Pick your check-in time.

  • Friday morning before dispatch
  • Sunday evening while planning next week
  • Monday first thing to start clean

Whatever works, block it off.

Suggested Weekly Flow:

  1. Pull your load summary or dispatch log
  2. Log all revenue collected
  3. Log all expenses paid
  4. Calculate net cash and OR
  5. Review load profitability per trip
  6. Update invoice aging report
  7. Look ahead to any big bills due
  8. Make one business adjustment based on what you learned

That last one is critical. Don’t just review—respond. Shift lanes. Cut a cost. Chase a payment. Negotiate a better rate. Action creates change.

Tools That Get It Done

You don’t need a fleet management system or bookkeeping software.

Simple Tools That Work:

  • Google Sheets or Excel templates
  • Load tracking notebooks
  • Whiteboard trackers
  • Notion or Trello for task reminders
  • Bank app for cash snapshot

The goal is visibility and consistency—not perfection.

Mistakes to Avoid

Some habits seem harmless until they pile up. Avoid these:

  • Only tracking gross revenue. Profit happens after expenses.
  • Waiting for tax season to look at finances. April is too late.
  • Ignoring unpaid invoices. That’s money left on the table.
  • Not paying yourself. If you’re working but broke, you’re not profitable.
  • Estimating costs instead of logging them. Guesswork leads to wrong pricing.

The fix? Treat your weekly check as seriously as your next load.

Monthly Roll-Up

At the end of the month, use your weekly data to:

  • Spot average profit per load
  • Identify your top 3 most profitable lanes
  • Review which brokers paid fastest and slowest
  • See which weeks had the best OR

This gives you long-range clarity without scrambling to reconstruct 30 days of receipts and trips.

Final Word

In this industry, gross revenue might impress people—but net profit keeps the wheels turning.

If you’re not running a weekly financial check, you’re driving blind. Every breakdown, every bounced payment, every slow week hits harder when you don’t know where your money is or where it’s going.

You don’t need to be perfect. You need to be consistent.

Block the time. Run the numbers. Take action.

Because in this business, the owner-operators and fleet owners who last aren’t the ones with the flashiest equipment. They’re the ones who know their numbers inside and out, week after week.

Discipline is the secret weapon. And it starts with 30 minutes. Every single week. No excuses.

The Simple Way to Organize Your Trucking Documents for Weekly Review

Let’s talk facts: Paperwork doesn’t make you money—but if you get it wrong, it will cost you money. A missing POD? Delayed payment. A lost rate con? No detention. Bad compliance files? Fines or shutdowns. And here’s the hard truth—most small fleets and owner-operators are bleeding cash because their documents are scattered across emails, glove boxes, and dispatch group chats.

In 2025, staying organized isn’t a nice-to-have—it’s a business survival skill. This guide breaks down a clean, tactical document system that keeps your cash flow moving, your files audit-ready, and your drivers in sync. No software to buy. No VA required. Just structure, discipline, and a simple weekly routine. Let’s get into it.

Why Document Organization Is Non-Negotiable in 2025

When these documents go missing or get filed in the wrong place, your business starts leaking money. You don’t get paid. You fail audits. You lose trust with brokers and customers. One missing POD can snowball into weeks of delays and unnecessary phone calls.

Examples of what goes wrong:

  • A missed detention fee because there’s no signed rate con.
  • A delayed invoice because the POD is still in a driver’s cab.
  • A failed DOT audit because your driver file is incomplete.
  • A lost fuel receipt that throws off your IFTA filing.

There’s no profit margin for disorganization in a one-truck or five-truck operation. When cash flow is tight, every delay, fine, or lost dollar matters.

Start With One Rule: Centralize Everything

Action Plan:

  • Create a shared cloud folder: “Trucking Docs 2025.” Use Google Drive, Dropbox, or OneDrive.
  • Inside that, make five subfolders:
    1. Rate Cons
    2. PODs
    3. Fuel Receipts
    4. Maintenance
    5. Compliance
  • Standardize file names like this: 2025-07-15_RateCon_Load12345.pdf
  • Use scanning apps (CamScanner, Adobe Scan) to upload clean, legible files. No blurry photos.
  • Include a shared master tracker (spreadsheet) that logs every document uploaded by date, load #, and type.

Tip: Give your admin “edit” access. Drivers get “view only” so they can’t delete or overwrite files.

Once you build this central hub, it becomes your business command center.

Driver Buy-In: Train It or Lose It

How to train your team:

  • Walk them through the upload process during orientation.
  • Show drivers how to scan and upload docs before they leave the dock.
  • Require uploads within 24 hours of delivery—not later.
  • Review file quality weekly—blurry scans, missing load numbers, or unsigned PODs don’t get paid.

What to enforce:

  • Upload = paid. No upload = no settlement until the POD is in.
  • Offer small bonuses for consistent compliance. Example: $25 fuel card for a full month of clean uploads.

What fleets report: Fleets that enforce these policies see:

  • Faster invoicing and payment cycles
  • Fewer disputes with brokers
  • More reliable cash flow

The system only works if your drivers are on board.

The Weekly Review Checklist That Saves You Thousands

Here’s your checklist:

  1. Rate Cons: Verify each load is matched. Confirm detention, TONU, layover fees are recorded.
  2. PODs: Confirm each POD is signed and legible. No POD = no invoice.
  3. Fuel Receipts: Match dates and locations to ELD logs. Flag price spikes.
  4. Maintenance Logs: Check for completed services and upcoming inspections.
  5. Compliance Docs: Review driver files, insurance, IFTA mileage.

Documentation Tracker Tips:

  • Use color-coded columns to flag missing items
  • Add notes for any document that needs follow-up
  • Keep a “Needs Attention” tab for unresolved issues

Insight: Treat this like a team huddle—even if it’s just you. This is how you stay in control.

Don’t Be a Hero—Automate Smartly

Suggested automations:

  • Email Filters: Automatically route driver emails with “POD” or “Rate Con” in the subject line into specific folders.
  • Calendar Alerts: Remind yourself and your team about Friday reviews, monthly IFTA checks, and insurance renewals.
  • Invoicing Tools: Use free or low-cost tools like Wave, Zoho, or QuickBooks to pull docs and create invoices in 1 click.

Compliance Files: Your Audit Shield

What you need on hand at all times:

  • Driver licenses and medical cards (non-expired)
  • ELD log summaries
  • Annual inspection reports
  • Insurance and registration documents
  • IFTA filings (last 4 quarters)

Systemize it:

  • Do a monthly check of all expiration dates
  • Store digital and physical copies (cloud + fireproof box)
  • Use a simple checklist to avoid gaps

Failing to provide a single document during an audit can trigger fines or an out-of-service order.

What to Watch For
If you’re seeing these problems, your system needs work:

  • PODs that don’t get uploaded = invoices that don’t get sent
  • Rate cons without accessorials noted = money left on the table
  • Inconsistent file names = lost files in audits
  • Admins hoarding files on local computers = no visibility, no backups

Simplify your system until it runs itself. If it feels too hard, it won’t get done. Make it clean, repeatable, and dead simple. Then protect it like it’s your paycheck—because it is.

Final Word

The carriers who win in 2025 aren’t the ones running the most trucks—they’re the ones running the tightest systems. Know where every document lives. Train your team to follow the process. Automate where you can. Review every Friday.

You don’t need perfection. You need consistency. That’s what keeps your trucks moving, your invoices paid, and your name off the DOT’s radar.

Build the system. Use it every week. That’s how you win.

Freight demand on shaky footing as import bookings drop

Chart of the Week:  Inbound Ocean TEUs Volume Index, Outbound Loaded Container on Rail Index, Outbound Tender Volume Index – USA SONARIOTI.USA, ORAILL.USA, OTVI.USA

Container import demand (IOTI) has collapsed over the past month, joining the truckload (OTVI) market in posting double-digit year-over-year declines. Intermodal (ORAILL) has remained relatively resilient, but given its close ties to import volumes, it may not be far behind.

Uncertainty continues to dominate business decision-making, as companies remain impacted — directly or indirectly — by erratic trade policies and the rhetoric surrounding them. While this market has been anything but predictable, current indicators point to a relatively soft second half of 2025. Let’s walk through the supply chain to understand why.

Seasons shift

The trade war has disrupted traditional seasonal freight patterns, and nowhere is that more evident than in the import sector. Aggressive tariff threats and implementations have prompted shippers to pull orders forward in an effort to avoid higher duties.

In April, a 145% tariff on Chinese goods led to a 42% drop in containerized import bookings from China to the U.S. Since China accounts for over 30% of all containerized imports to the U.S., this has had a disproportionate impact on the domestic freight market.

This sharp drop in imports had minimal effect on the already deflated truckload market, which has lost most of its long-haul share to intermodal. However, it did noticeably impact intermodal volumes, which were down a modest 5% year-over-year in early June.

Once the tariff was paused, ordering resumed at a rapid pace, peaking in late June and early July before falling off again. Traditionally, the peak season for container imports occurs in late July and August as retailers prepare for the holidays. This year, much of that activity appears to have happened one to two months early.

What that means for intermodal

Intermodal typically peaks in September and October. However, the early surge in imports suggests we could see an earlier-than-usual intermodal peak — particularly for international containers.

Still, the latest Logistics Manager’s Index (LMI) report offers a counterpoint: inventories are currently being held upstream to avoid the higher costs of storing goods closer to the end consumer. This strategy could lead to a more spread-out or “diffused” intermodal peak, with international volumes moving earlier and domestic movements occurring closer to the traditional time frame.

Several carriers have already announced peak season surcharges for September, which could accelerate some freight movement if capacity allows.

The trucking market is likely to continue its slow burn as capacity exits unless demand unexpectedly spikes. For now, consumption remains sluggish, giving shippers ample lead time to manage inventory replenishment.

A few wild cards

Hurricanes could temporarily disrupt freight networks, but recent years have shown that winter weather events have a more lasting impact.

Holiday shipping may be chaotic if shippers are caught flat-footed. The ongoing uncertainty may leave businesses without a clear sense of consumer demand, forcing them into reactive logistics strategies. With leaner networks and less buffer in capacity, even small disruptions could snowball into panic.

The broader economy remains the most unpredictable variable. While interest rate cuts, tariff deals, tax breaks, or other incentives could jumpstart investment, a significant economic rebound in 2025 still appears unlikely.

About the Chart of the Week

The FreightWaves Chart of the Week is a chart selection from SONAR that provides an interesting data point to describe the state of the freight markets. A chart is chosen from thousands of potential charts on SONAR to help participants visualize the freight market in real time. Each week a Market Expert will post a chart, along with commentary, live on the front page. After that, the Chart of the Week will be archived on FreightWaves.com for future reference.

SONAR aggregates data from hundreds of sources, presenting the data in charts and maps and providing commentary on what freight market experts want to know about the industry in real time.

The FreightWaves data science and product teams are releasing new datasets each week and enhancing the client experience.

To request a SONAR demo, click here.